Which of the following represents the graph between log p (on Y-axis) and 1/T (on X-axis) ?
A

B

C

D

Text Solution
The correct Answer is:B
|
Updated on:21/07/2023
Similar Questions
Knowledge Check
- Question 1 - Select One
Which one of the following represents the graph between log P on Y - axis and 1/T on X - axis ? (P = vapour pressure of a liquid, T = absolute temperature)
A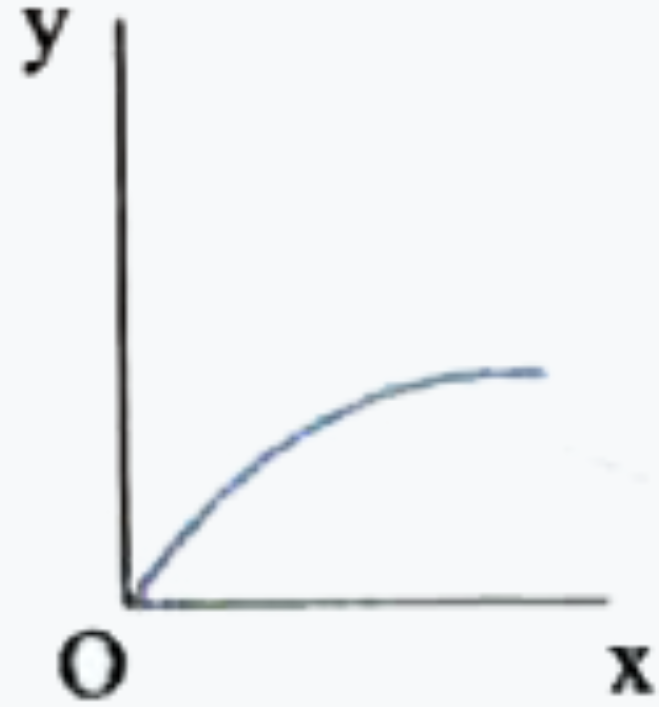 B
B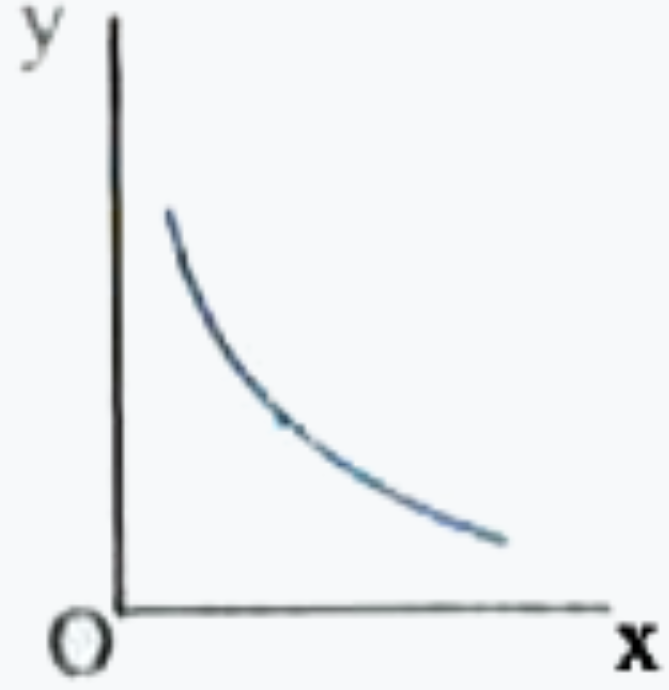 C
C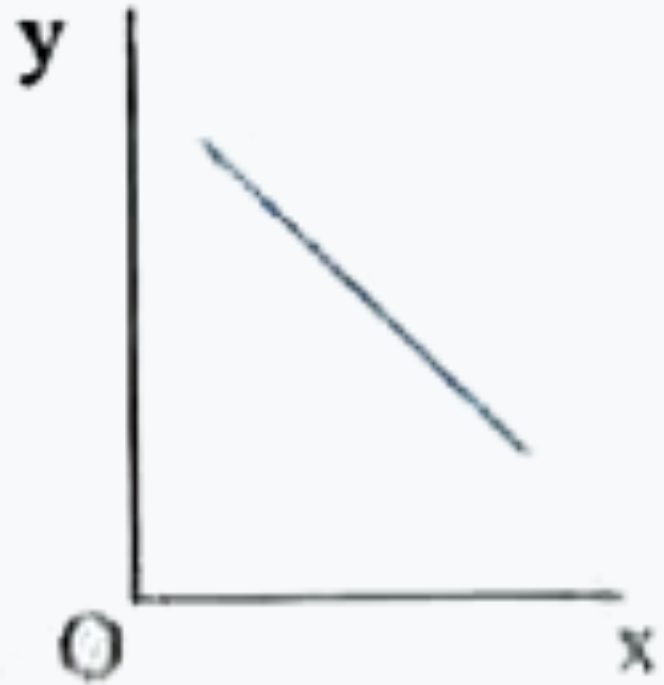 D
D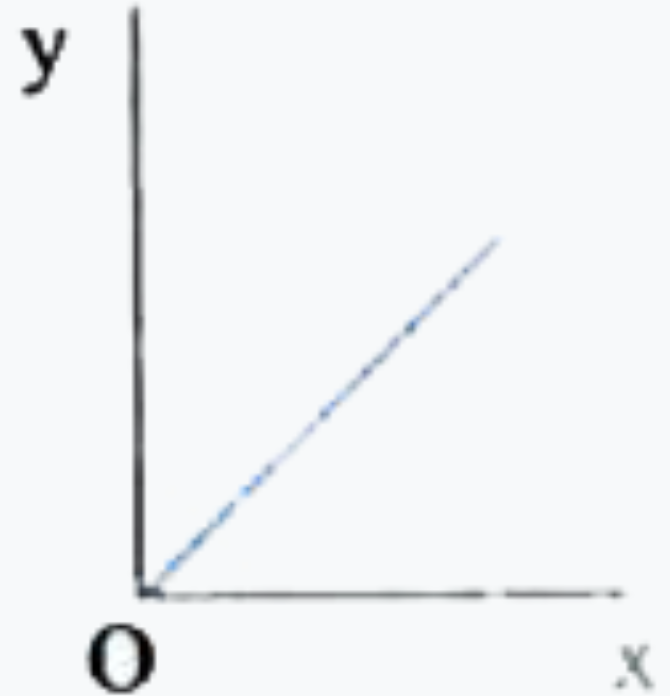
- Question 2 - Select One
Which of these curves represents Henry's law graph between partial pressure on y - axis mole fraction of gas on x - axis
A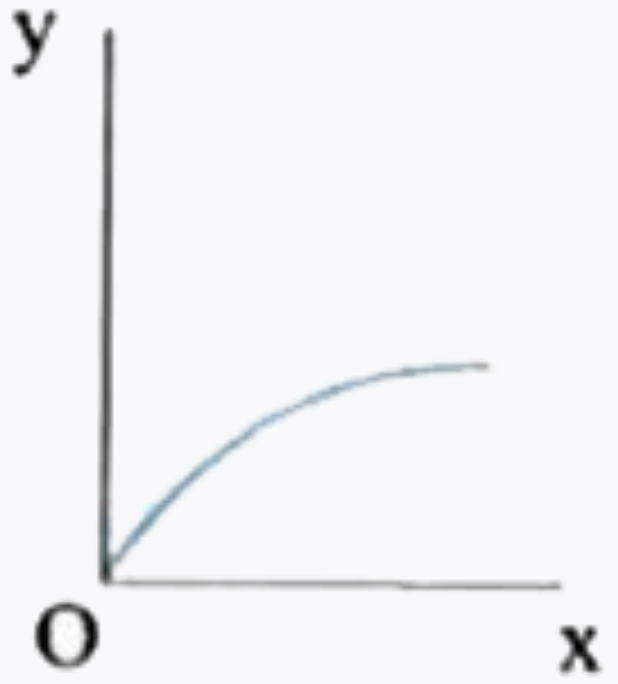 B
B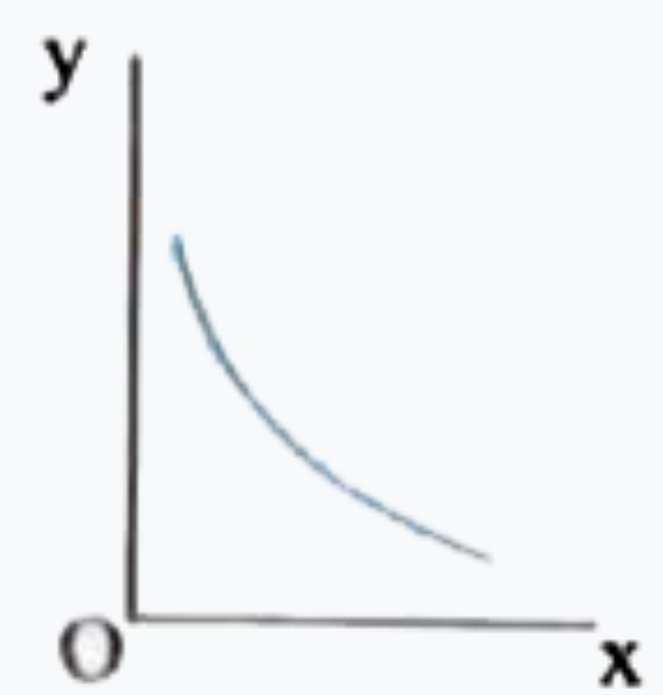 C
C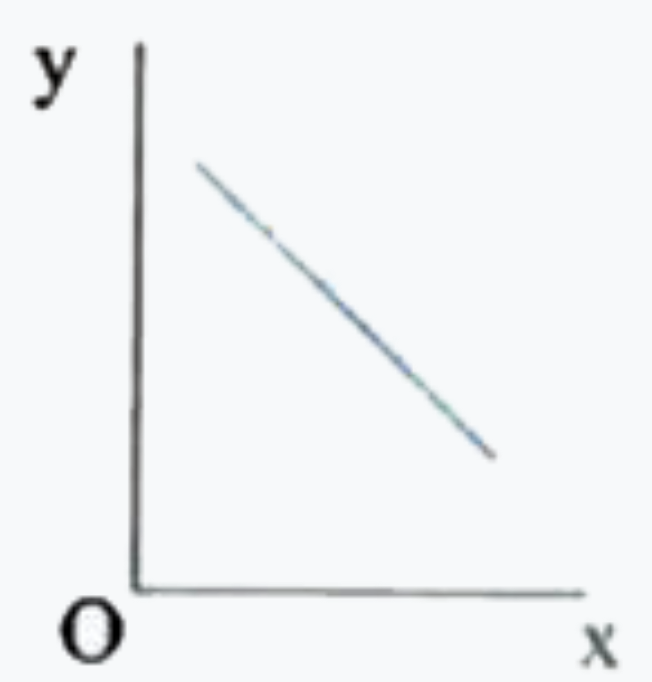 D
D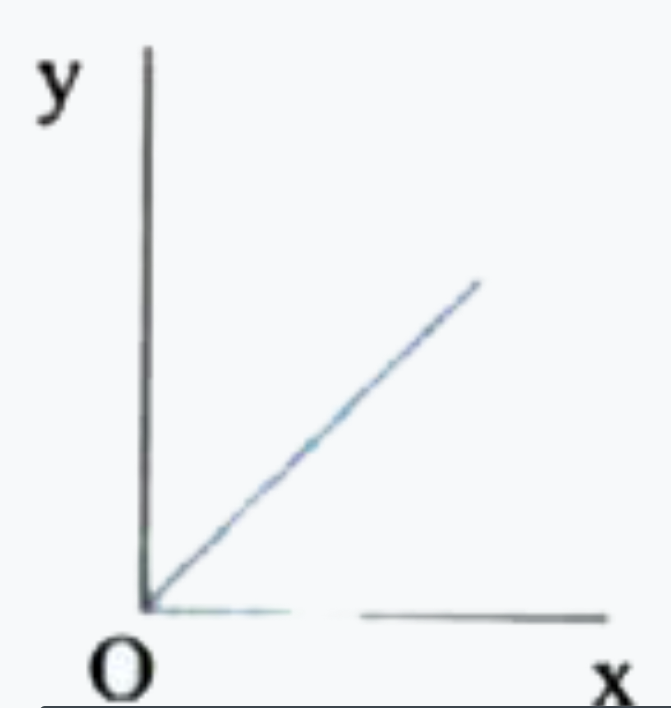
- Question 3 - Select One
By plotting log x/m on y-axis and log P on x-axis we s hould get
A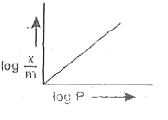 B
B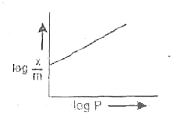 C
C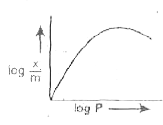 D
D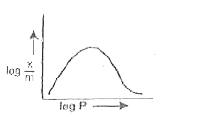
Assertion : In a Distance-Time graph, time represents the independent variable.
Reason : Time is represented on y-axis and distance on x-axis.View SolutionThe flux linked with a circuit is given by ϕ=t3+3t−7 . The graph between time (x-axis) and induced emf (y-axis) will be
View SolutionA graph plotted between log k vs 1T is represented by
View SolutionFor a real gas obeying van der waal's equation , graph is plotted between PVm (y- axis) and P (x - axis) where Vm is molar volume . Y - intercept the graph is
View SolutionFor a first order reaction, when a graph is plotted between log10([A])0([A])t on y-axis and time (t) on x-axis , slope of the graph of the graph is equal to __________.
View Solution


