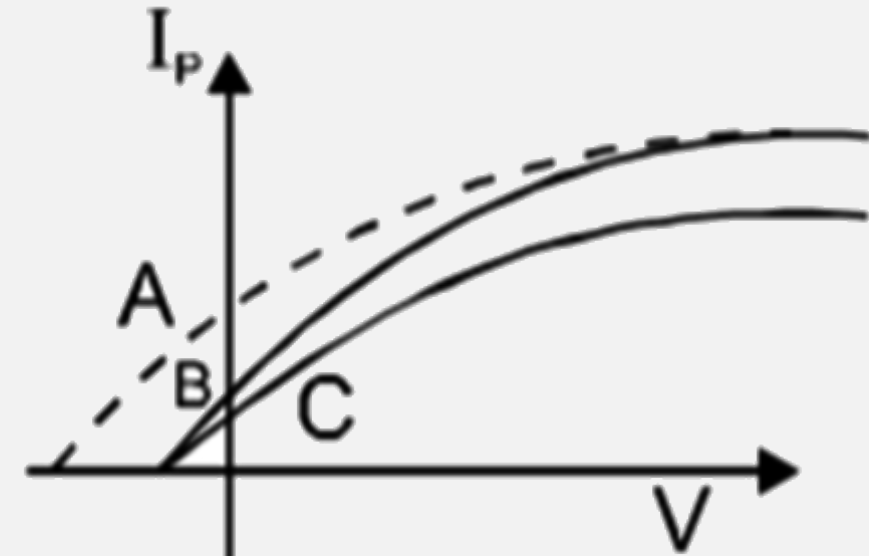
From the following graph of photocurrent against collector plate potential for two different intensities of light I1andI2 one can , conclude
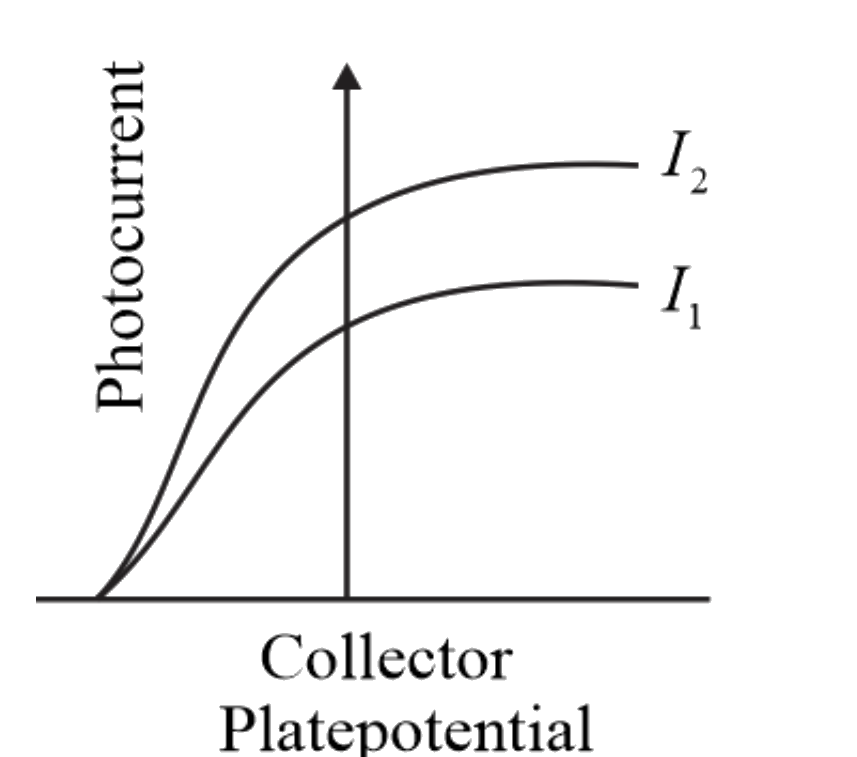
I1=I2
I1>I2
I1<I2
Comparison is not possible
The correct Answer is:C
Step by step video & image solution for From the following graph of photocurrent against collector plate potential for two different intensities of light I_1 and I_2 one can , conclude by Physics experts to help you in doubts & scoring excellent marks in Class 12 exams.
Updated on:21/07/2023Similar Questions
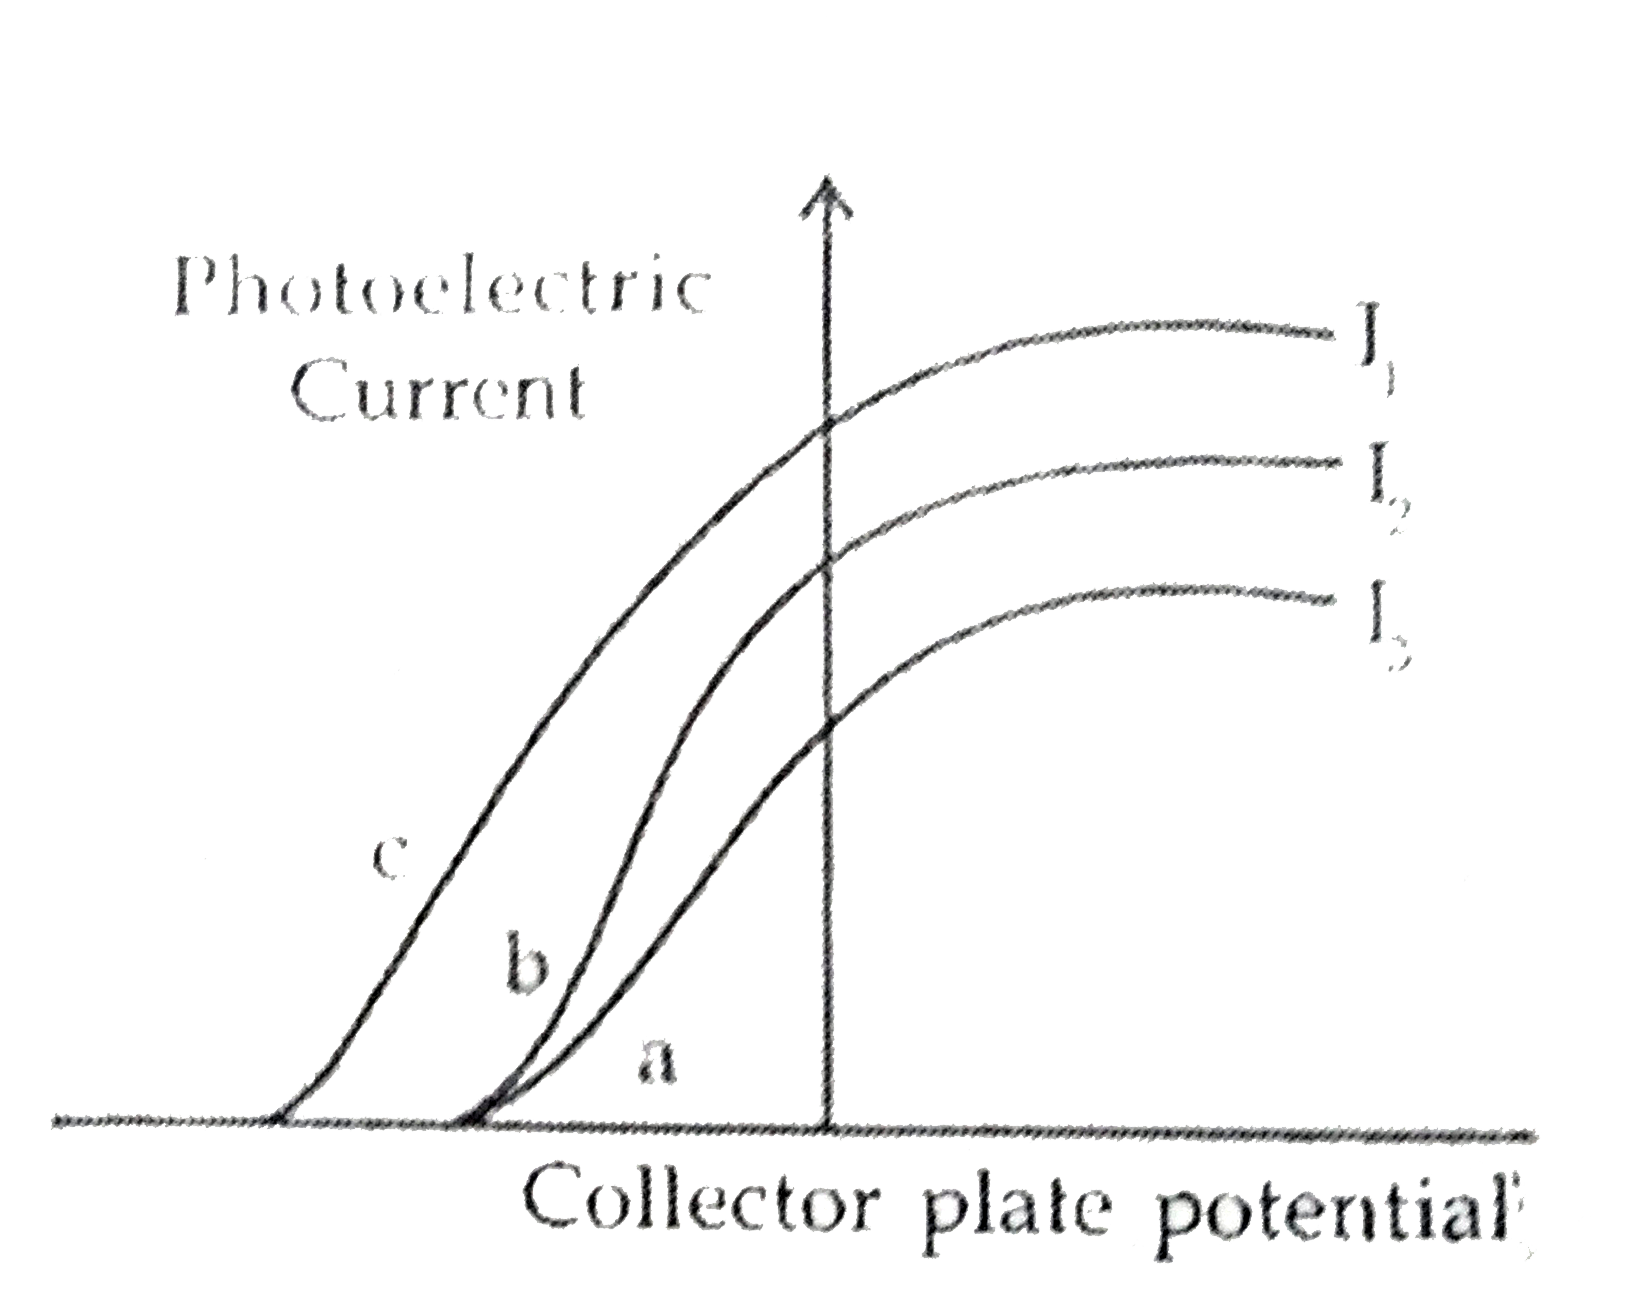
The figure shows a plot of three curves a, b, c, showing variation of photocurrent vs collector plate potential for three different intensities I1,I2andI3 having frequencies v1,v2andv3 respectively incident on a photosensitive surface.
Point out the two curves for which the incident radioations have same frequency but different intensities.
View SolutionDraw a plot showing the variation of photoelectric current with collector plate potential for two different frequencies, v1>v2 of incident radiation having the same intensity. In which case will the stopping potential be higher? Justify your answer.
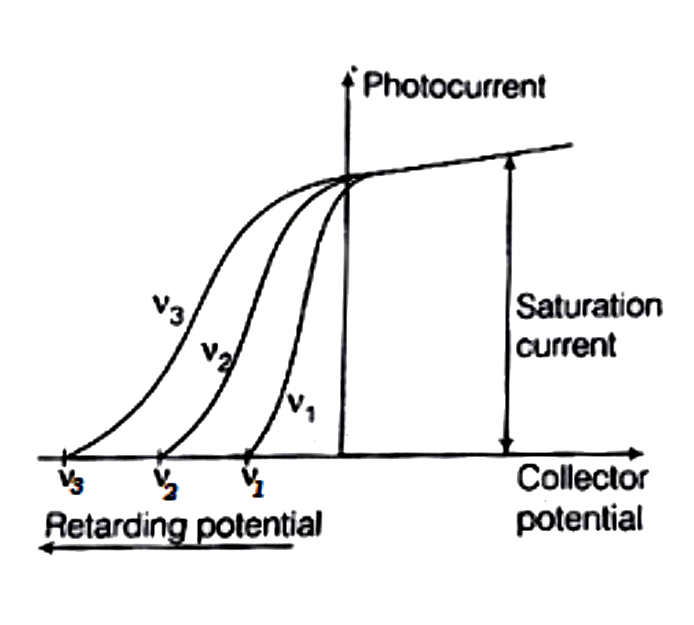
View SolutionThe variation of photocurrent with collector potential for different frequencies of incident radiation v1,v2,v3 is as shown in the the graph , then
View SolutionThe curves (a),(b),(c) and (d) show the variation between the applied potential difference (V) and the photoelectric current (i) , at two different intensities of light (I1>I2). In which figure is the correct variation shown ?
View SolutionThe graph between photo electric current and cathode potential when the anode is kept at zero potential, for light of two different intensities out of the same frequency looks like the one:
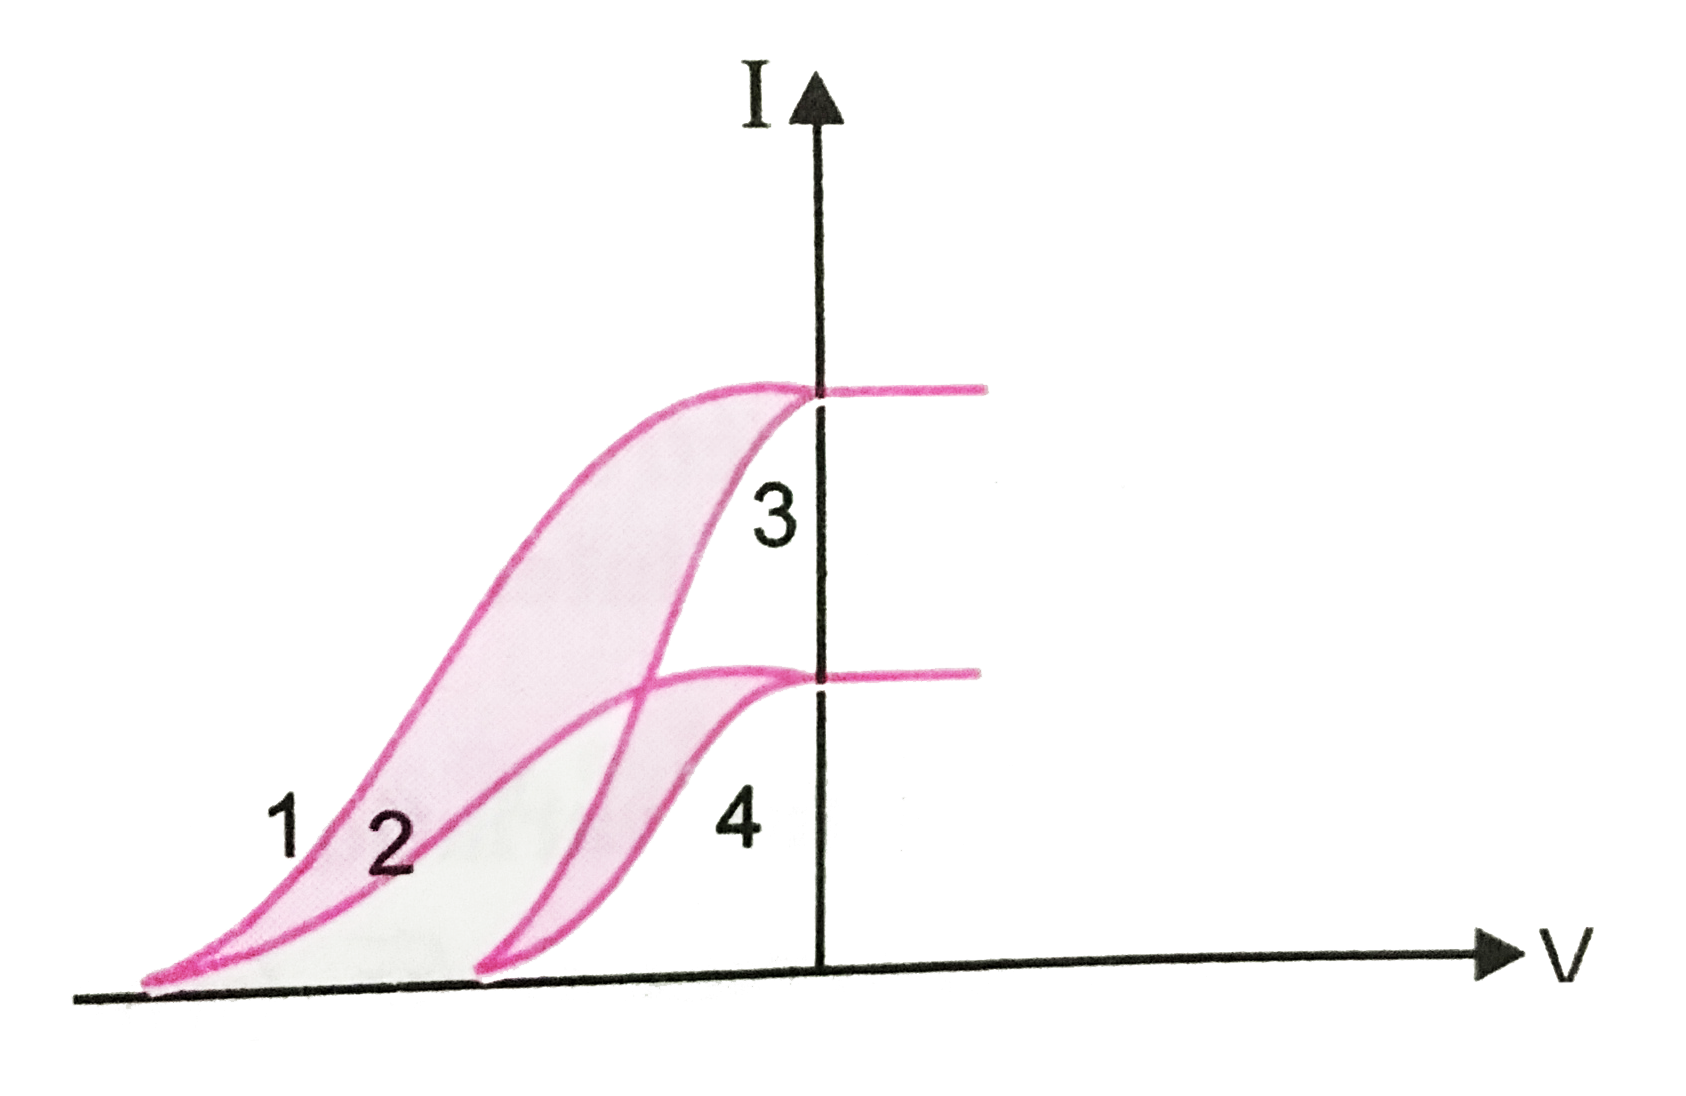
View SolutionThe graph of Fig. shows the variation of photoelectric current (I) versus applied voltage (V) for the two different photosensitive materials for two different intensities of the incident radiation. Identify the pairs of curves that correspond to different materials but same intensity of incident radiation.
View SolutionThe graph shows the variation of photocurrent with the applied voltage in a photoelectric effect experiment for three different beams of light falling on identical metal surfaces, then which among the following is correct ?
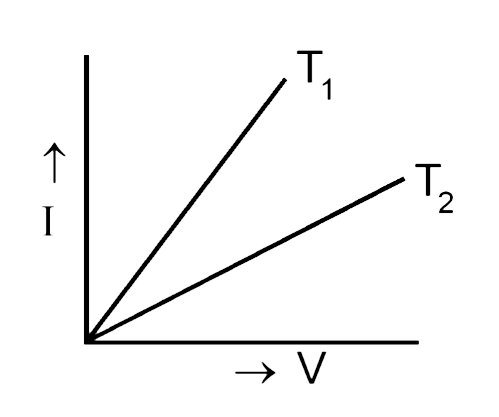
View SolutionThe current (I) and voltage (V) graphs for a given metallic wire at two different temperature (T1) and (T2) are shown in fig. It is concluded that
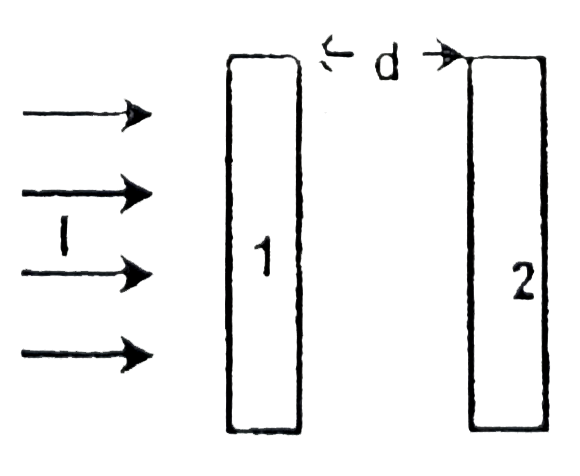
View SolutionTwo parallel large metal plates, each of area A are piaced at a distance d apart. Light of intensity I and wavelength λ falls on the plate 1 which is photosensitive. The efficiency of photoelectron emission is 100%. The photoelectrons are immediately swept away from plate 1 in such a way that the plate 2 remains neutral. Find the potential difference between the two plates at any time t, if plate 1 is neutral initially.
View SolutionThe maximum intensities produced by two coherent waves of intensity I1 and I2 will be:
View Solution