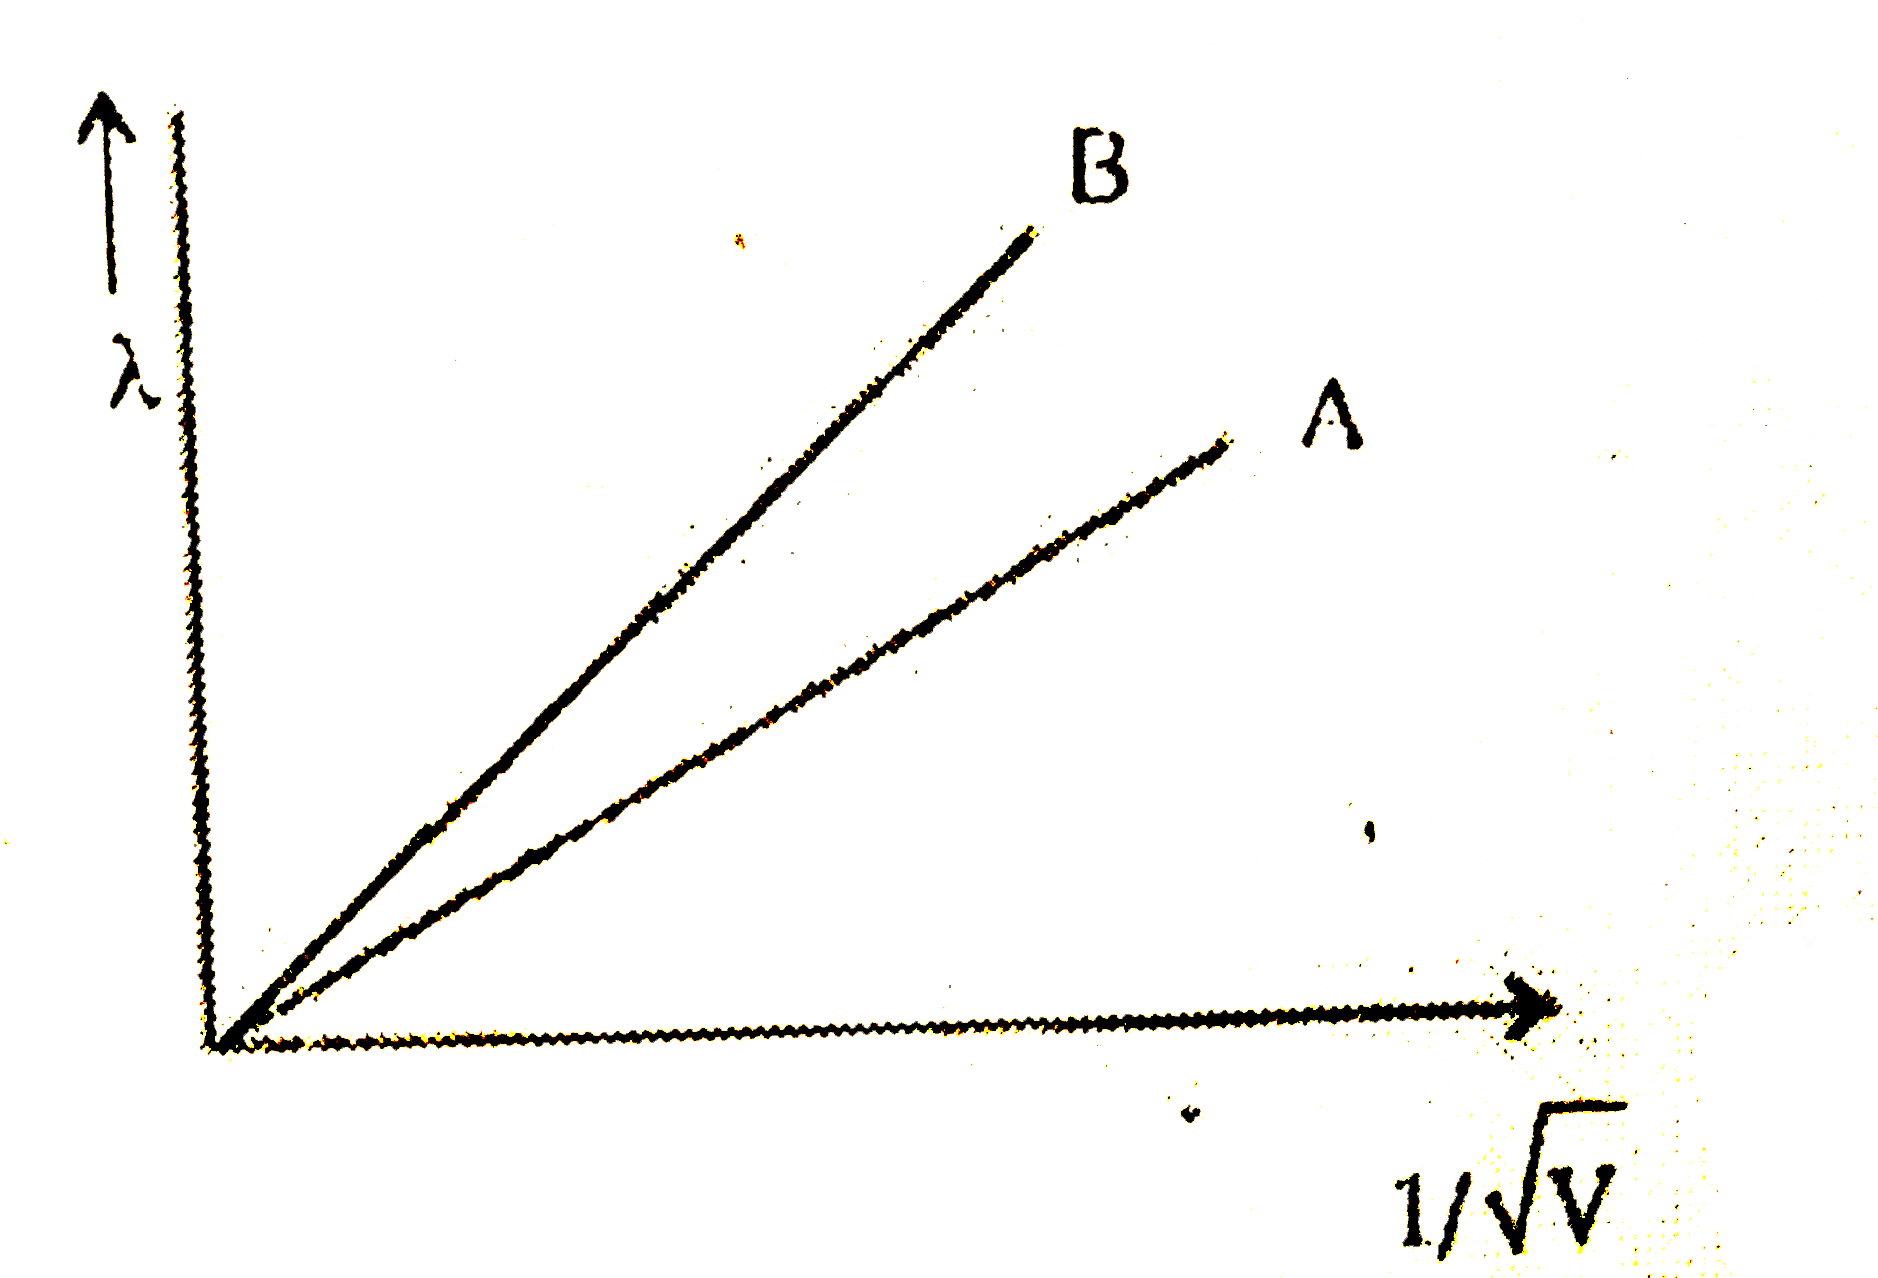
Plot a graph showing variation of a de Broglie wavelength (λ) associated with a charged particle of mass m, verses 1/√V, where V is the potential difference thrugh which the particle is accelerated.
To plot the graph showing the variation of de Broglie wavelength (λ) associated with a charged particle of mass m versus 1√V, we can follow these steps:
1. Understand the de Broglie Wavelength Formula:
The de Broglie wavelength λ is given by the formula:
λ=hp
where h is Planck's constant and p is the momentum of the particle.
2. Relate Momentum to Kinetic Energy:
The kinetic energy K of a charged particle accelerated through a potential difference V is given by:
K=12mv2
The momentum p can be expressed in terms of kinetic energy:
K=p22m⟹p=√2mK
3. Substituting Kinetic Energy with Potential Energy:
When a charged particle of charge q is accelerated through a potential difference V, its kinetic energy can also be expressed as:
K=qV
Therefore, we can write:
p=√2mqV
4. Substituting Momentum into the Wavelength Formula:
Now substituting the expression for p back into the de Broglie wavelength formula:
λ=h√2mqV
5. Expressing Wavelength in Terms of 1√V:
From the above equation, we can rearrange it to show the relationship with 1√V:
λ∝1√V
This indicates that λ is directly proportional to 1√V.
6. Graphing the Relationship:
To plot the graph, we will take values of 1√V on the x-axis and the corresponding values of λ on the y-axis. Since λ is directly proportional to 1√V, the graph will be a straight line passing through the origin.
The de Broglie wavelength λ is given by the formula:
λ=hp
where h is Planck's constant and p is the momentum of the particle.
The kinetic energy K of a charged particle accelerated through a potential difference V is given by:
K=12mv2
The momentum p can be expressed in terms of kinetic energy:
K=p22m⟹p=√2mK
When a charged particle of charge q is accelerated through a potential difference V, its kinetic energy can also be expressed as:
K=qV
Therefore, we can write:
p=√2mqV
Now substituting the expression for p back into the de Broglie wavelength formula:
λ=h√2mqV
From the above equation, we can rearrange it to show the relationship with 1√V:
λ∝1√V
This indicates that λ is directly proportional to 1√V.
To plot the graph, we will take values of 1√V on the x-axis and the corresponding values of λ on the y-axis. Since λ is directly proportional to 1√V, the graph will be a straight line passing through the origin.
Topper's Solved these Questions
- BOOK - XII BOARD PREVIOUS YEAR PAPER ENGLISHCHAPTER - XII BOARDSEXERCISE - SECTION-C50videos
XII BOARDS
- BOOK - XII BOARD PREVIOUS YEAR PAPER ENGLISHCHAPTER - XII BOARDSEXERCISE - PHYSICS (Theory) DELHI BOARD -2016 [SET -I][COMPTT.]11videos
XII BOARDS
- BOOK - XII BOARD PREVIOUS YEAR PAPER ENGLISHCHAPTER - XII BOARDSEXERCISE - SECTION-A28videos
XII BOARDS
- BOOK - XII BOARD PREVIOUS YEAR PAPER ENGLISHCHAPTER - SAMPLE PAPER 2019EXERCISE - SECTION D6videos
SAMPLE PAPER 2019
Similar Questions
Knowledge Check
- Question 1 - Select One
The de Broglie wavelength associated with a ball of mass 150 g travelling at 30 m s−1 is
A1.47×1−34mB1.47×1−16mC1.47×1−19mD1.47×1−31m
The wavelength of a charged particle ………….. the square root of the potential difference through which it is accelerated .
View SolutionThe de Broglie wave length associated with a particle of mass 1 mg moving with a velocity of 1m/sec is
View SolutionWrite the expression for the de-Broglie wavelength associated with a charged particle having charge 'q' and mass 'm' when it is accelerated by a potential V.
View SolutionThe de-Broglie wavelength L associated with an elementary particle of linear momentum p is bets represented by the graph
View SolutionThe de-Broglie wavelength associated with a particle of mass 10−6kg moving with a velocity of 10ms−1, is
View SolutionTwo lines, A and B, in the plot given below show the variation of de-Broglie wavelength, λ versus 1/√V, where V is the accelerating potential difference, for two particles carrying the same charge. Which one of two represents a particle of smaller mass?
 View Solution
Plot a graph showing variation of de-broglie wavelength λ versus 1/√V, where V is accelerating potential for two particle A and P carrying same charge but of masses m1andm2(m1>m2). Which one of the two represents a particle of smaller mass and why?
View Solution

