Following are the marks obtained, out of 100, by two students Ravi and Hashina in 10 life? Ravi: 25 50 45 30 70 42 36 48 35 60 Hashina: 10 70 50 20 95 55 42 60 48 80 .Who is more intelligent and who is more consistent?
Step by step video & image solution for Following are the marks obtained, out of 100, by two students Ravi and Hashina in 10 life? Ravi: 25 50 45 30 70 42 36 48 35 60 Hashina: 10 70 50 20 95 55 42 60 48 80 .Who is more intelligent and who is more consistent? by Maths experts to help you in doubts & scoring excellent marks in Class 11 exams.
Updated on:21/07/2023Topper's Solved these Questions
Similar Questions
Find the standard deviation of the following set of numbers:
25, 50, 45, 30, 70, 42, 36, 48, 34, 50
View SolutionFind the mean of the marks obtained by 30 students of Class IX of aschool, given in Example 2.10 20 36 92 95 40 50 56 60 7092 88 80 70 72 70 36 40 36 40 92 40 50 50 56 60 70 60 60 88
View SolutionConsider the marks obtained (out of 100 marks) by 30 students of Class IX of a school: 10 20 36 92 95 40 50 56 60 7092 88 80 70 72 70 36 40 36 4092 40 50 50 56 60 70 60 60 88 Recall that the number of students who have obtained a certain number of marks is called the frequency of those marks. For instance, 4 students got 70 marks. So the frequency of 70 marks is 4. To make the data more easily understandable, tabulate the data.
View SolutionFind the mode of the following distribution of marks obtained by 80 students: Marks obtained 0-10 10-20 20-30 30-40 40-50 No. of students 6 10 12 32 20
View SolutionFind the mode of the following distribution of marks obtained by 80 students: Marks obtained 0-10 10-20 20-30 30-40 40-50 No. of students 6 10 12 32 20
View SolutionFind the mode of the following distribution of marks obtained by 80 students: Marks obtained 0-10 10-20 20-30 30-40 40-50 No. of students 6 10 12 32 20
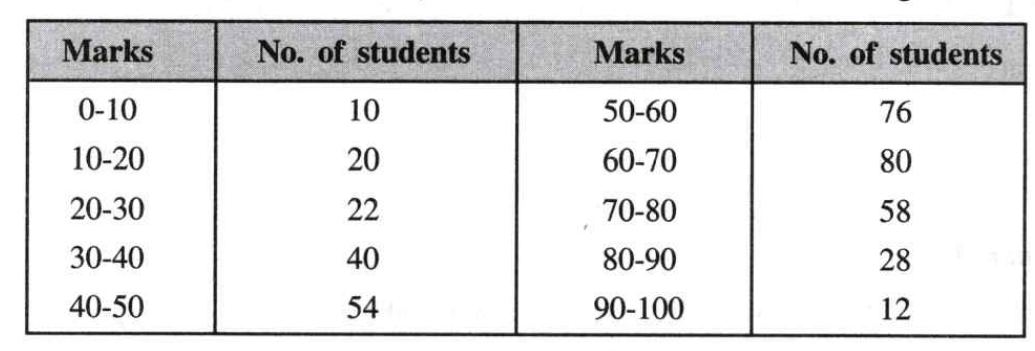
View SolutionThe marks obtained (out of 100) by 400 students in an examination are given below:

Using a graph paper, draw an ogive for the above distribution. Use ogive to estimate the following: estimate the number of students who obtained more than 80% marks in the examination.
View SolutionFollowing table shows the marks scored by a group of 90 students in a mathematics test of 100 marks. Marks 0-20 20-30 30-40 40-50 50-60 60-70 70-100 No. of Students: 7 10 10 20 20 15 8 Find the probability that marks scored by a student in the class is: at most 60 marks (ii) at least 60 marks (iii)not more than 50 marks
View SolutionThe following table gives the marks scored by 378 students in an entrance examination : Marks 0-10 10-20 20-30 30-40 40-50 50-60 60-70 70-80 80-90 90-100 No. of Students 3 12 36 76 97 85 39 12 12 6 From this table form (i) less than series, and (ii) the more than series.
View SolutionFrom the following data, using mean, calculate mean deviation and the coefficient of mean deviation.
10, 70, 50, 53, 20, 95, 42, 60, 48, 80
View Solution
