If each one of the following graphs is the graph of a polynomial, then identify which one corresponds to a linear polynomial and which one corresponds to a quadratic polynomial? (FIGURE)
To identify which graphs correspond to linear and quadratic polynomials, we will analyze the characteristics of each graph based on their shapes.
Step 1: Analyze the first graph (y = f(x))
- Observation: The first graph is a parabola that opens upwards.
- Conclusion: Since it has a U-shape, it indicates that it is a quadratic polynomial. Quadratic polynomials can be expressed in the form ax2+bx+c where a is positive.
Step 2: Analyze the second graph (y = g(x))
- Observation: The second graph is a straight line.
- Conclusion: A straight line indicates that this is a linear polynomial. Linear polynomials can be expressed in the form mx+b where m is the slope.
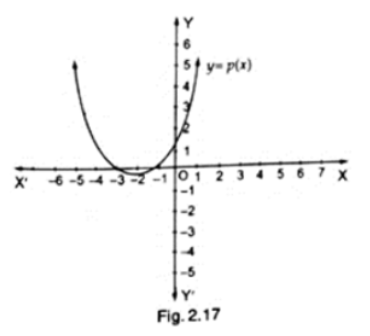
Step 3: Analyze the third graph (y = p(x))
- Observation: The third graph does not resemble a standard polynomial graph (it may be a curve or a different shape).
- Conclusion: This graph does not correspond to either a linear or a quadratic polynomial.
Step 4: Analyze the fourth graph (y = q(x))
- Observation: The fourth graph is a parabola that opens downwards.
- Conclusion: Similar to the first graph, this is also a quadratic polynomial, but with a negative coefficient for x2, indicating it opens downwards.
Summary of Results:
1. The first graph (y = f(x)) is a quadratic polynomial.
2. The second graph (y = g(x)) is a linear polynomial.
3. The third graph (y = p(x)) is neither.
4. The fourth graph (y = q(x)) is a quadratic polynomial.
- Observation: The first graph is a parabola that opens upwards.
- Conclusion: Since it has a U-shape, it indicates that it is a quadratic polynomial. Quadratic polynomials can be expressed in the form ax2+bx+c where a is positive.
- Observation: The second graph is a straight line.
- Conclusion: A straight line indicates that this is a linear polynomial. Linear polynomials can be expressed in the form mx+b where m is the slope.
- Observation: The third graph does not resemble a standard polynomial graph (it may be a curve or a different shape).
- Conclusion: This graph does not correspond to either a linear or a quadratic polynomial.
- Observation: The fourth graph is a parabola that opens downwards.
- Conclusion: Similar to the first graph, this is also a quadratic polynomial, but with a negative coefficient for x2, indicating it opens downwards.
1. The first graph (y = f(x)) is a quadratic polynomial.
2. The second graph (y = g(x)) is a linear polynomial.
3. The third graph (y = p(x)) is neither.
4. The fourth graph (y = q(x)) is a quadratic polynomial.
Topper's Solved these Questions
Similar Questions
Which of the following is not the graph of a quadratic polynomial?
View Solutionwhich one of the following is a polynomial ?
View SolutionDraw the graph of the polynomial f(x)=x3 .
View SolutionDraw the graph of the polynomial f(x)=x3−4x .
View SolutionWhich one of the following graphs represent a function? (FIGURE)
View SolutionDraw the graph of the polynomial f(x)=x2−2x−8
View SolutionGive one example in each of the following
Quadratic polynomial
View SolutionIn Fig. 2.17, the graph of a polynomial p(x) is given. Find the zeros of the polynomial. (FIGURE)

View SolutionWhich one of the following graphs represent a one-one function? (FIGURE)
View SolutionDraw the graph of the polynomial f(x)=x2−6x+9.
View Solution
