Number of persons in various age groups in a town is given in the following table:
Which two age groups have same population ?Solution in Punjabi
Step by step video & image solution for Number of persons in various age groups in a town is given in the following table:Which two age groups have same population ? by Maths experts to help you in doubts & scoring excellent marks in Class 6 exams.
Topper's Solved these Questions
Similar Questions
The following data is of the ages(in years) of 20 students of class VI.Arrange the data in a table using tally marks.
How many students are 10 years of age?04:45View SolutionFrom a basket of mangoes when counted in twos there was one extra, when counted in threes there were two extra, when counted in fours there were three extra, when counted in fives there were four extra, when counted in sixes there were five extra . But when counted in sevens there no extra.Ateast how many mangoes were thee in the basket?
03:05View SolutionWrite the following numbers in the place value tables:
20.502:16View SolutionNumber of persons in various age groups in a town is given in the following tableDraw a bar graph to represent the above information and answer the following questions. (take 1 unit length = 20 thousands)(a) Which two age groups have same population?(b) All persons in the age group of 60 and above are called senior citizens. How many senior citizens are there in the town?
03:41View SolutionThe age groups in a population are classified by
01:27View SolutionA group of individuals of the same age within a population is called :
View SolutionThe following table shows the number of illitrate persons in the age group (10-58 Years) in a town. Represents the given data by means of a histogram.
 07:59View Solution
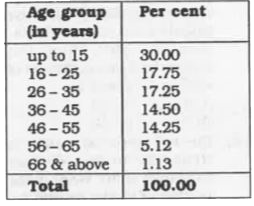
A table showing the percentage of the total population of a State by age groups for the year 1991 is given below. Answer the questions given below it.

Which age group accounts for the maximum population in the State ?View SolutionThe age composition of population refers to the number of people in same age groups.
04:54View SolutionNumber of persons in various age groups in a town is given in the following tableDraw a bar graph to represent the above information and answer the following questions. (take 1 unit length = 20 thousands)(a) Which two age groups have same population?(b) All persons in the age group of 60 and above are called senior citizens. How many senior citizens are there in the town?
06:09View Solution___ means the number of people in different age groups in a given population.
07:18View SolutionStudy the bar graph representing the number of persons in various age groups in a town shown in Figure. Observe the bar graph and answer the following questions: What is the percentage of the youngest age-group persons over those in the oldest age group? What is the total population of the town? What is the number of persons in the age-group 60-65? How many persons are more in the age-group 10-15 then in the age group 30-35? What is the age-group of exactly 1200 persons living in the town? What is the total number of persons living in the town in the age-group 50-55? What is the total number of persons living in the town in the age-groups 10-15 and 60-65? Whether the population in general increases, decreases or remains constant with the increase in the age-group.
03:00View SolutionStudy the bar graph representing the number of persons in various age groups in a town shown in Figure. Observe the bar graph and answer the following questions:
(i)What is the percentage of the youngest age-group persons over those in the oldest age group?
(ii)What is the total population of the town?
(iii)What is the number of persons in the age group 60-65?
(iv)What is the age-group of exactly 1200 persons living in the town?
(v)What is the total number of persons living in the town in the age group 50-55?
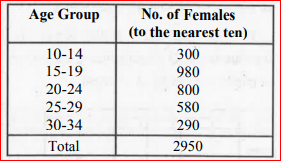
(vi)What is the total number of persons living in the town in the age group 10-15 and 60-65?08:07View SolutionThe following table presents the number of literate females in the age group (10-34) in town.
 Draw a histogram to represent the above data01:41View Solution
Number of age groups in a population is :
01:10View Solution

