An insurance company selected 2000 drivers at random in a particular city to find a relationship between age and accidents. The obtained are given in the following table: Age of Drivers (in years) Accidents in one year 0 1 2 3 over 3 18-29 30-50 above 50 440 505 360 160 125 45 110 60 35 61 22 15 35 18 9 Find the probability of the following events for a driver chosen at random from the life city: i) being 18-29 years of age and having exactly 3 accidents in one year. ii) being 30-50 years of age and having one or more accidents in a year. iii) having no accidents in one year.
To solve the problem, we will calculate the probabilities for each of the events described in the question step by step.
Given Data
We have the following table of drivers and accidents:
| Age of Drivers (in years) | Accidents in one year | Total Drivers |
|---------------------------|-----------------------|---------------|
| 18-29 | 0 | 440 |
| | 1 | 160 |
| | 2 | 110 |
| | 3 | 61 |
| | over 3 | 35 |
| 30-50 | 0 | 505 |
| | 1 | 125 |
| | 2 | 60 |
| | 3 | 22 |
| | over 3 | 18 |
| above 50 | 0 | 360 |
| | 1 | 45 |
| | 2 | 35 |
| | 3 | 15 |
| | over 3 | 9 |
| Total | | 2000 |
Step 1: Calculate the probability of being 18-29 years of age and having exactly 3 accidents in one year.
1. Identify the favorable cases:
- For drivers aged 18-29 with exactly 3 accidents, the number of drivers is 61.
2. Total number of drivers:
- The total number of drivers is 2000.
3. Calculate the probability:
P(18-29 years and 3 accidents)=Favorable casesTotal cases=612000
P(18-29 years and 3 accidents)=0.0305
Step 2: Calculate the probability of being 30-50 years of age and having one or more accidents in a year.
1. Identify the favorable cases:
- For drivers aged 30-50 with one or more accidents, we sum the number of drivers with 1, 2, 3, and over 3 accidents:
125+60+22+18=225
2. Total number of drivers:
- The total number of drivers is 2000.
3. Calculate the probability:
P(30-50 years and 1 or more accidents)=2252000
P(30-50 years and 1 or more accidents)=0.1125
Step 3: Calculate the probability of having no accidents in one year.
1. Identify the favorable cases:
- For all age groups, we sum the number of drivers with 0 accidents:
440+505+360=1305
2. Total number of drivers:
- The total number of drivers is 2000.
3. Calculate the probability:
P(No accidents)=13052000
P(No accidents)=0.6525
Final Answers
1. Probability of being 18-29 years of age and having exactly 3 accidents: 0.0305
2. Probability of being 30-50 years of age and having one or more accidents: 0.1125
3. Probability of having no accidents in one year: 0.6525
We have the following table of drivers and accidents:
|---------------------------|-----------------------|---------------|
| 18-29 | 0 | 440 |
| | 1 | 160 |
| | 2 | 110 |
| | 3 | 61 |
| | over 3 | 35 |
| 30-50 | 0 | 505 |
| | 1 | 125 |
| | 2 | 60 |
| | 3 | 22 |
| | over 3 | 18 |
| above 50 | 0 | 360 |
| | 1 | 45 |
| | 2 | 35 |
| | 3 | 15 |
| | over 3 | 9 |
| Total | | 2000 |
- For drivers aged 18-29 with exactly 3 accidents, the number of drivers is 61.
- The total number of drivers is 2000.
P(18-29 years and 3 accidents)=Favorable casesTotal cases=612000
P(18-29 years and 3 accidents)=0.0305
- For drivers aged 30-50 with one or more accidents, we sum the number of drivers with 1, 2, 3, and over 3 accidents:
125+60+22+18=225
- The total number of drivers is 2000.
P(30-50 years and 1 or more accidents)=2252000
P(30-50 years and 1 or more accidents)=0.1125
- For all age groups, we sum the number of drivers with 0 accidents:
440+505+360=1305
- The total number of drivers is 2000.
P(No accidents)=13052000
P(No accidents)=0.6525
1. Probability of being 18-29 years of age and having exactly 3 accidents: 0.0305
2. Probability of being 30-50 years of age and having one or more accidents: 0.1125
3. Probability of having no accidents in one year: 0.6525
Topper's Solved these Questions
Similar Questions
An insurance company selected 2000 drivers at random (i.e., without any preference of one driver over another) in a particular city to find a relationship between age and accidents. The data obtained are given in the following table:A g e\ o
View SolutionAn insurance company selected 2000 drivers at random (i.e., without any preference of one driver over another) in a particular city to find a relationship between age and accidents. The data obtained are given in the following table: Find the probabilities of the following events for a driver chosen at random from the city: (i) The driver being in the age group 18−29 years and having exactly 3 accidents in one year. (ii) The driver being in the age group of 30−50 year and having one or more accidents in a year. (iii) The number of drivers having no accidents in one year
View Solution
Knowledge Check

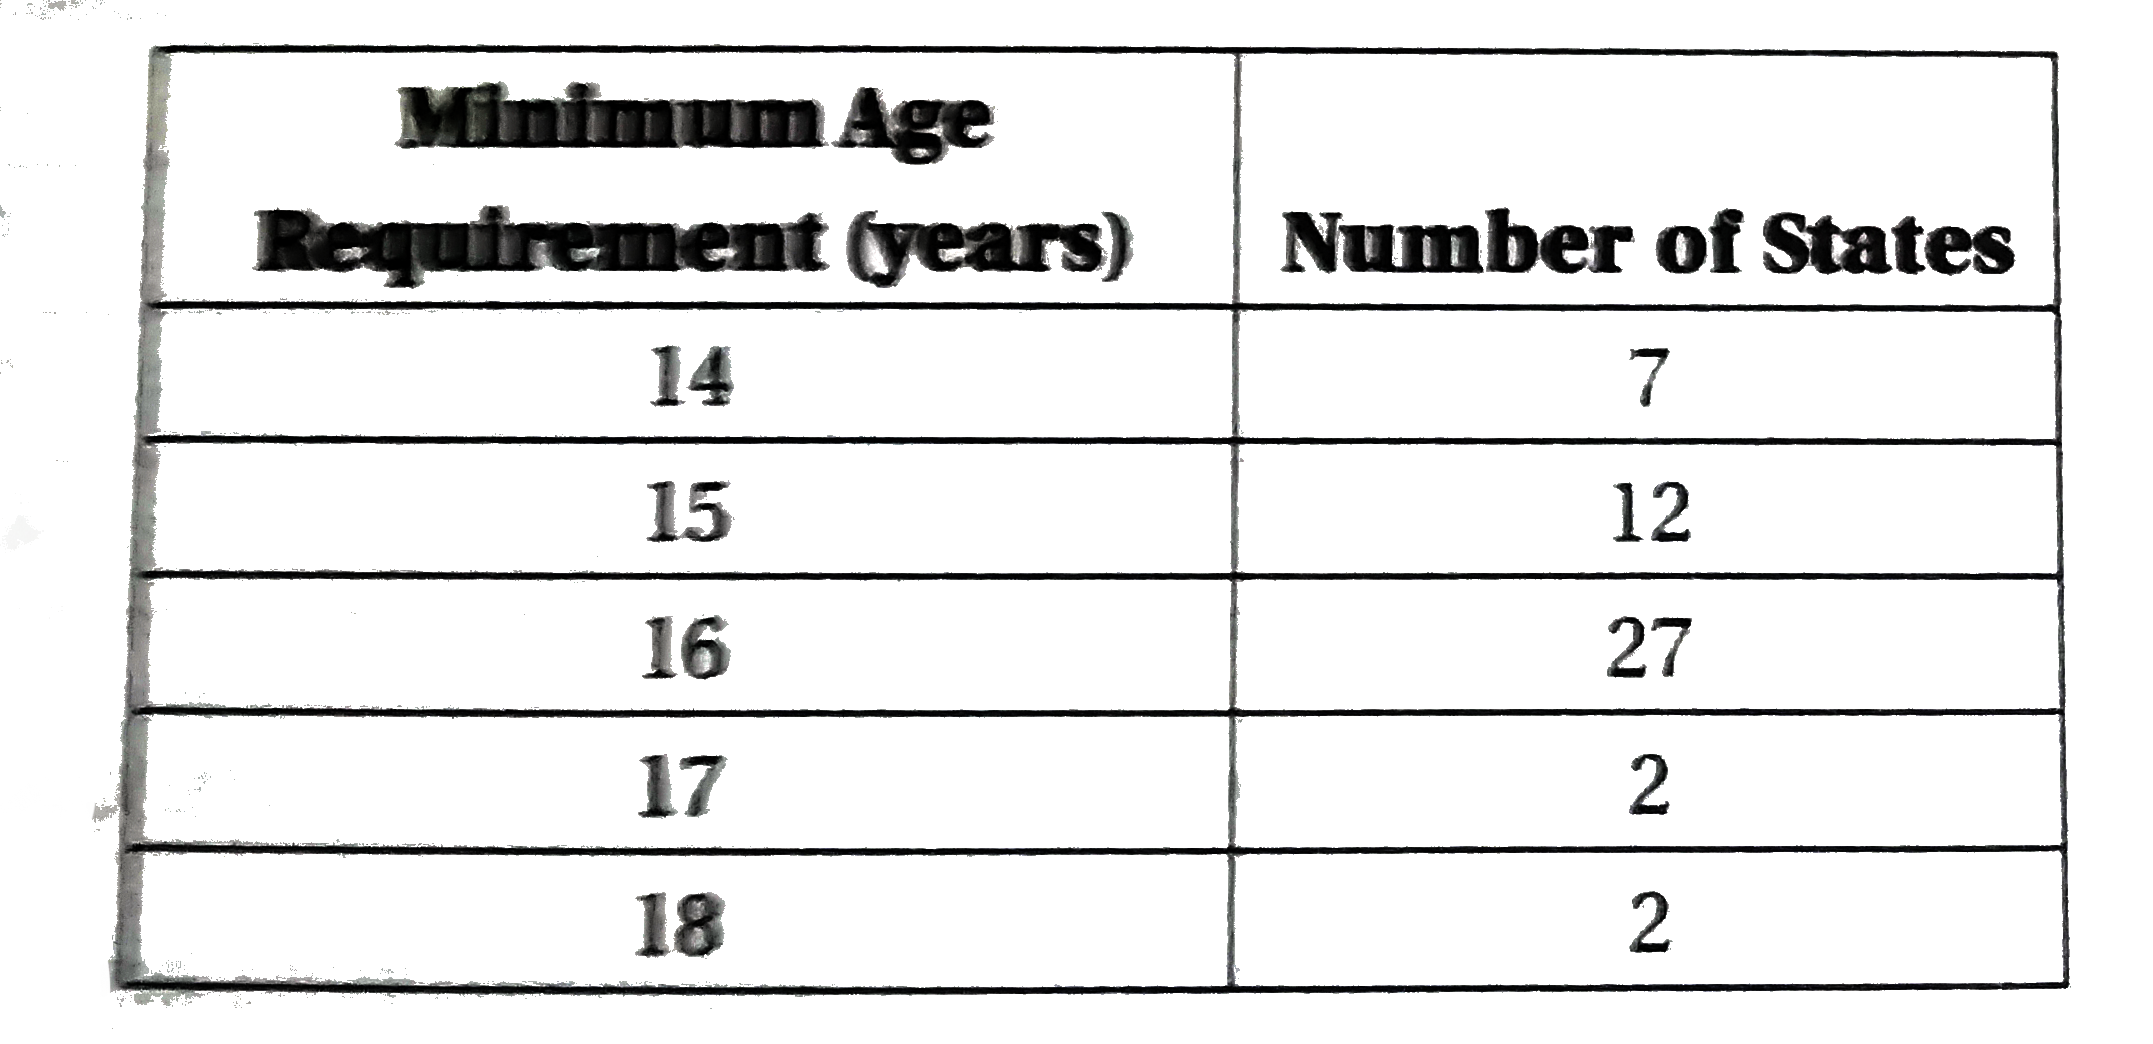
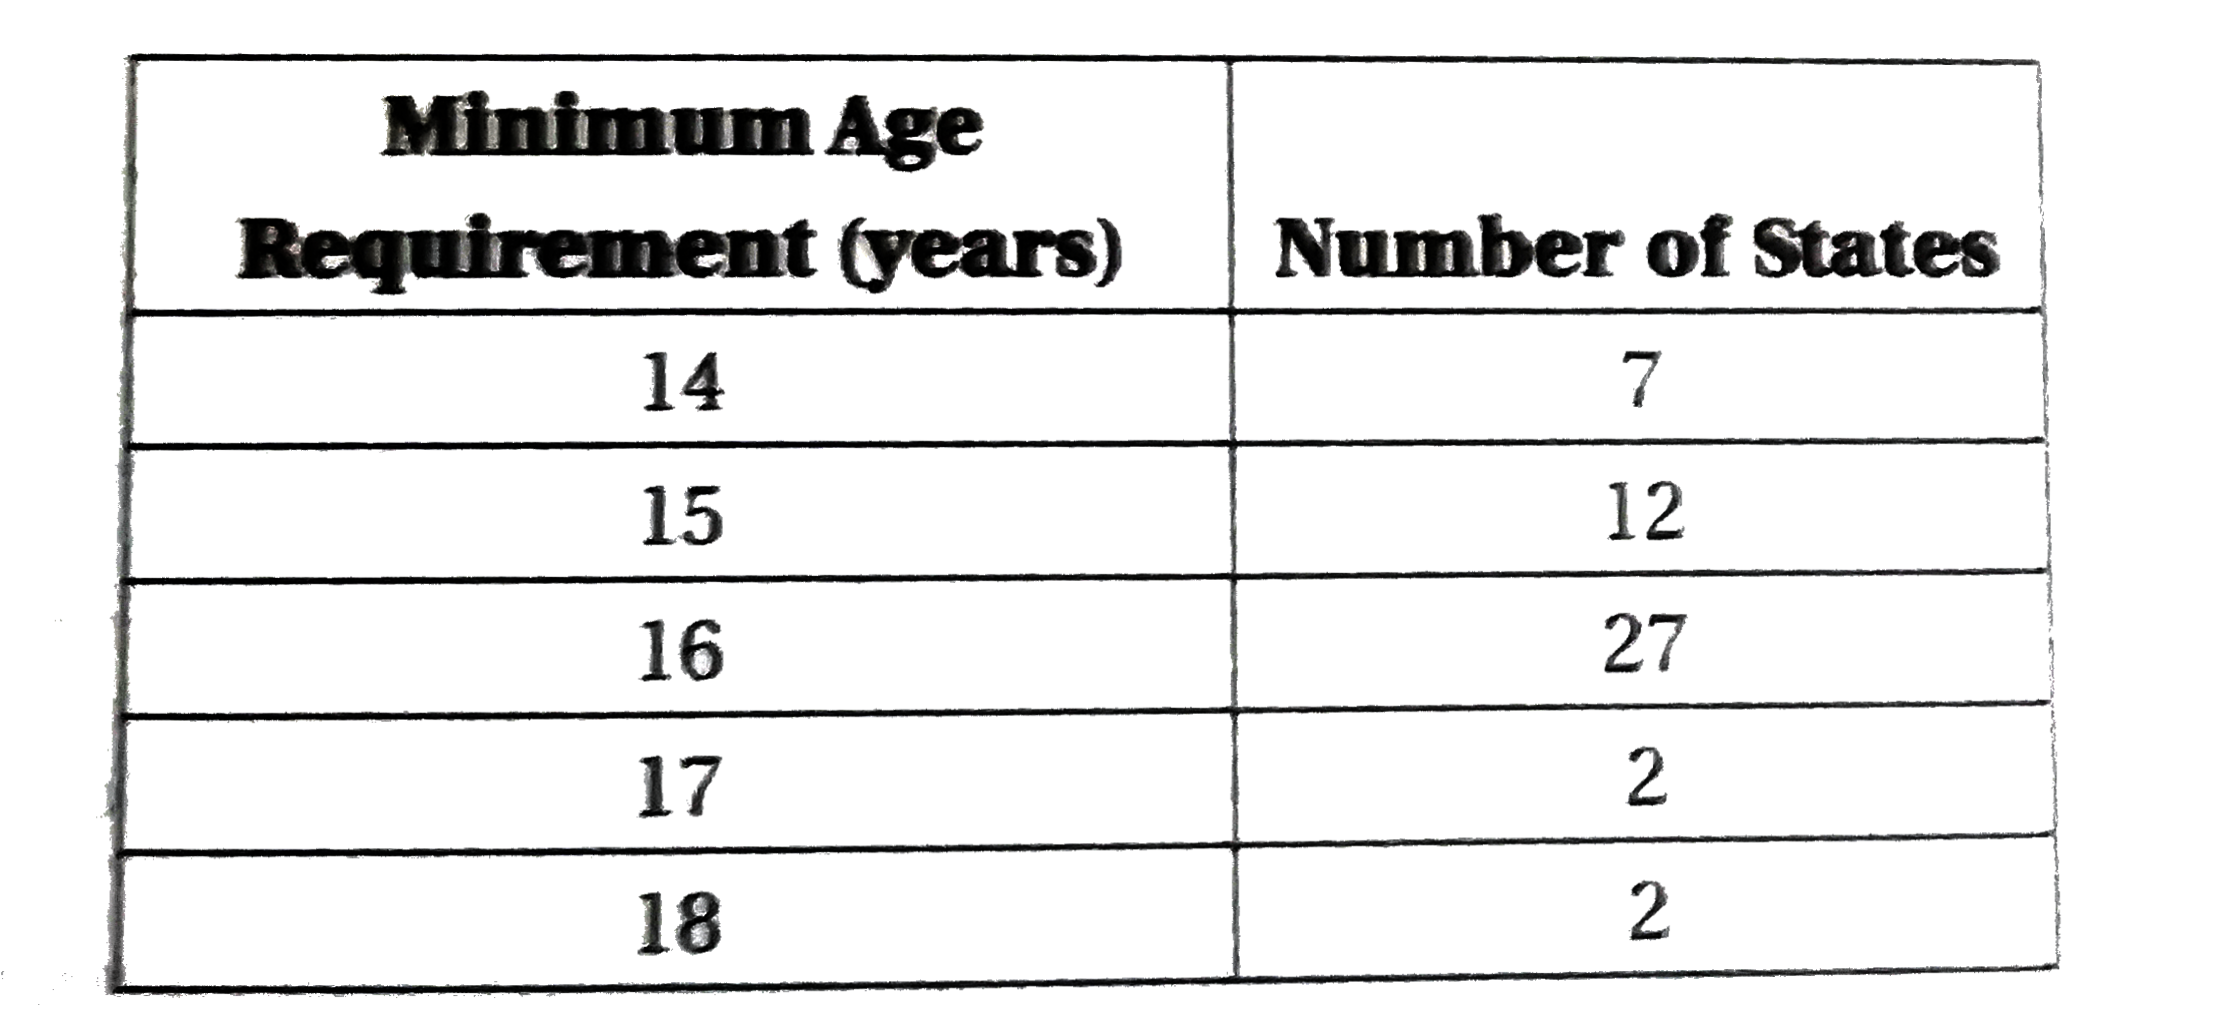
Q. The table shows the minimum age requirement for obtaining a driver's license. In what percent of the states can a person obtain a driver's license before the age of 16?A94%B47%C38%D19%
Q. If a state is chosen at random, what is the probability that the minimum age for obtaining a driver's license in that state will be at least 16?A125B225C1950D3150
The probability that an year chosen at random has 53 Sundays is :
View SolutionNumber of accidents on a national highway each day is a poisson variable with an average of three accidents per a day. Find the probability that no accidents will occur on a given day.
View SolutionFind the probability that the leap year selected at random will contain of exactly 52 Wednesdays.
View SolutionThe ages of 40 students are given in the following table: Age(in yrs) 12 13 14 15 16 17 18 Frequency 2 4 6 9 8 7 4 Find the arithmetic mean.
View SolutionA marble is chosen at random from marbles numbered 10 to 22. Find the probability of selecting a marble having number 15 and 20 on it.
View SolutionAn insurance company insured 2000 scooter drivers, 4000 car drivers and 6000 truck drivers. The probability of an accidents are 0.01, 0.03 and 0.15 respectively. One of the insured persons meets with an accident. What is the probability that he i
View Solution
