In the month of July 2004, a house holder spent his monthly salary amounting to Rs.7200 on different items as given below: Items, Clothing, Food, House Rent, Education, Misc. Amount spent (in Rs.):600,4000,1200,400,1000 Represent the information in the form of a pie-chart.
To represent the monthly spending of a householder in July 2004 in the form of a pie chart, we will follow these steps:
Step 1: Identify the total amount spent and the amounts for each category.
- Total Salary = Rs. 7200
- Amounts spent on different items:
- Clothing: Rs. 600
- Food: Rs. 4000
- House Rent: Rs. 1200
- Education: Rs. 400
- Miscellaneous: Rs. 1000
Step 2: Calculate the angle for each category using the formula:
Angle=(AmountTotal Amount)×360∘
Step 3: Calculate the angle for Clothing.
- Amount spent on Clothing = Rs. 600
- Angle for Clothing:
Angle=(6007200)×360=(112)×360=30∘
Step 4: Calculate the angle for Food.
- Amount spent on Food = Rs. 4000
- Angle for Food:
Angle=(40007200)×360=(59)×360=200∘
Step 5: Calculate the angle for House Rent.
- Amount spent on House Rent = Rs. 1200
- Angle for House Rent:
Angle=(12007200)×360=(16)×360=60∘
Step 6: Calculate the angle for Education.
- Amount spent on Education = Rs. 400
- Angle for Education:
Angle=(4007200)×360=(118)×360=20∘
Step 7: Calculate the angle for Miscellaneous.
- Amount spent on Miscellaneous = Rs. 1000
- Angle for Miscellaneous:
Angle=(10007200)×360=(536)×360=50∘
Step 8: Summarize the angles for each category.
- Clothing: 30°
- Food: 200°
- House Rent: 60°
- Education: 20°
- Miscellaneous: 50°
Step 9: Draw the pie chart.
1. Draw a circle.
2. Use a protractor to measure and draw the angles for each category starting from a point on the circle.
- Draw 200° for Food.
- Draw 30° for Clothing.
- Draw 60° for House Rent.
- Draw 20° for Education.
- Draw 50° for Miscellaneous.
Step 10: Label each section of the pie chart with the respective category.
- Total Salary = Rs. 7200
- Amounts spent on different items:
- Clothing: Rs. 600
- Food: Rs. 4000
- House Rent: Rs. 1200
- Education: Rs. 400
- Miscellaneous: Rs. 1000
Angle=(AmountTotal Amount)×360∘
- Amount spent on Clothing = Rs. 600
- Angle for Clothing:
Angle=(6007200)×360=(112)×360=30∘
- Amount spent on Food = Rs. 4000
- Angle for Food:
Angle=(40007200)×360=(59)×360=200∘
- Amount spent on House Rent = Rs. 1200
- Angle for House Rent:
Angle=(12007200)×360=(16)×360=60∘
- Amount spent on Education = Rs. 400
- Angle for Education:
Angle=(4007200)×360=(118)×360=20∘
- Amount spent on Miscellaneous = Rs. 1000
- Angle for Miscellaneous:
Angle=(10007200)×360=(536)×360=50∘
- Clothing: 30°
- Food: 200°
- House Rent: 60°
- Education: 20°
- Miscellaneous: 50°
1. Draw a circle.
2. Use a protractor to measure and draw the angles for each category starting from a point on the circle.
- Draw 200° for Food.
- Draw 30° for Clothing.
- Draw 60° for House Rent.
- Draw 20° for Education.
- Draw 50° for Miscellaneous.
Topper's Solved these Questions
Similar Questions
Draw a pie-diagram for the following data of expenditure pattern in a family: Items, Food, Clothing, Rent, Edu., Misc. Expenditure (in Rs.), 4000, 2000, 1500, 1500, 1000
View SolutionFollowing is the break up of the expenditure of a family on different items of consumption.: Items, Food, Clothing, Rent, Education, Fuel etc., Medicine, Misc. Expenditure (in Rs), 1600, 200, 600, 150, 100, 80, 270 Draw a pie-diagram to represent the above data.
View SolutionThe following data shows the expenditure of a person on different items during a month. Represent the data by a pie-chart. Items of expenditure, Rent, Education, Food, Clothing, Others Amount (in Rs.), 2700, 1800, 2400, 1500, 2400
View SolutionIn one day the sales (in rupees) of different items of a baker’s shop are given below: Items, Ordinary bread, Fruit bread, Cakes and Pastries, Biscuits, Other, Total Sales (in Rs.), 260, 40, 100, 60, 20, 480 Draw a pie-chart representing the above sales.
View SolutionThe following data gives the amount spent on the construction of a house. Draw a pie diagram. Items, Cement, Timber, Bricks, Labour, Steel, Misc. Expenditure (in thousand Rs), 60, 30, 45, 75, 45, 45
View SolutionItems of expenditure Expenditure Family A Family B Food 4000 6400 Clothing 2500 480 Rent 1500 3200 Education 400 1000 Miscellaneous 1600 600 Total 10000 11680
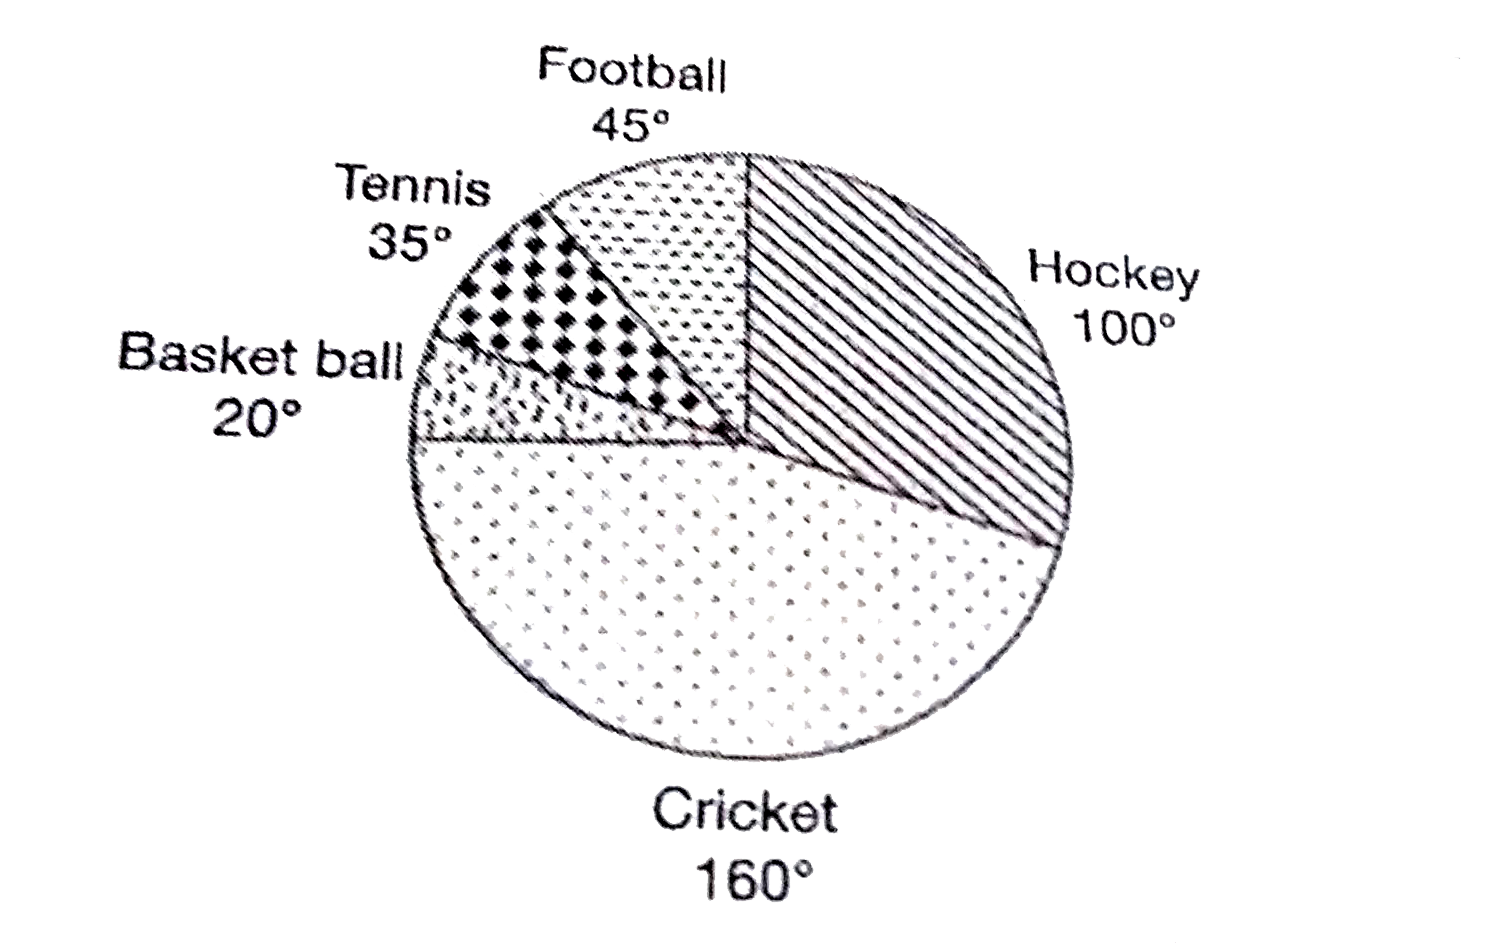
View SolutionThe pie chart (as shown in the figure) represents the amount spent on different sports by a sports club in a year. If the total money spent by the club on sports is Rs. 1,08,000, find the amount spent on each sport.
View SolutionThe following pie-chart represents the amount spent on different sports by a school administration in a calendar year.

If the money spent on football is Rs. 9000, answer the following questions:
(i) If the amount spent on football was Rs. 9000, then how much more money was spent on hockey than on football ?
(ii) If the amount spent on football Rs. 9000, then what was the total amount spent on all sports ?
View SolutionIn which of the following situations, do the lists of numbers involved form an AP? Give reasons for your answers.
(i) The fee charged from a student every month by a school for the whole session, when the monthly fee is Rs. 400.
(ii) The fee charged every month by a school from classes I to XII, When the monthly fee for class I is Rs. 250 and it increases by Rs. 50 for the next higher class.
(iii) The amount of money in the account of Varun at the end of every year when Rs. 1000 is deposited at simple interest of 10% per annum.
(iv) The number of bacteria in a certain food item after each second, when they double in every second.
View SolutionMr. Mirza's monthly income is रु 7,200 . He spends. रु 1,800 on rent रु 2,700 on food, रु 900 on education of his children रु 12,00 on other things and saves the rest. Draw a pie- chart to represent it.
View Solution
