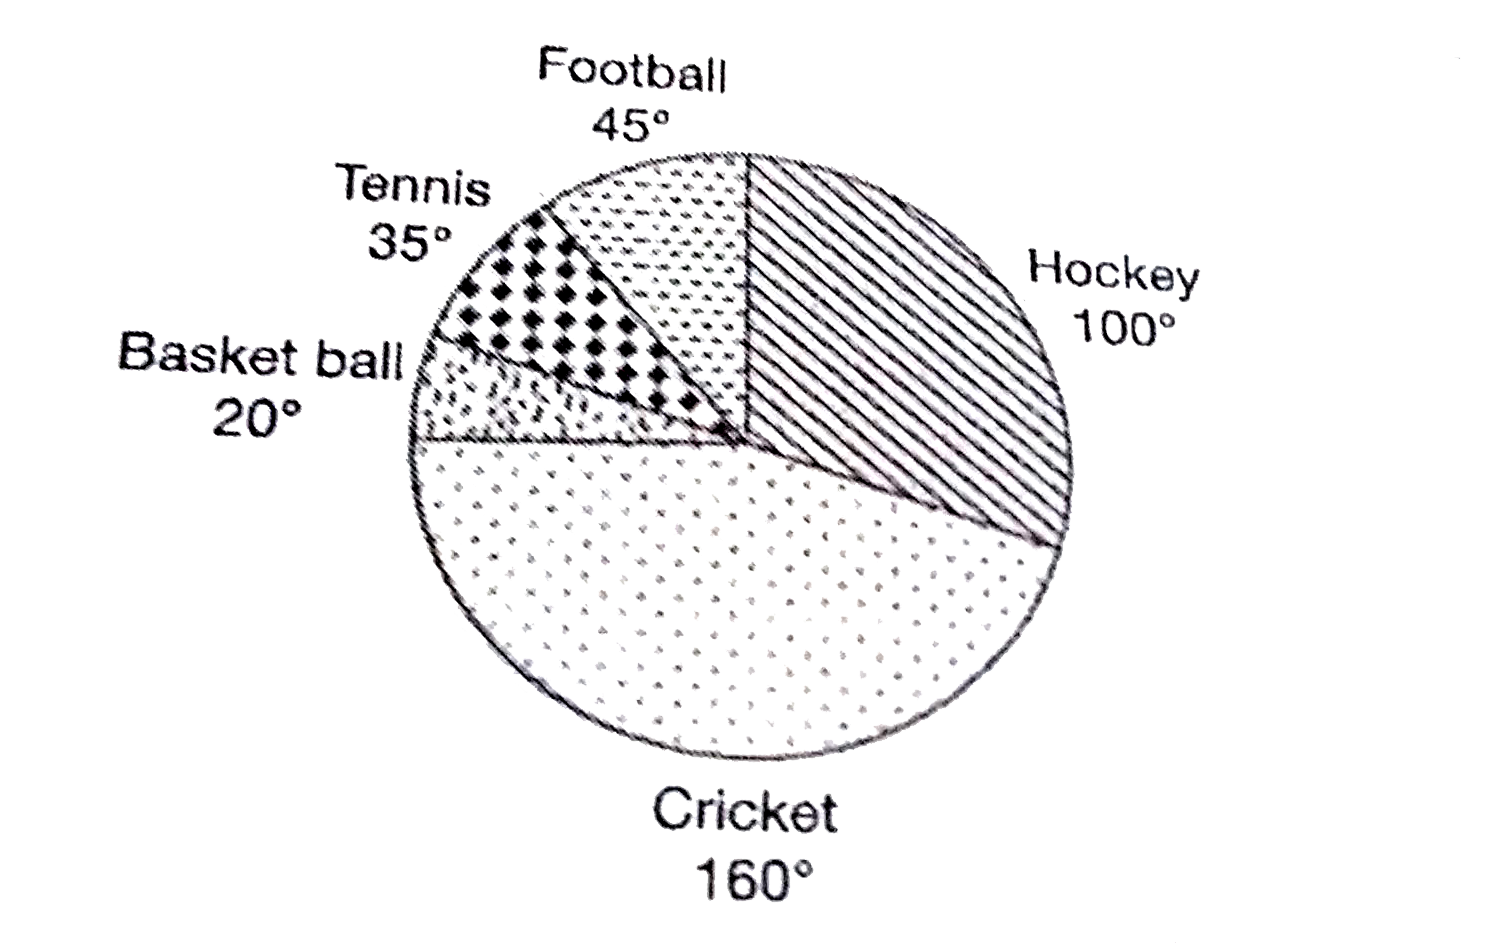
The pie chart (as shown in the figure) represents the amount spent on different sports by a sports club in a year. If the total money spent by the club on sports is Rs. 1,08,000, find the amount spent on each sport.
Step by step video & image solution for The pie chart (as shown in the figure) represents the amount spent on different sports by a sports club in a year. If the total money spent by the club on sports is Rs. 1,08,000, find the amount spent on each sport. by Maths experts to help you in doubts & scoring excellent marks in Class 8 exams.
Topper's Solved these Questions
Similar Questions
The following pie-chart represents the amount spent on different sports by a school administration in a calendar year.

If the money spent on football is Rs. 9000, answer the following questions:
(i) If the amount spent on football was Rs. 9000, then how much more money was spent on hockey than on football ?
(ii) If the amount spent on football Rs. 9000, then what was the total amount spent on all sports ?View SolutionThe pie-chart given in Figure represents the expenditure on different items in constructing a flat in Delhi. If the expenditure incurred on cement is Rs. 112500. Find the following Total cost of the flat Expenditure incurred on labour.
View Solution
Knowledge Check
- Question 1 - Select One
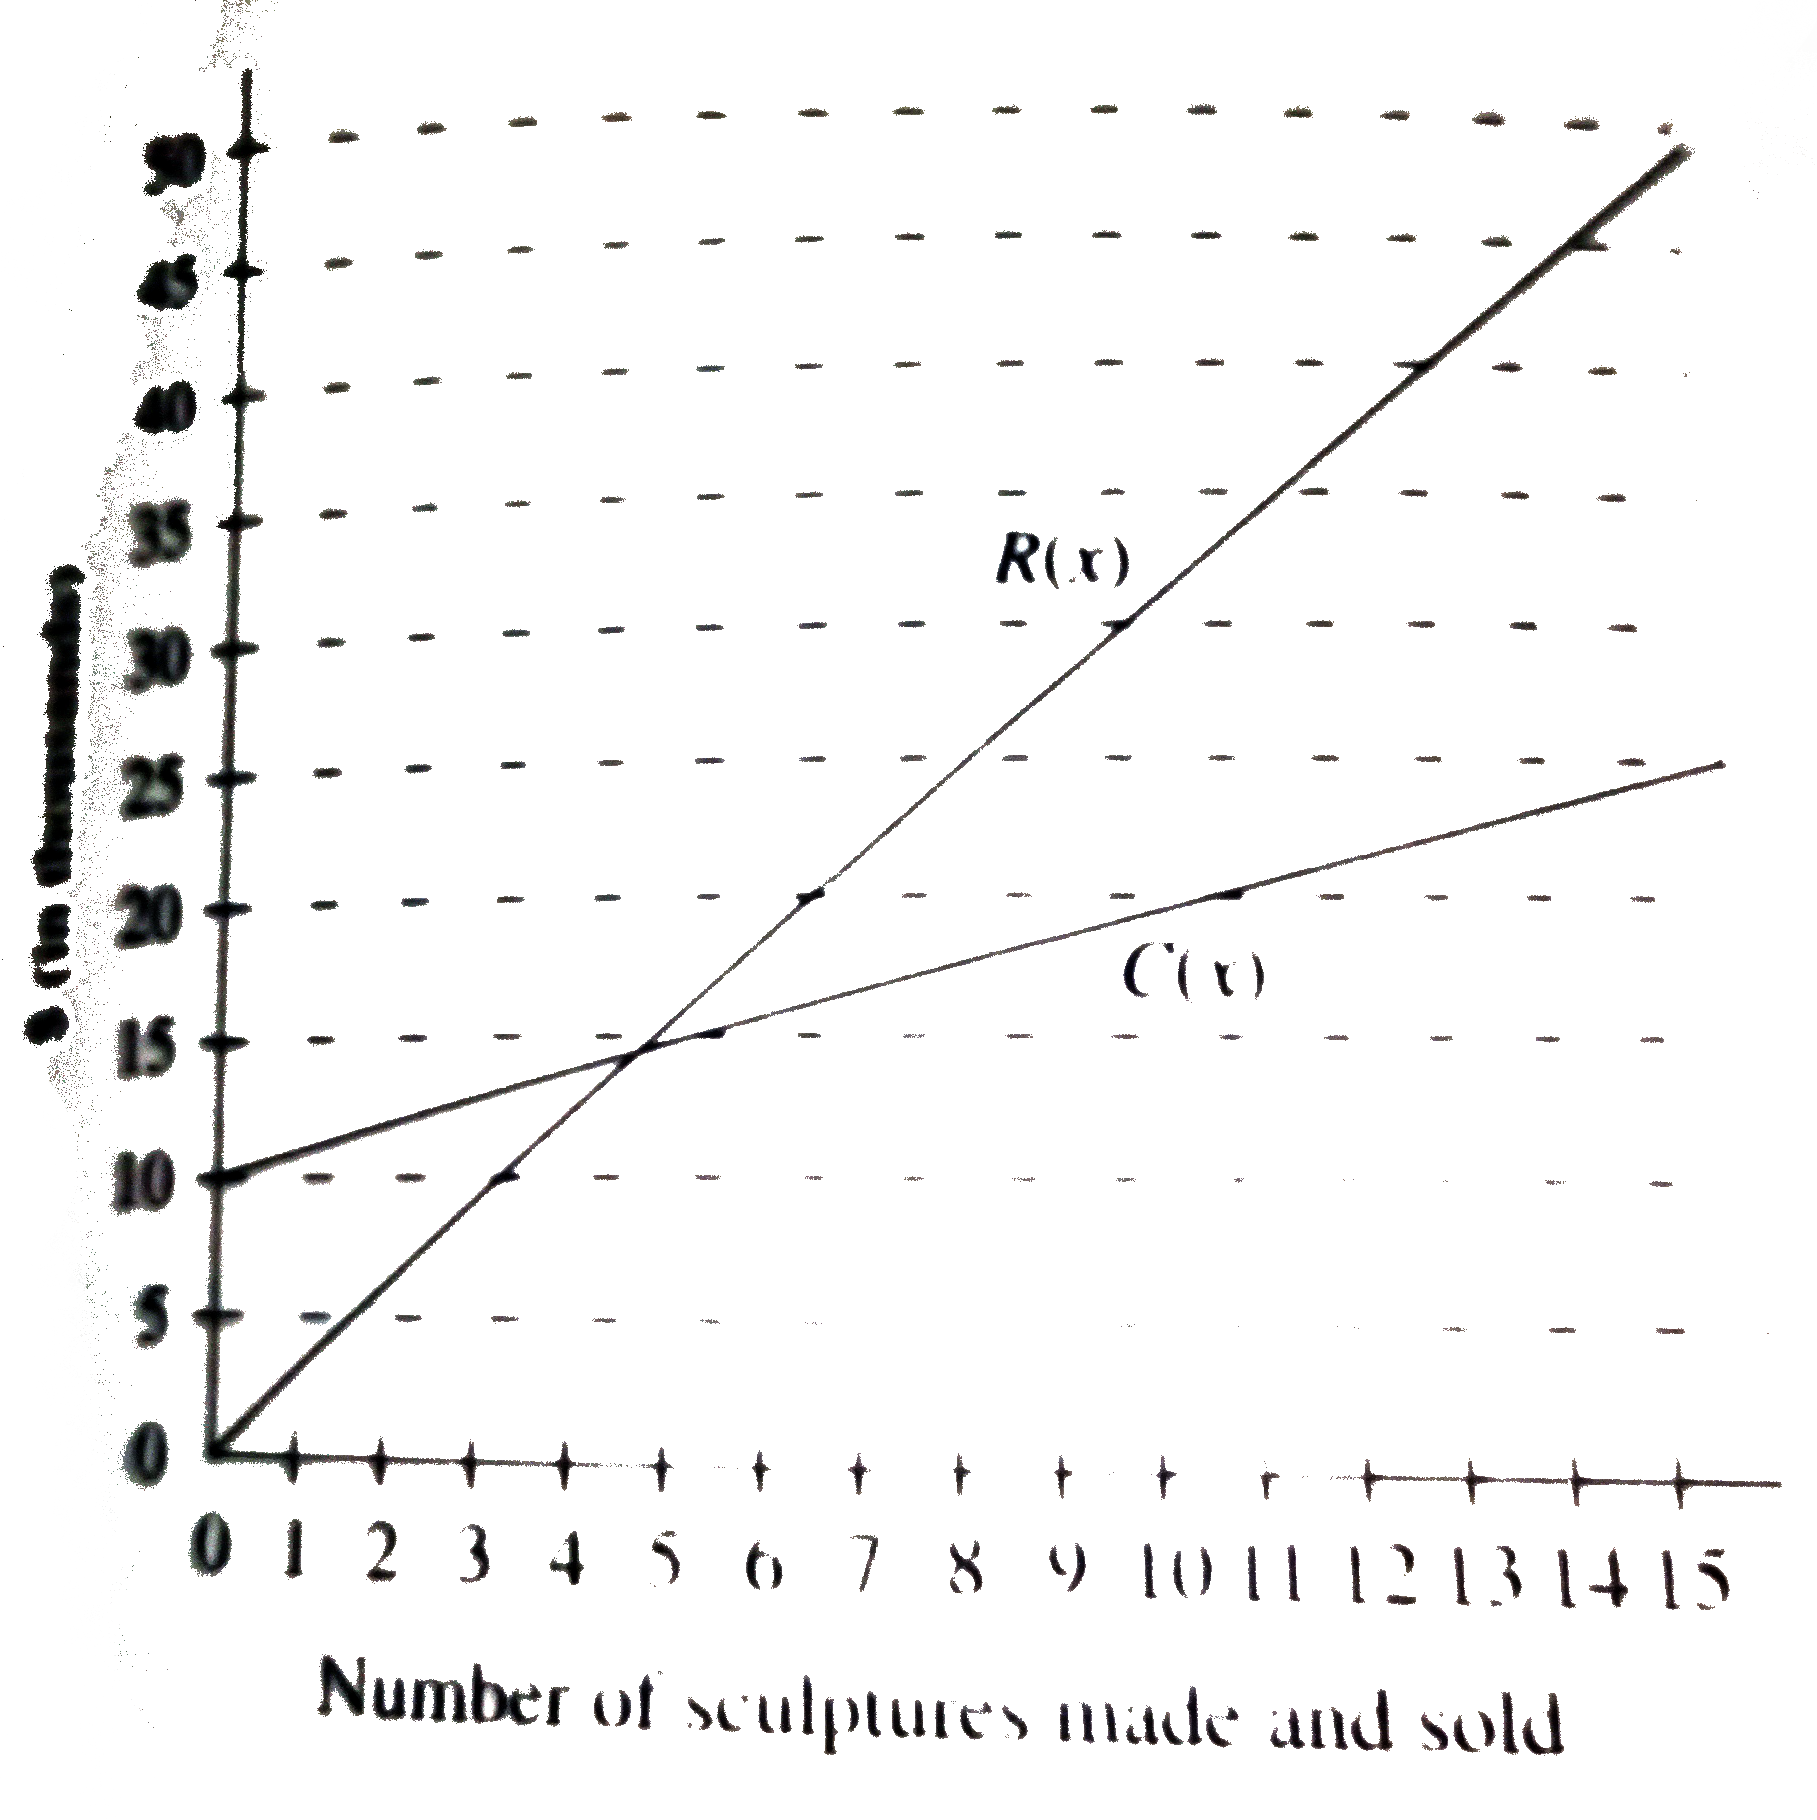
A poor , frustrated artist named Fresco created a plan to make money. He collected trash, repurposed it into sculptures, then asked various celebrities to write and paint on these trash objects, which he then sold on his own as modern high art. The chart below separately shows the cost and revenue of his plan. The linear cost function, C(x) , represents the total money spent to make and market the art , while the linear revenue function, R(x) , shows the amount of money he has made in sculpture sales.

Fresco initially spent money promoting the project in the media . He also had to pay the celebrities to participate . After 6 months , Fresco had created and sold x number of trash sculptures and finally broke even : he hadn't made or lost any money . How many sculptures did Fresco sell in his first 6 months of the project ?A3B5C7D10 - Question 2 - Select One
Rashid spend रु 95.75 for Maths books and रु 83.60 for Science book. Find the total amount spent by Rashid.
Aरु 179.35Bरु 179.39Cरु 199.35Dरु 189.35
The pie-chart shown in Figure represents the expenditures of a family on different items.If the total annual income of the family is Rs.75,000, Find the expenditure on children education and also find savings by reading the pie-chart.
View SolutionThe pie-chart given in Figure, represents the expenditure on different items in constructing a flat in a metro city.
(i)Find the percentage expenditure on different items by reading the pie-chart. (ii) If the cost of flat is Rs. 5,40,000, Find the following: (i)The expenditure incurred on steel and cement separately. (ii)Difference of expenditure incurred on timber and bricks.View SolutionRashid spent Rs 35.75 for Maths book and Rs 32.60 for Science book. Find the total amount spent by Rashid.
View SolutionRashid spent Rs 35.75 for Maths book and Rs 32.60 for Science book. Find the total amount spent by Rashid.
View SolutionJohn had Rs 60 with him. He spent 40% of the money he had on a sandwich and the rest on an ice cream. Find the amount he spent on each item.
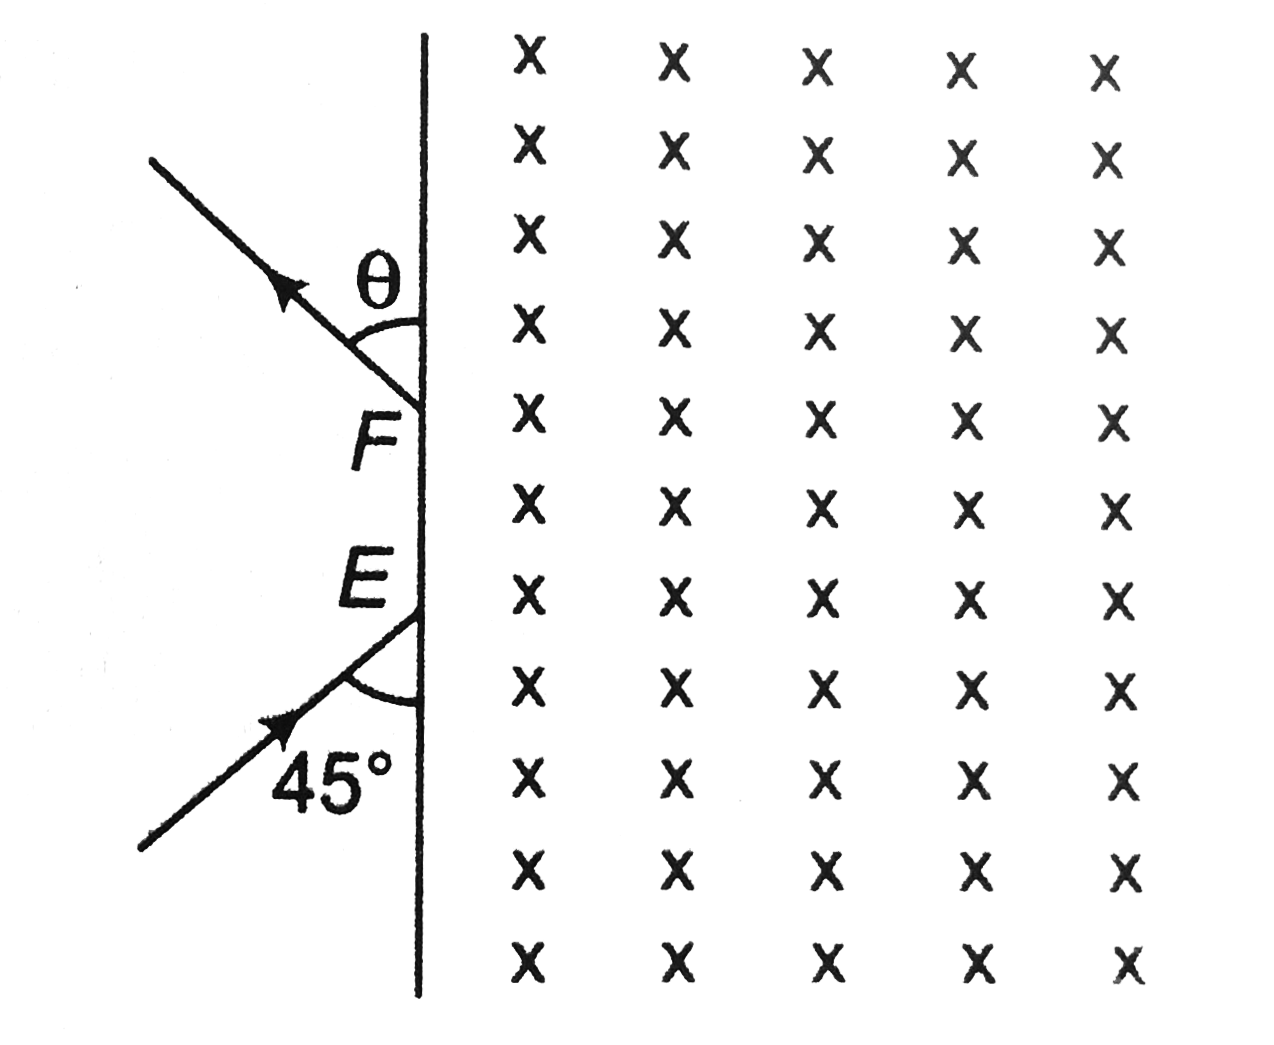
View SolutionA particle of mass m=1.6×10⁻²⁷ kg and charge q=1.6×10⁻¹⁹C enters a region of uniform magnetic field of stregth 1T along the direction shown in figure. The speed of the particle is 107m/s

a. The magnetic field is directed along the inward normal to the plane of the paper. The particle leaves the region of the fiedl at the point F. Find the distasnce EF and the angle theta.
b. If the direction of the field is along the outward normal to the plane of the paper find the time spent by the particle in the regin of the magnetic field after entering it at E.View Solution
