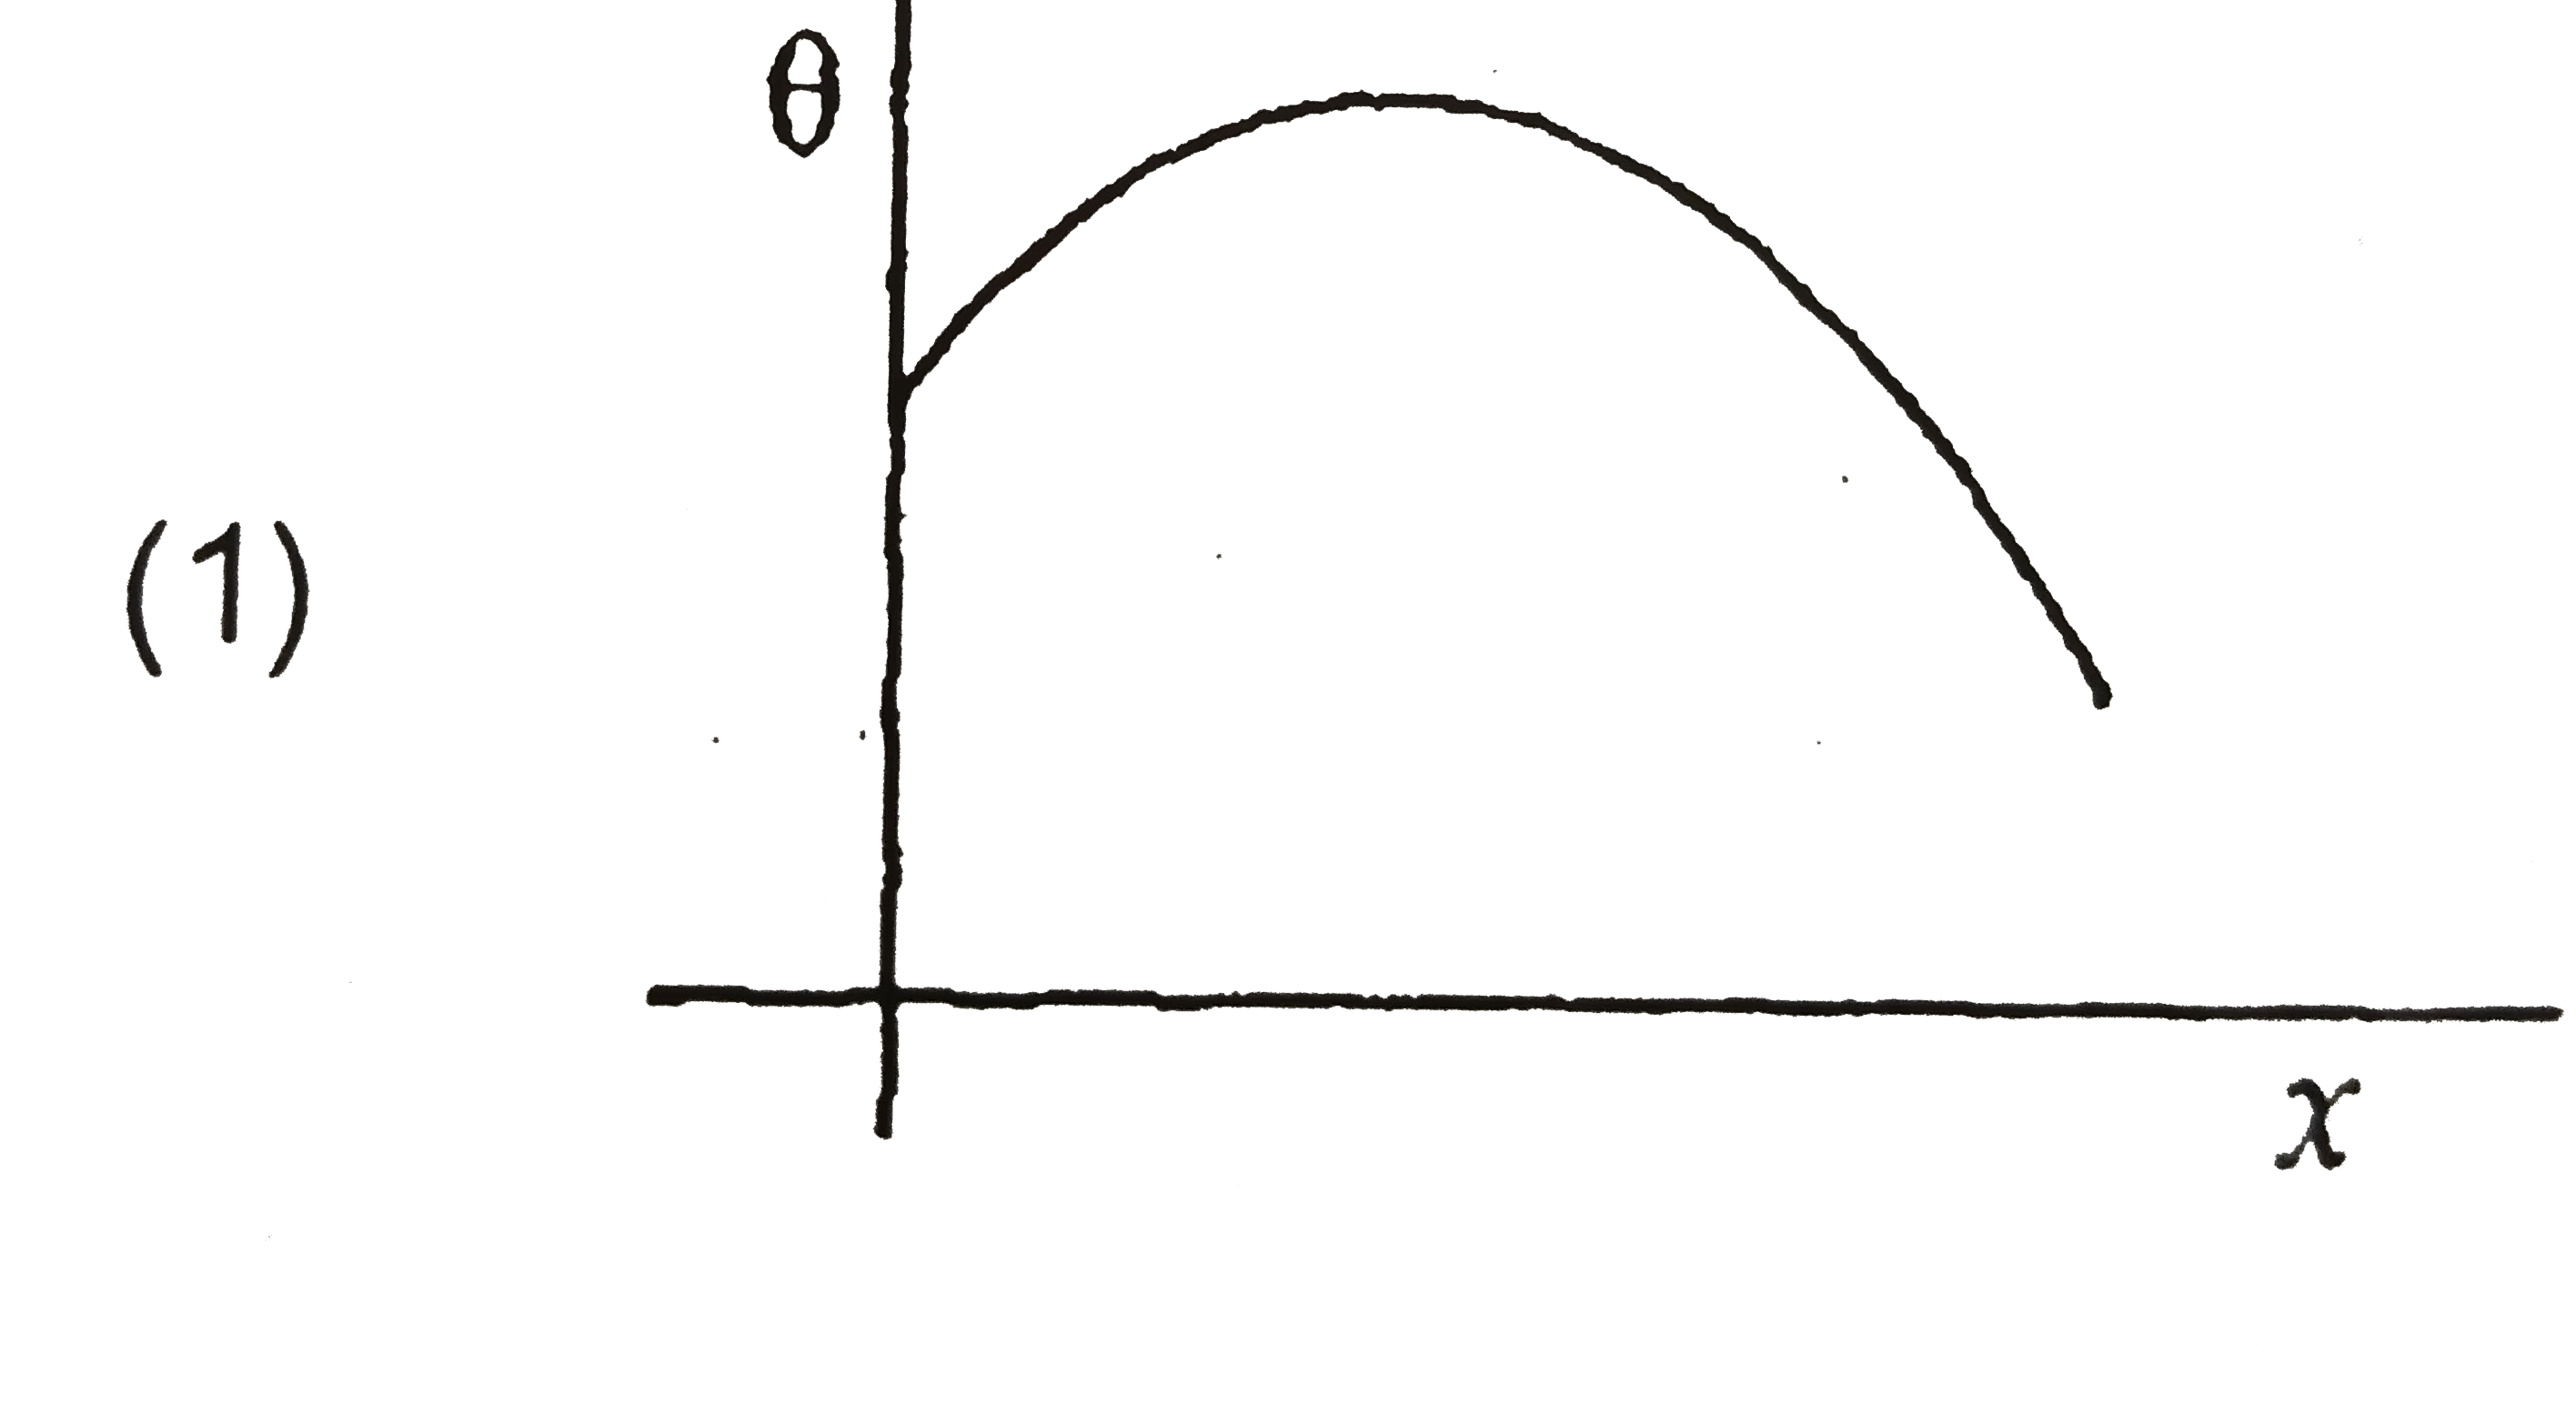
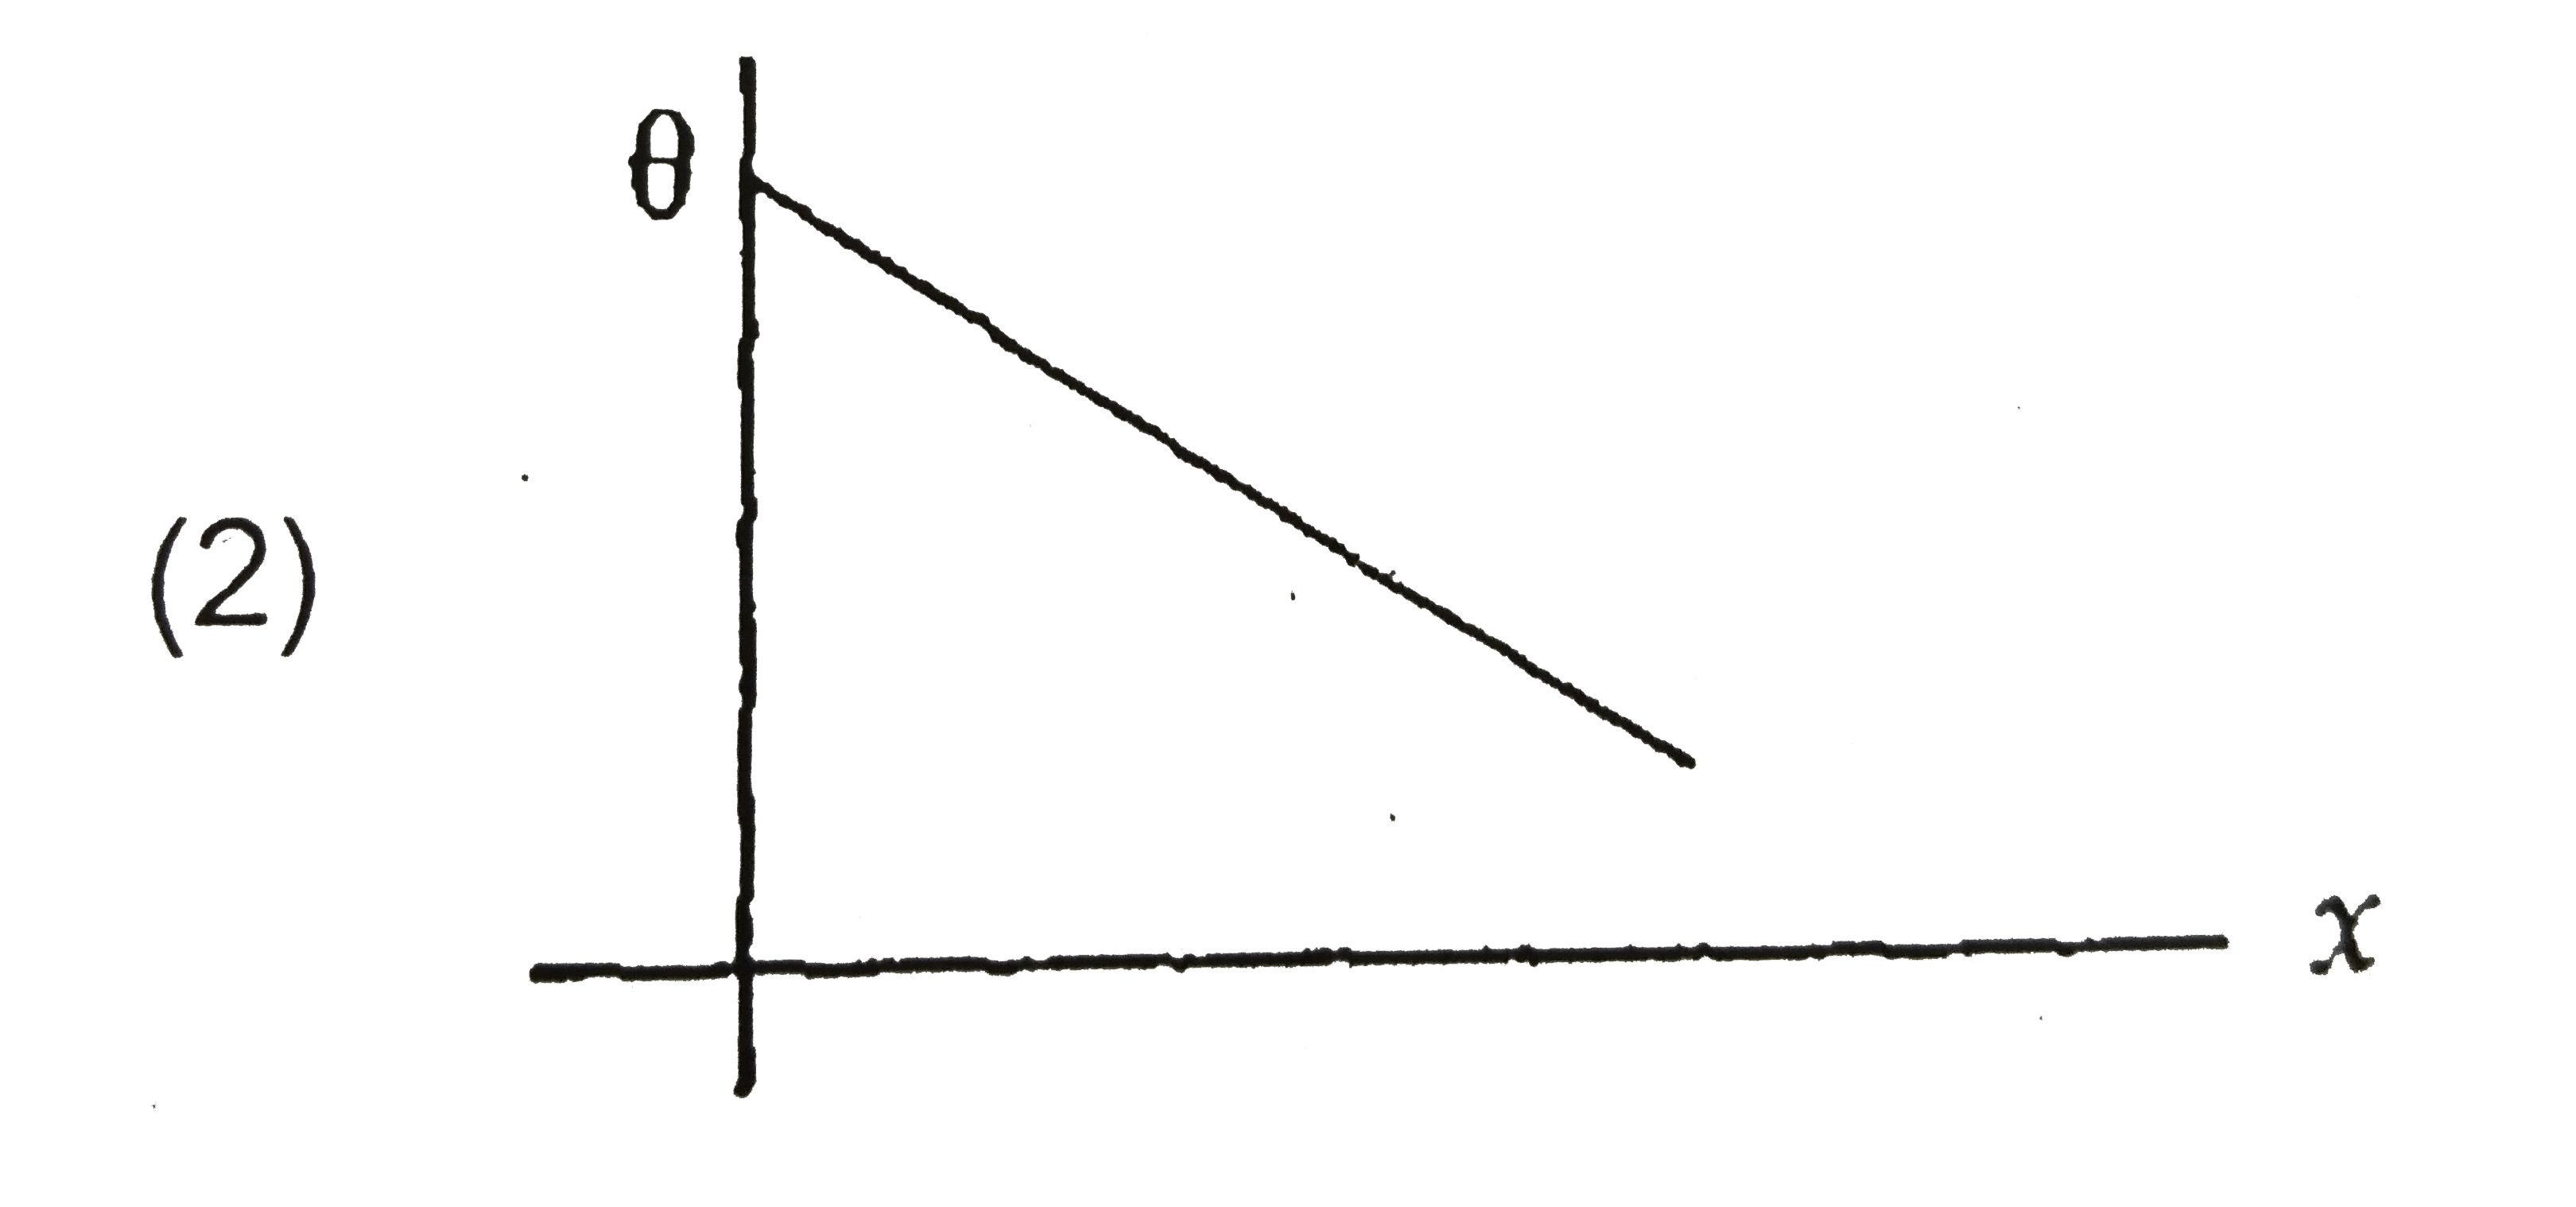
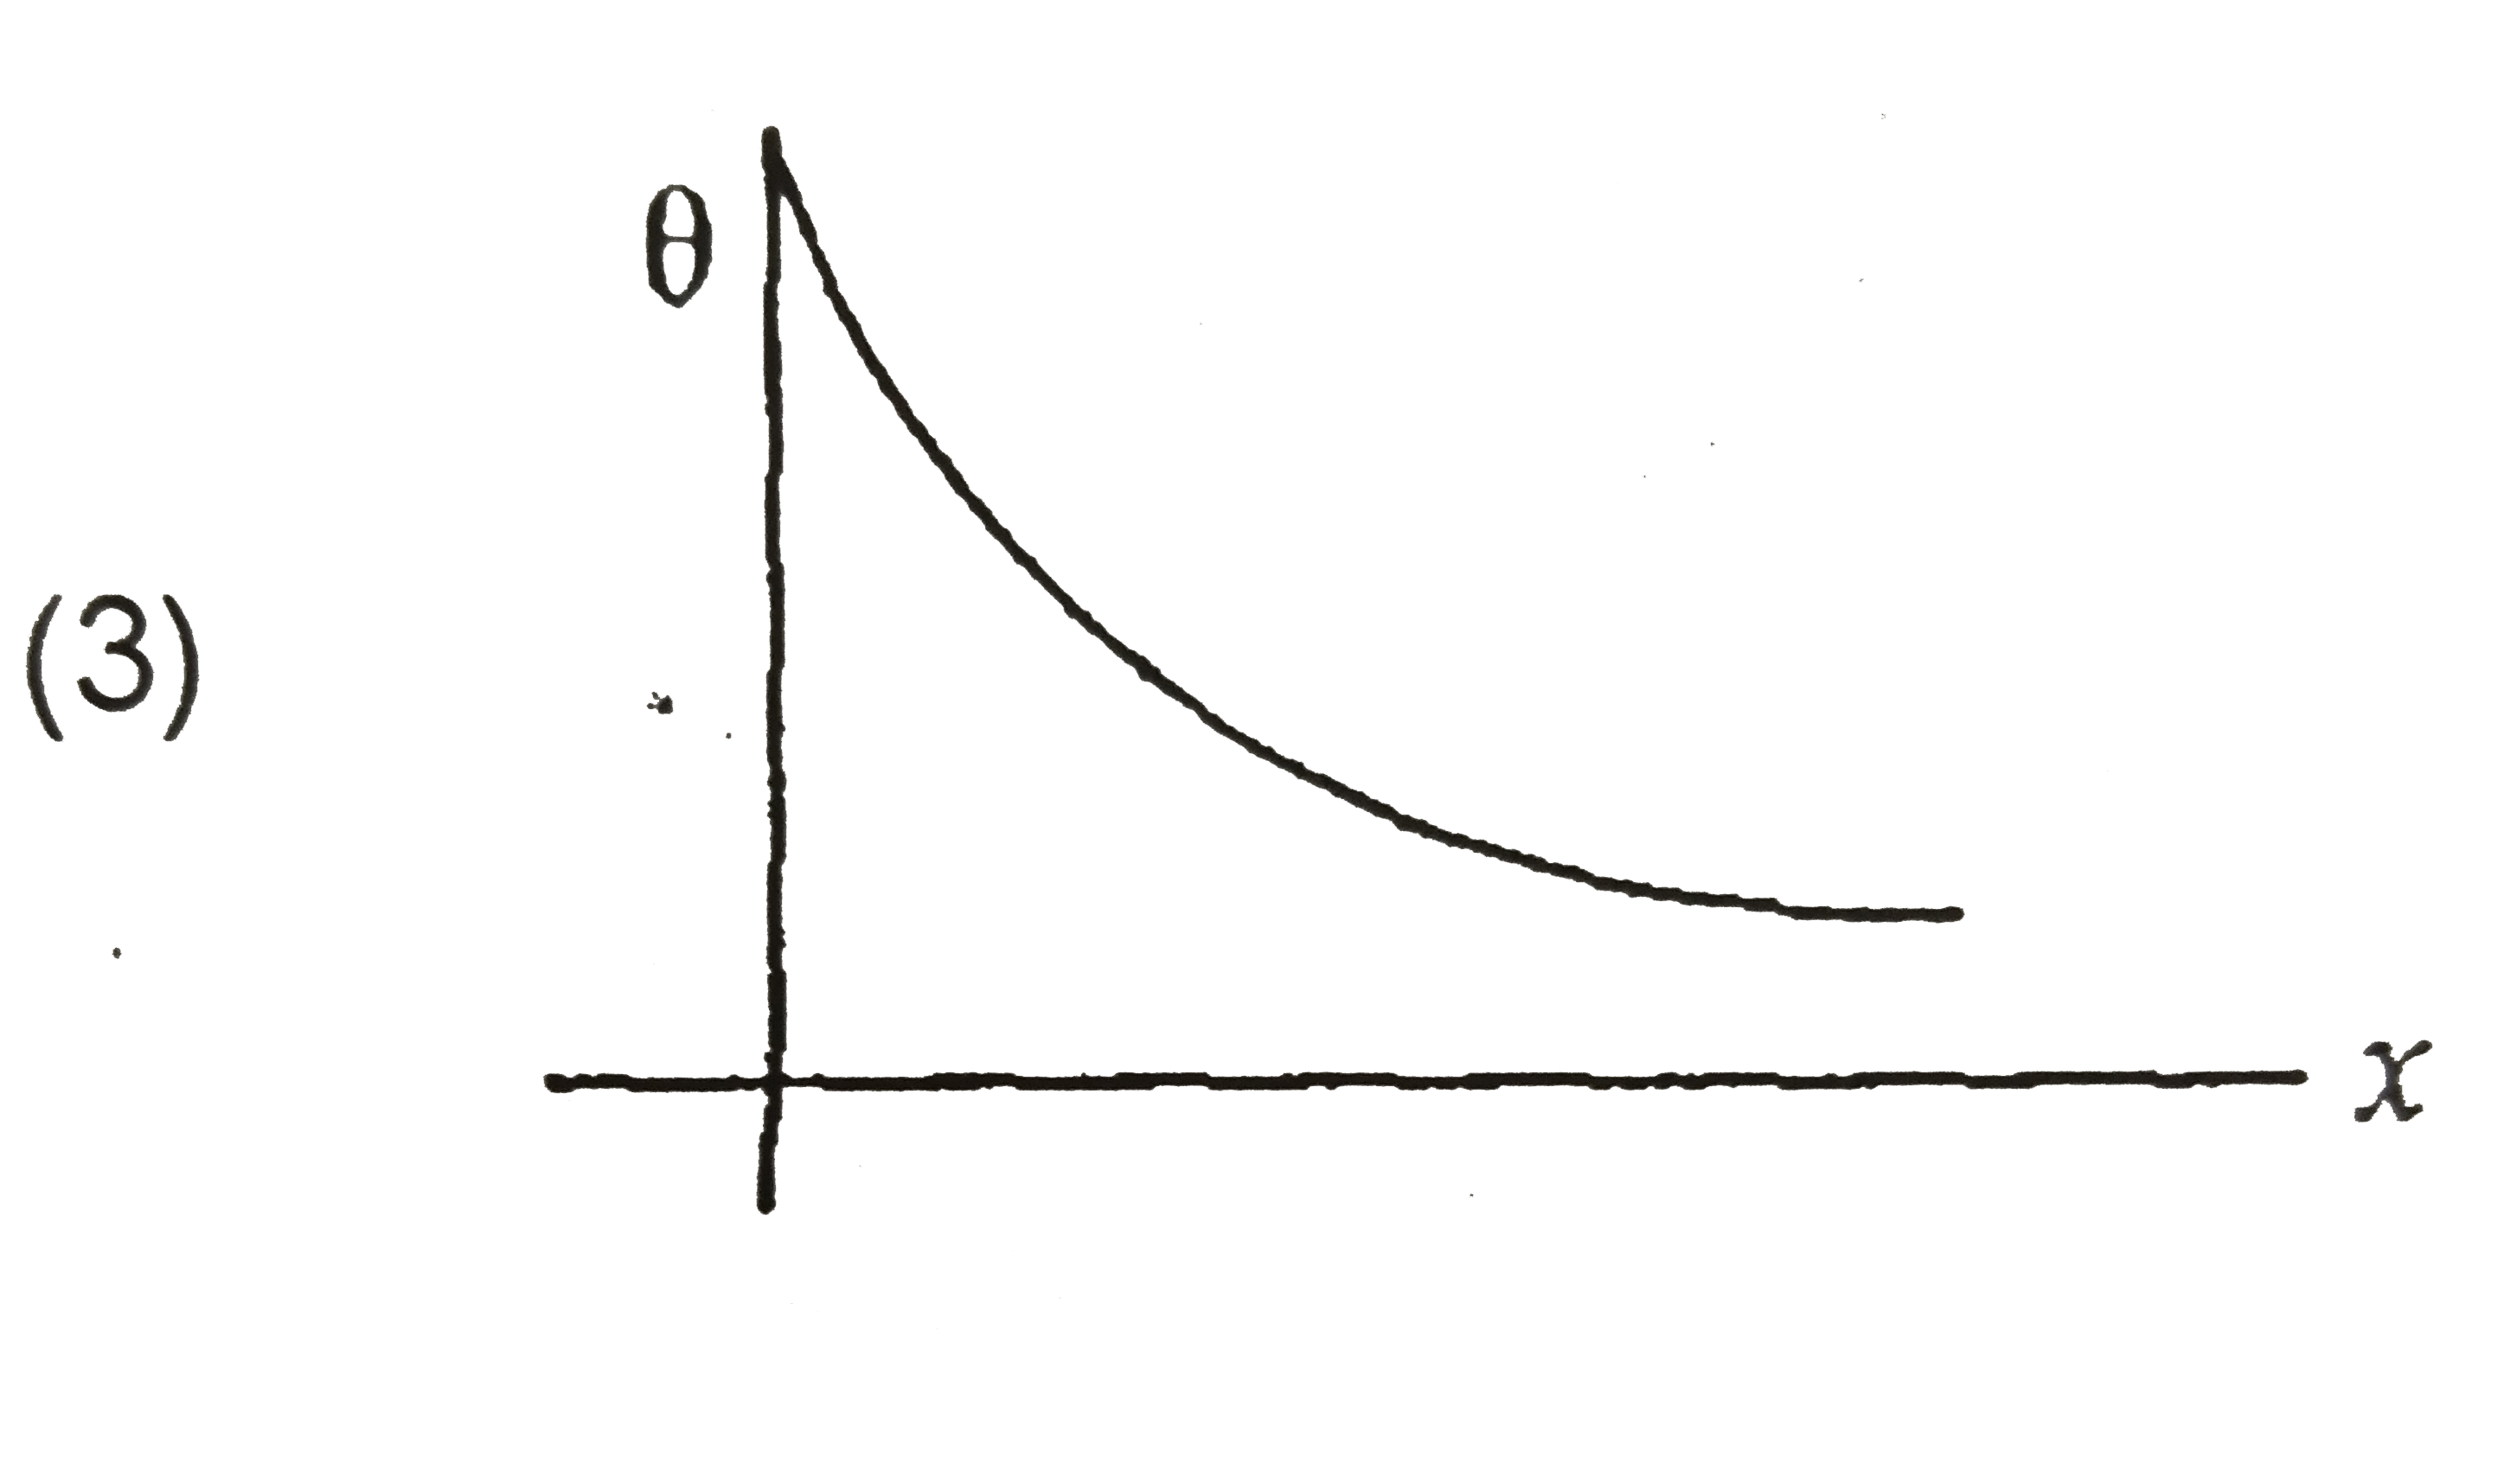
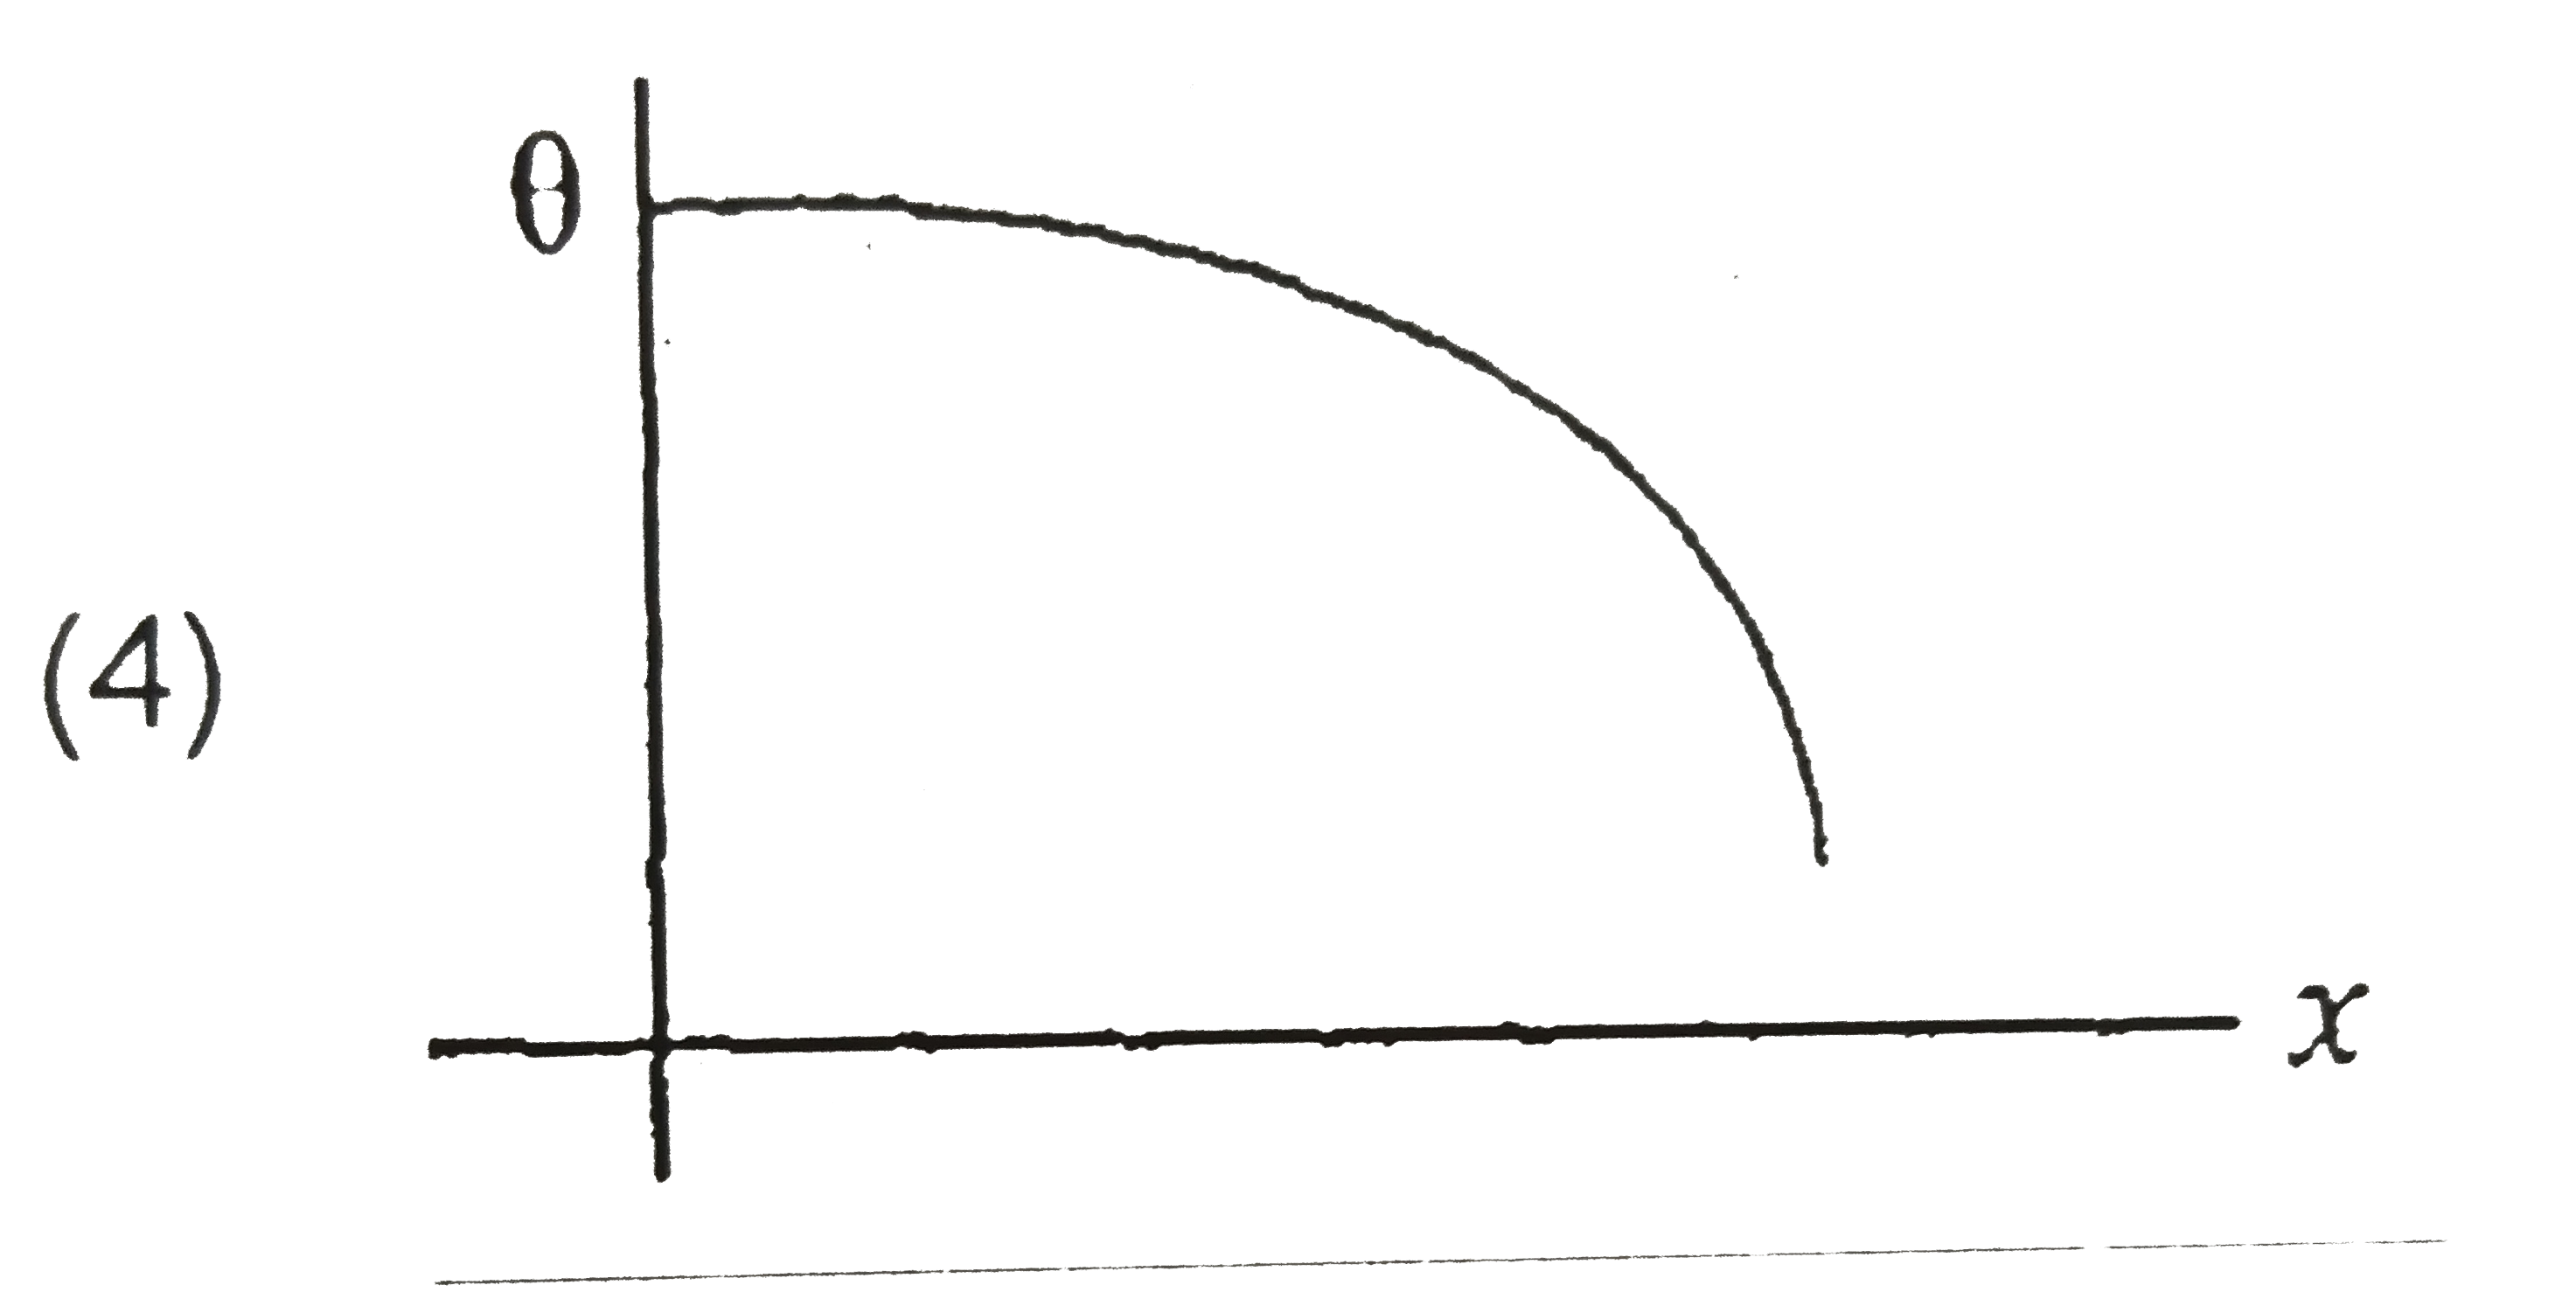
A long metallic bar is carrying heat from one of its ends to the other end under steady-state. The variation of temperature θ along the length x of the bar from its hot end is best described by which of the following figures?


The correct Answer is:B
To solve the problem of determining the temperature variation along a long metallic bar under steady-state heat conduction, we can follow these steps:
1. Understand the Setup:
- We have a long metallic bar with one end at a higher temperature (hot end) and the other end at a lower temperature (cold end).
- Let the temperature at the hot end be denoted as θ′ and the temperature at a point x along the bar be θ.
2. Apply Fourier's Law of Heat Conduction:
- According to Fourier's law, the heat transfer rate dqdt through the bar can be expressed as:
dqdt=k⋅A⋅θ′−θL
where k is the thermal conductivity, A is the cross-sectional area of the bar, and L is the length of the bar.
3. Rearranging the Equation:
- Rearranging the equation gives us:
θ′−θ=dqdt⋅Lk⋅A
- Let’s denote C=dqdt⋅1k⋅A, which is a constant since dqdt, k, and A are constants.
4. Expressing Temperature in Terms of Position:
- Now, we can express θ as:
θ=θ′−C⋅x
- This indicates that the temperature θ decreases linearly with increasing x.
5. Graphical Representation:
- The equation θ=θ′−C⋅x represents a straight line with a negative slope (since C is positive).
- The temperature is highest at x=0 (the hot end) and decreases as x increases towards the cold end.
6. Identifying the Correct Graph:
- The correct representation of this linear relationship is a straight line that starts at θ′ (the temperature at the hot end) and slopes downwards towards the cold end.
- Among the given options, the graph that shows a linear decrease in temperature with increasing x is the correct one.
Conclusion:
The variation of temperature θ along the length x of the bar is best described by the graph that shows a linear decrease from the hot end to the cold end.
- We have a long metallic bar with one end at a higher temperature (hot end) and the other end at a lower temperature (cold end).
- Let the temperature at the hot end be denoted as θ′ and the temperature at a point x along the bar be θ.
- According to Fourier's law, the heat transfer rate dqdt through the bar can be expressed as:
dqdt=k⋅A⋅θ′−θL
where k is the thermal conductivity, A is the cross-sectional area of the bar, and L is the length of the bar.
- Rearranging the equation gives us:
θ′−θ=dqdt⋅Lk⋅A
- Let’s denote C=dqdt⋅1k⋅A, which is a constant since dqdt, k, and A are constants.
- Now, we can express θ as:
θ=θ′−C⋅x
- This indicates that the temperature θ decreases linearly with increasing x.
- The equation θ=θ′−C⋅x represents a straight line with a negative slope (since C is positive).
- The temperature is highest at x=0 (the hot end) and decreases as x increases towards the cold end.
- The correct representation of this linear relationship is a straight line that starts at θ′ (the temperature at the hot end) and slopes downwards towards the cold end.
- Among the given options, the graph that shows a linear decrease in temperature with increasing x is the correct one.
The variation of temperature θ along the length x of the bar is best described by the graph that shows a linear decrease from the hot end to the cold end.
Topper's Solved these Questions
- JEE MAINSBook:JEE MAINS PREVIOUS YEAR ENGLISHChapter:JEE MAINSExercise:Chemistry
Explore 1 Video
- JEE MAINBook:JEE MAINS PREVIOUS YEAR ENGLISHChapter:JEE MAINExercise:All Questions
Explore 452 Videos
- JEE MAINS 2020Book:JEE MAINS PREVIOUS YEAR ENGLISHChapter:JEE MAINS 2020Exercise:PHYSICS
Explore 250 Videos
Similar Questions
When a steel wire fixed at one end is pulled by a constant force F at its other end , its length increases by l.Which of the following statements is not correct?
View SolutionThe ends of a long bar are maintained at different temperatures and there is no loss of heat from the sides of the bar due to conduction or radiation. The graph of temperature against distance of the bar when it has attained steady state is shown here. The graph shows (i) the temperature gradient is not uniform.
(ii) the bar has uniform cross-sectional area.
(iii) the cross-sectional area of the bar increases as the distance from the hot end increases.
(iv) the cross-sectional area of the bar becreases as the distance from the hot end increases
View SolutionA conductor of length L is placed along the x - axis , with one of its ends at x = 0 and the other at x = L. If the rate of flow of heat energy through the conduct is constant and its thermal resistance per unit length is also constant , then Which of the following graphs is/are correct ?
View SolutionA rod AB is 1m long. The temperature of its one end A is maintained at 100∘C and other end B at 10∘C, the temperature at a distance of 60 cm from point B is
View SolutionTwo men A and B are carrying a uniform bar of length L on their shoulders. The bar is held horizontally such that A gets one-fourth load. If A is at one end of the bar, the distance of B from that end is
View SolutionExplain the term temperature gradient. The two ends of a metal bar are maintained at two different consistant temperatures. On a single graph draw sketches to show the variation of temperature along the bar when its surface is (i) perfectly lagged and (ii) unlagged. Explain the shape of the two sketches.
View SolutionA rod is of length 3 m and its mass acting per unit length is directly proportional to distance x from its one end. The centre of gravity of the rod from that end will be at
View SolutionThe one end of a 20 m long ladder is on the floor and the other end is in the contact of vertical wall. Its lower end slides on the floor. Show that the rate of sliding of the upper end is 4/3 times the rate of sliding the lower end when the lower end is 16 m away from the wall.
View SolutionAssume that the thermal conductivity of copper is twice that of aluminium and four times that of brass. Three metal rods made of copper, aluminium and brass are each 15 cm long and 2 cm in diameter. These rods are placed end to end, with aluminium between the other two. The free ends of the copper and brass rods are maintained at 100∘C and 0∘C respectively. The system is allowed to reach the steady state condition. Assume there is no loss of heat anywhere.
When steady state condition is reached everywhere, which of the following statement is true?
View Solution
