In a uniformly charged sphere of total charge Q and radius R, the electric field E is plotted as function of distance from the centre, The graph which would correspond to the above will be:
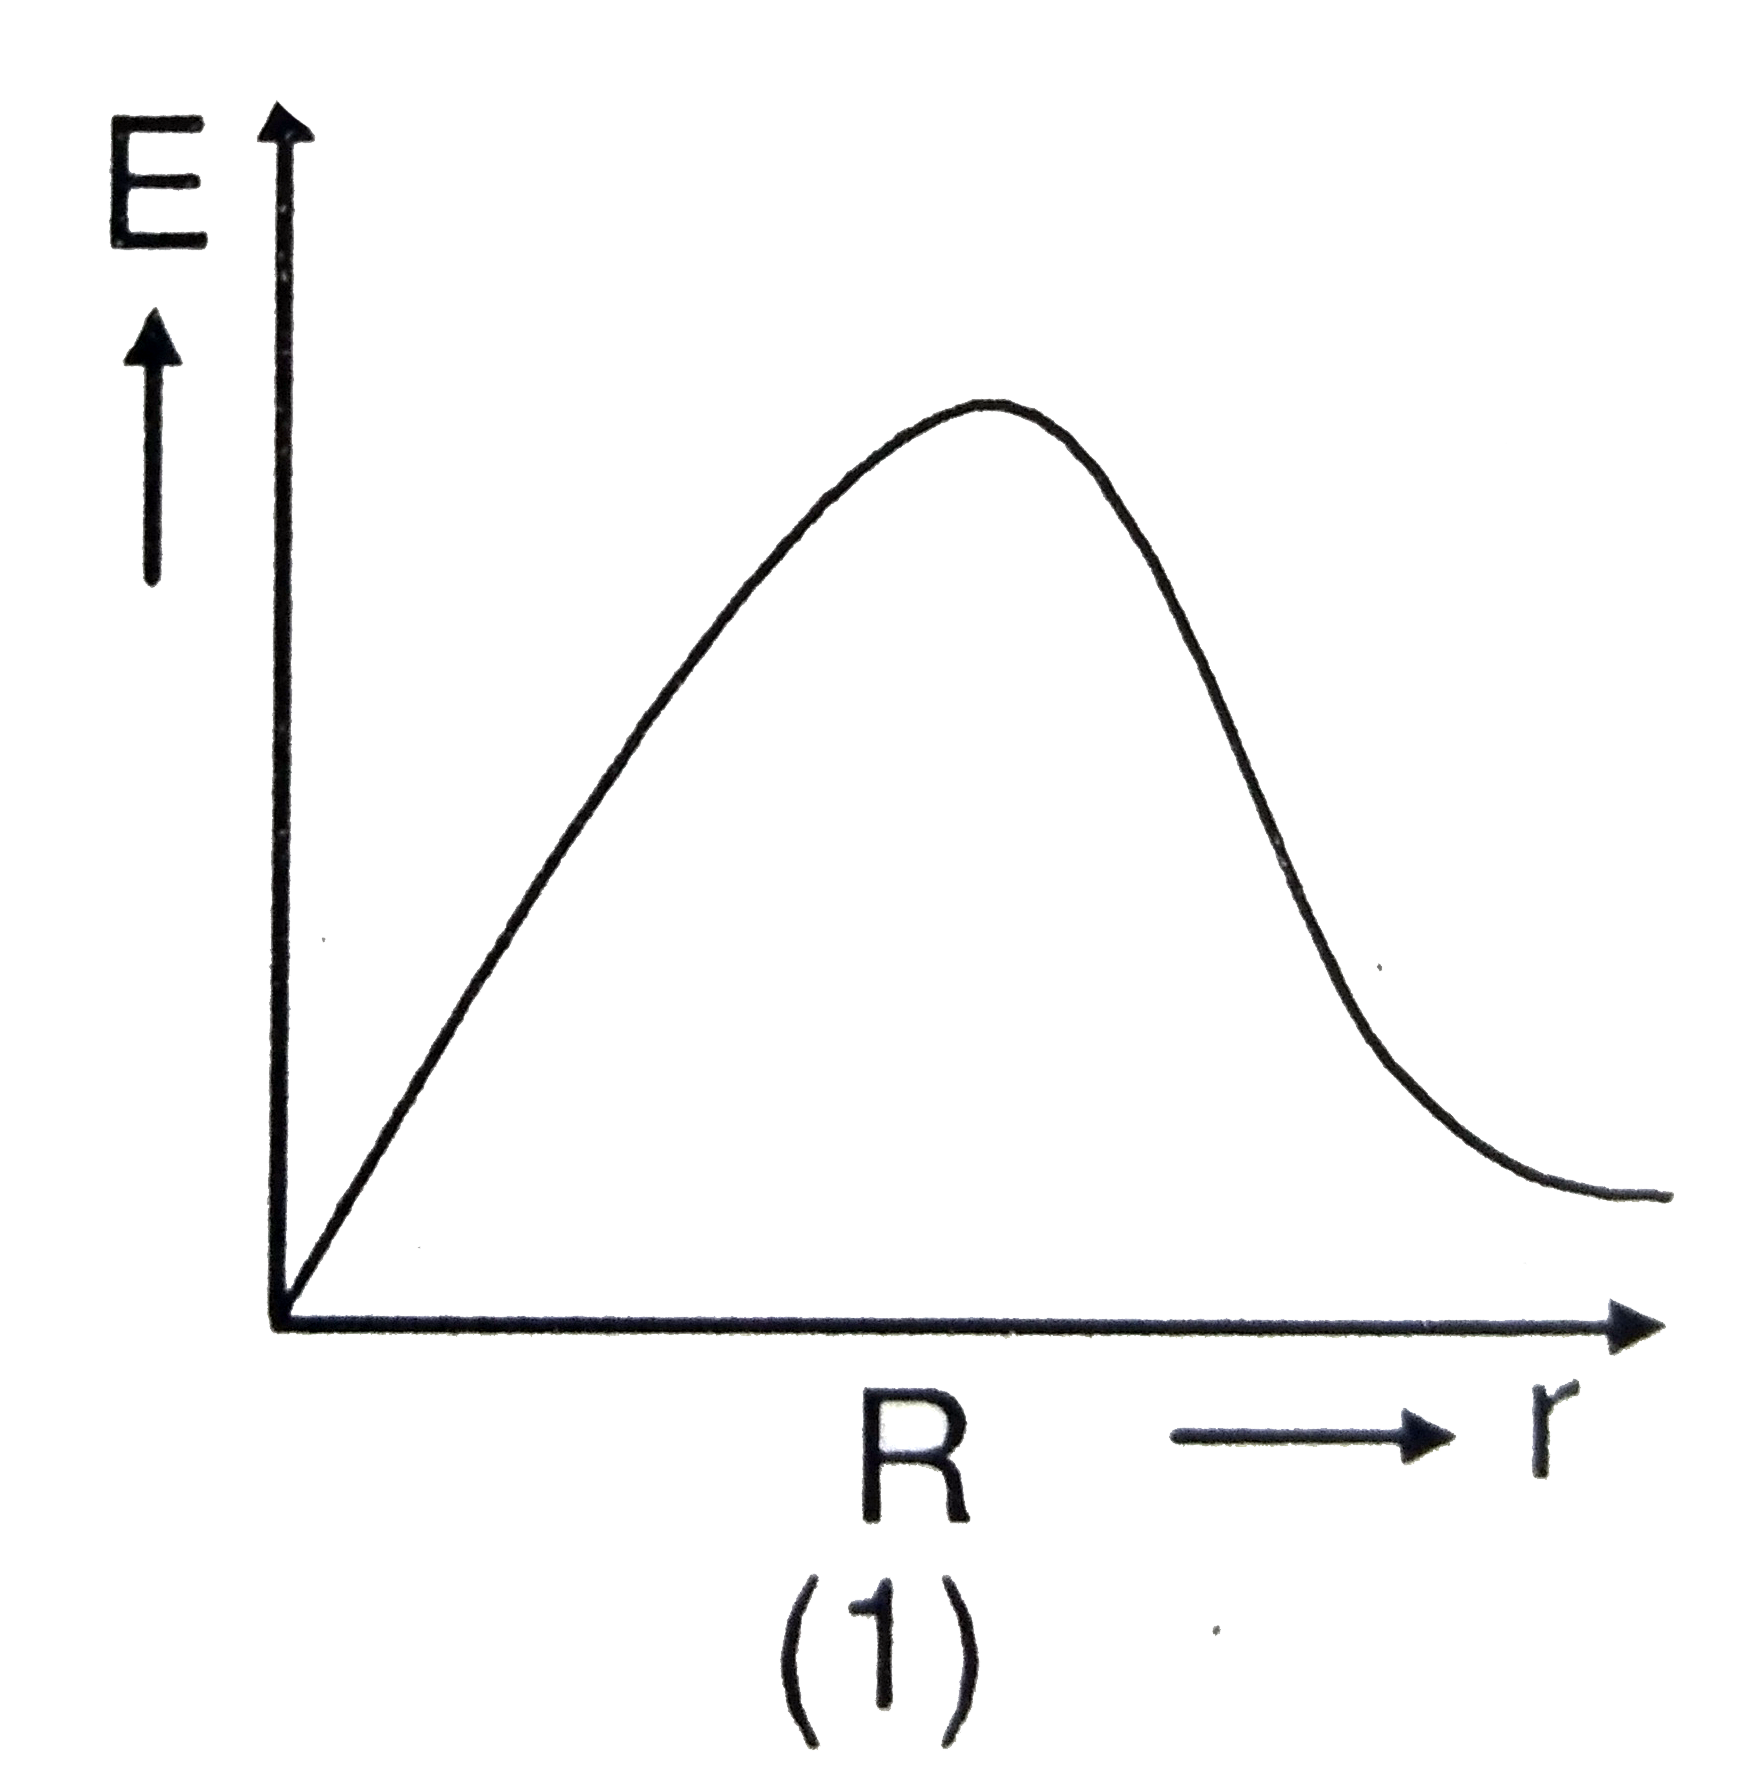
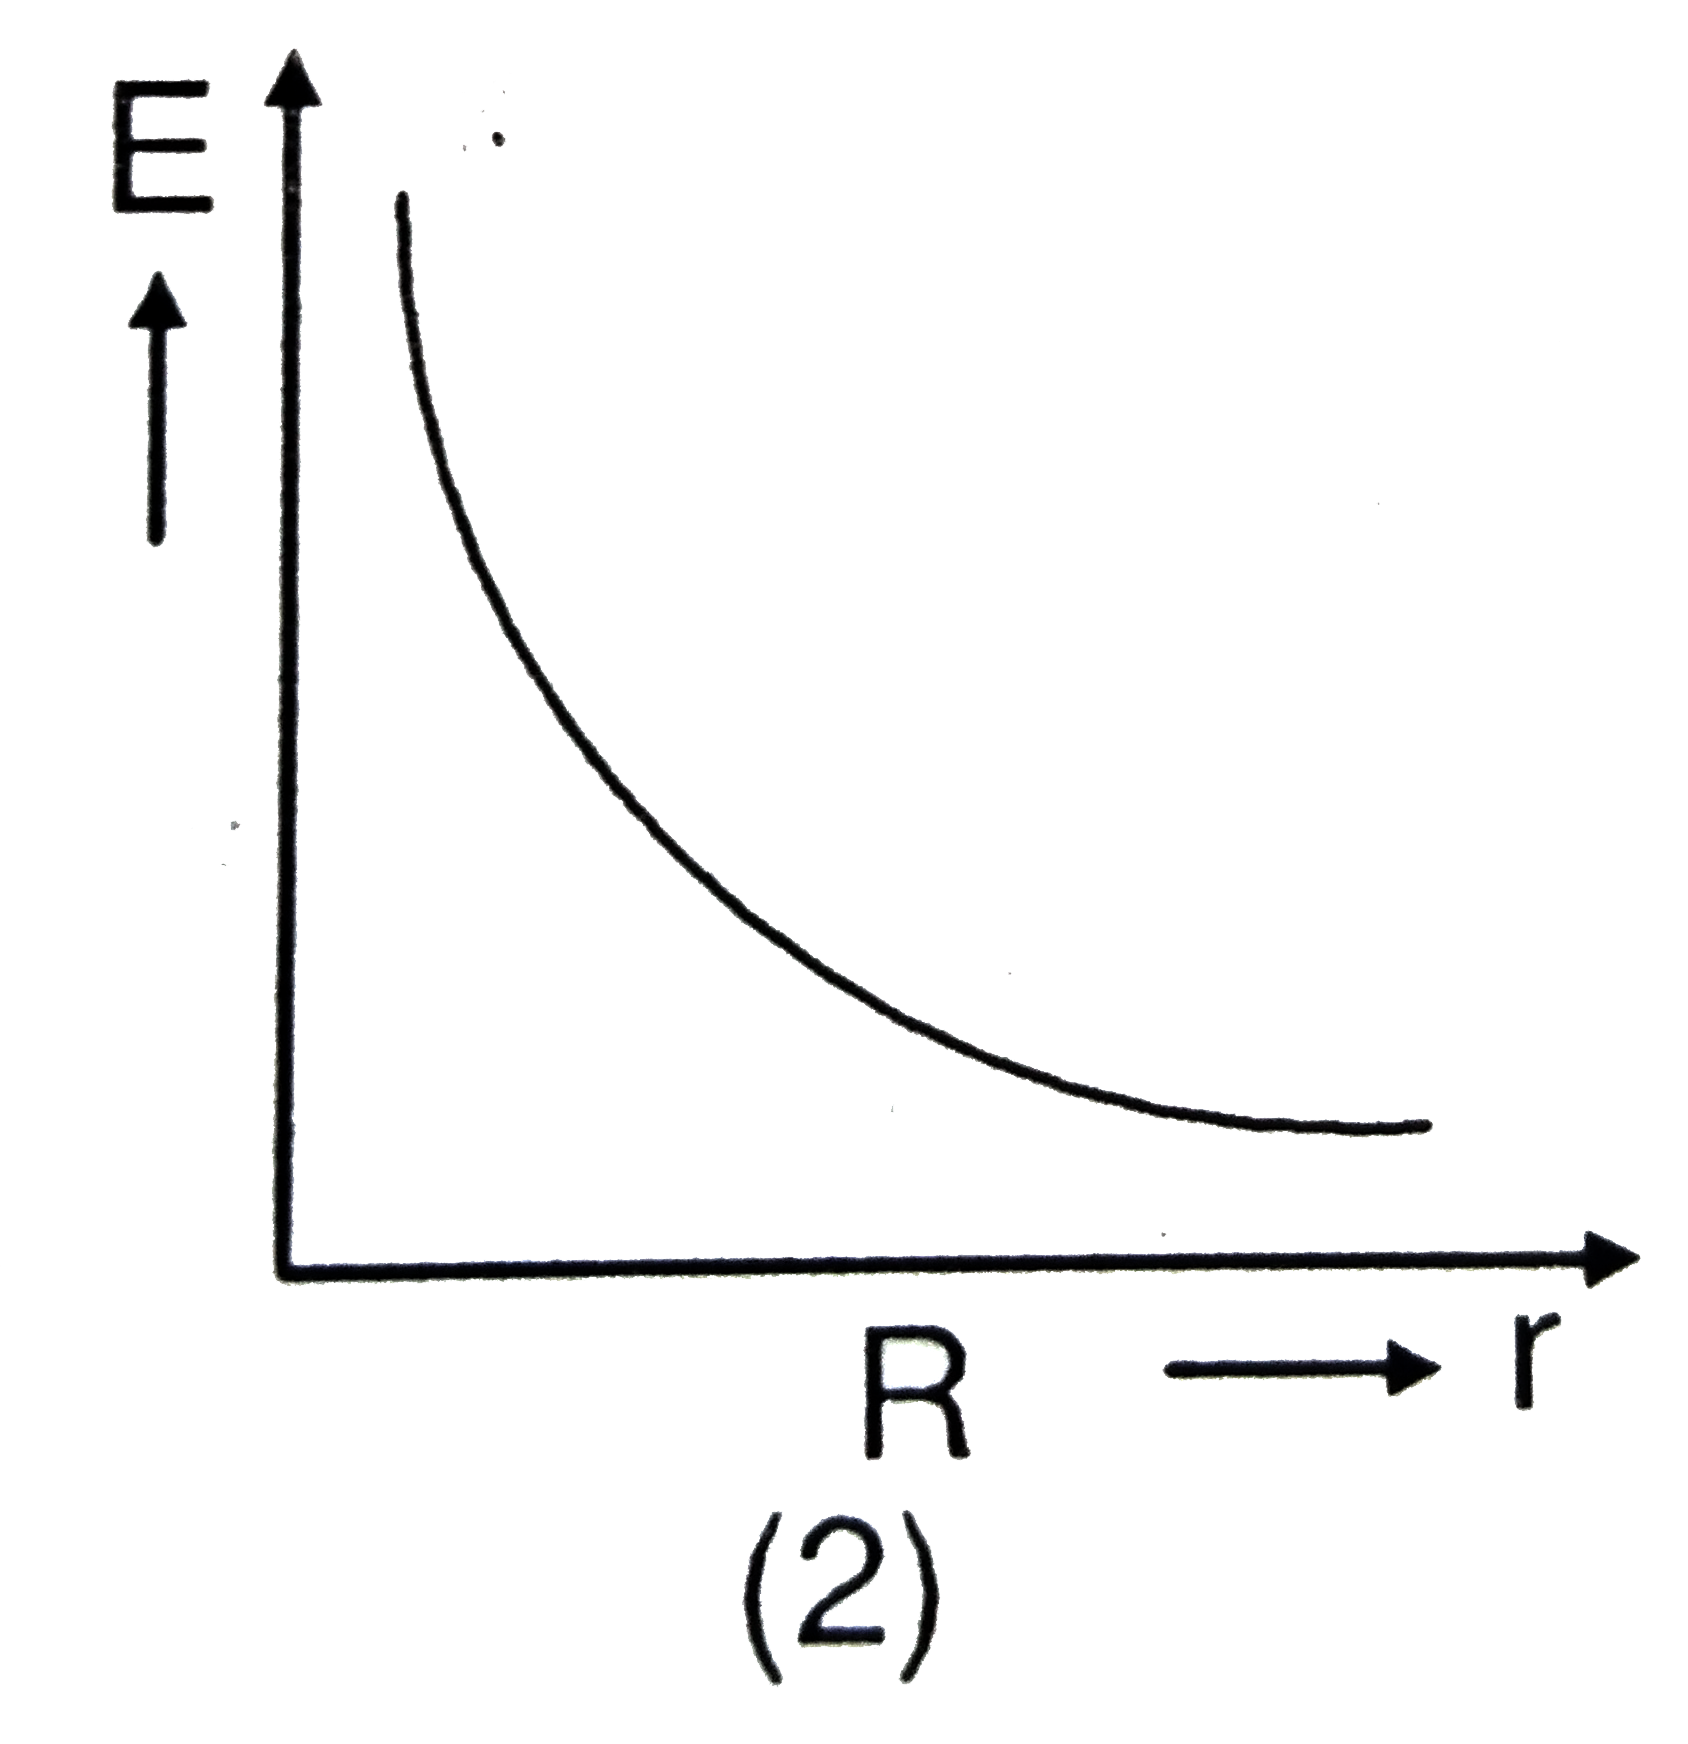
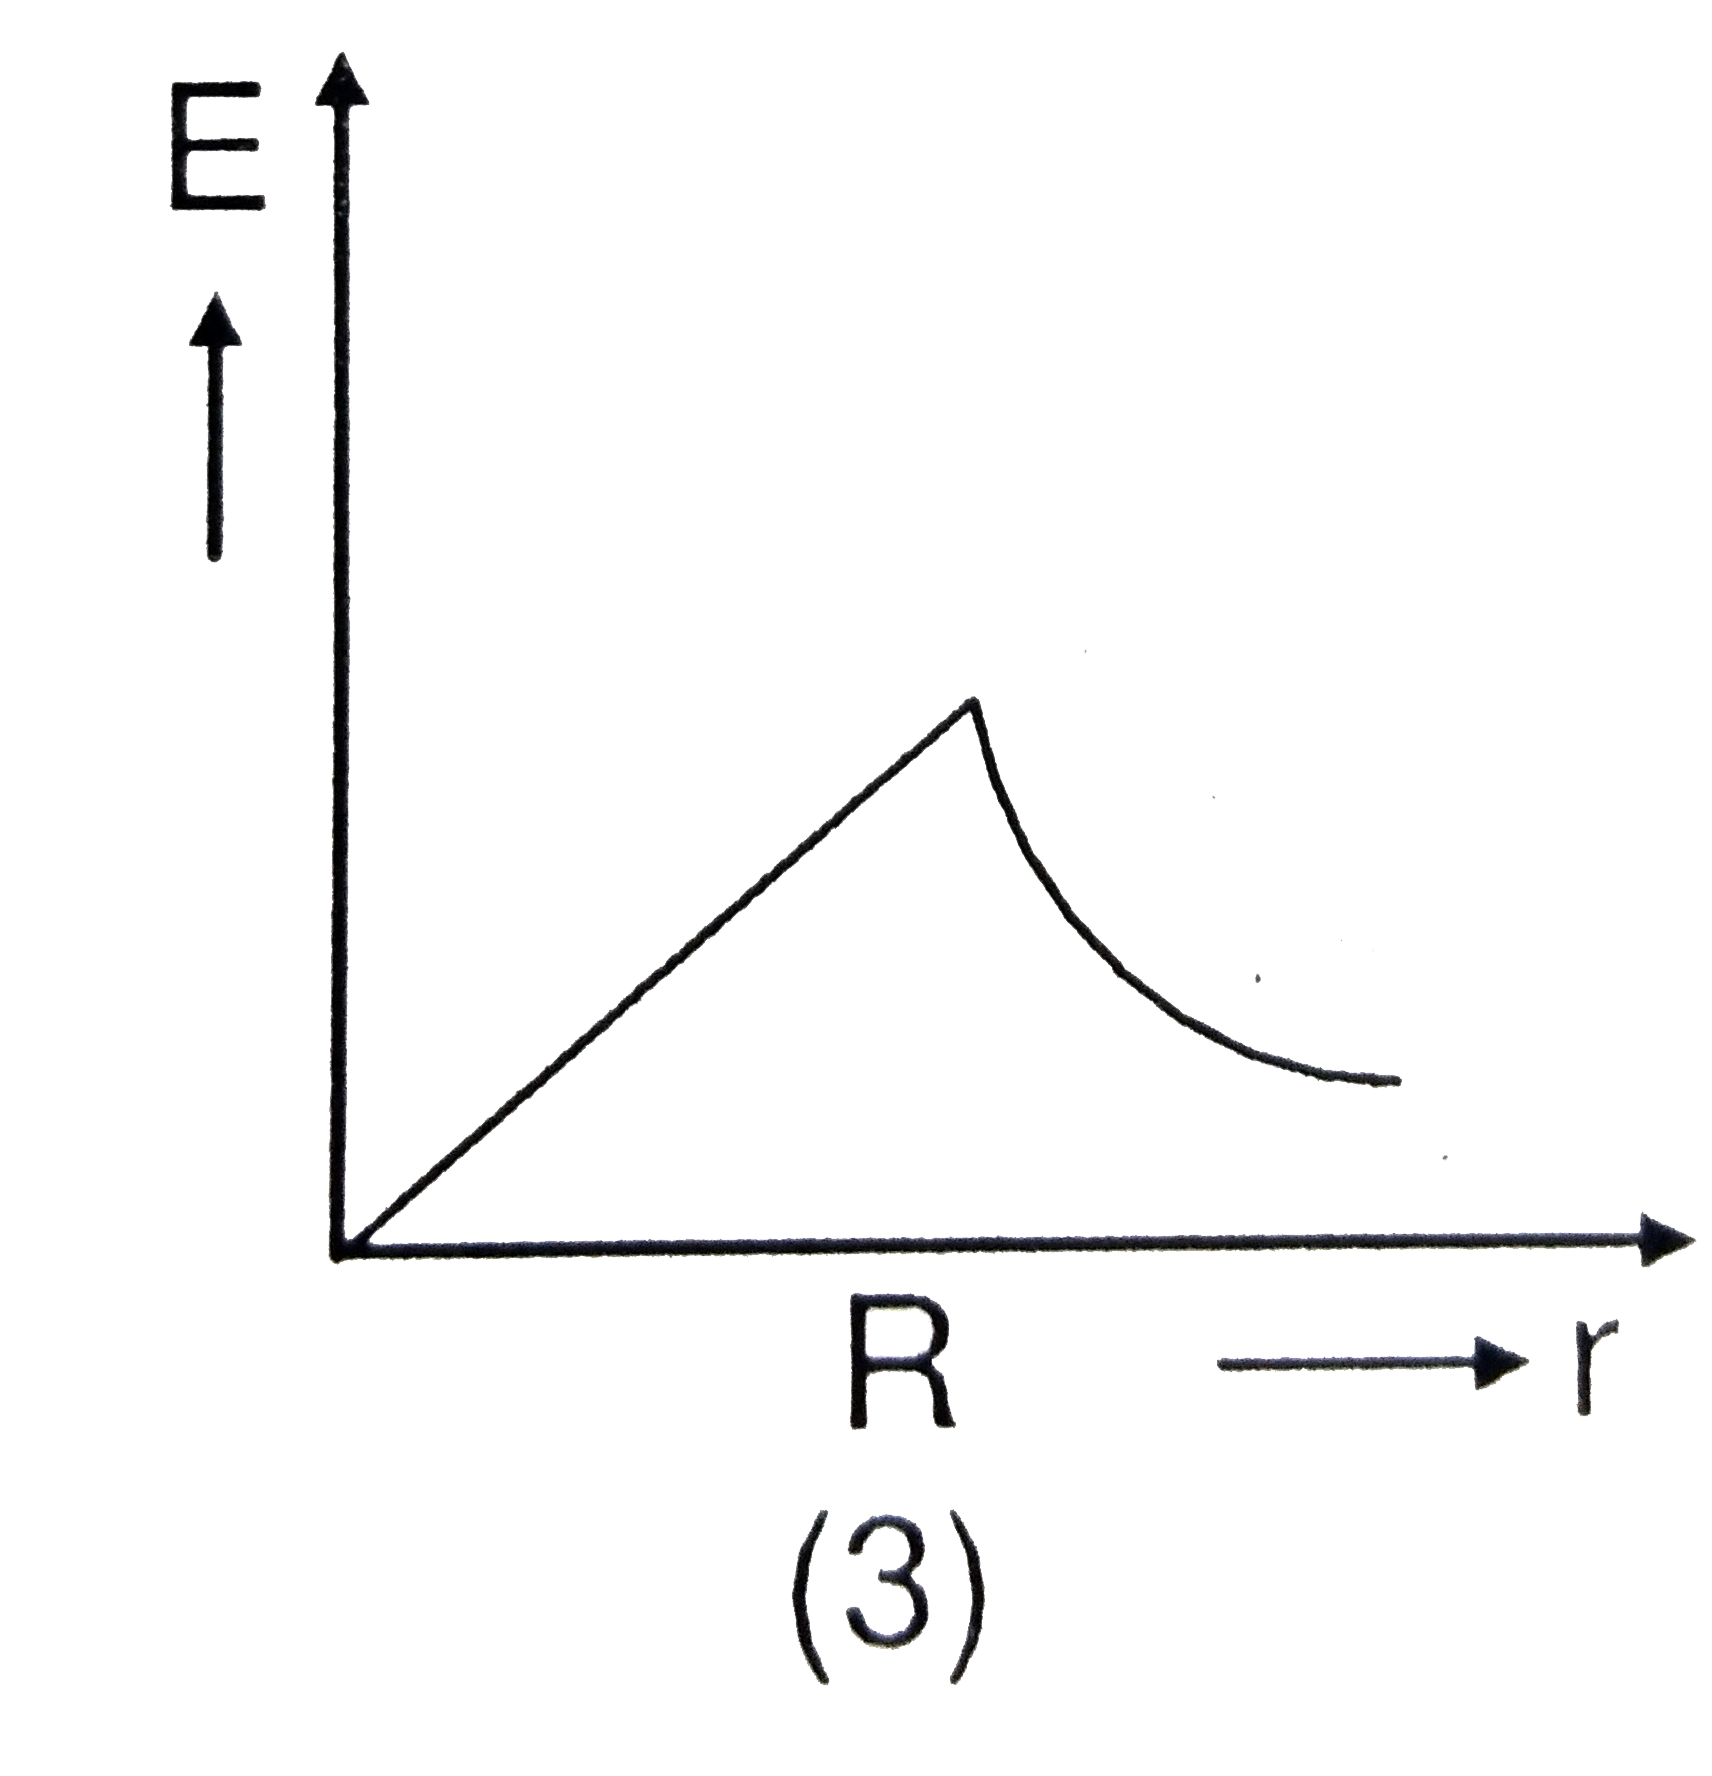
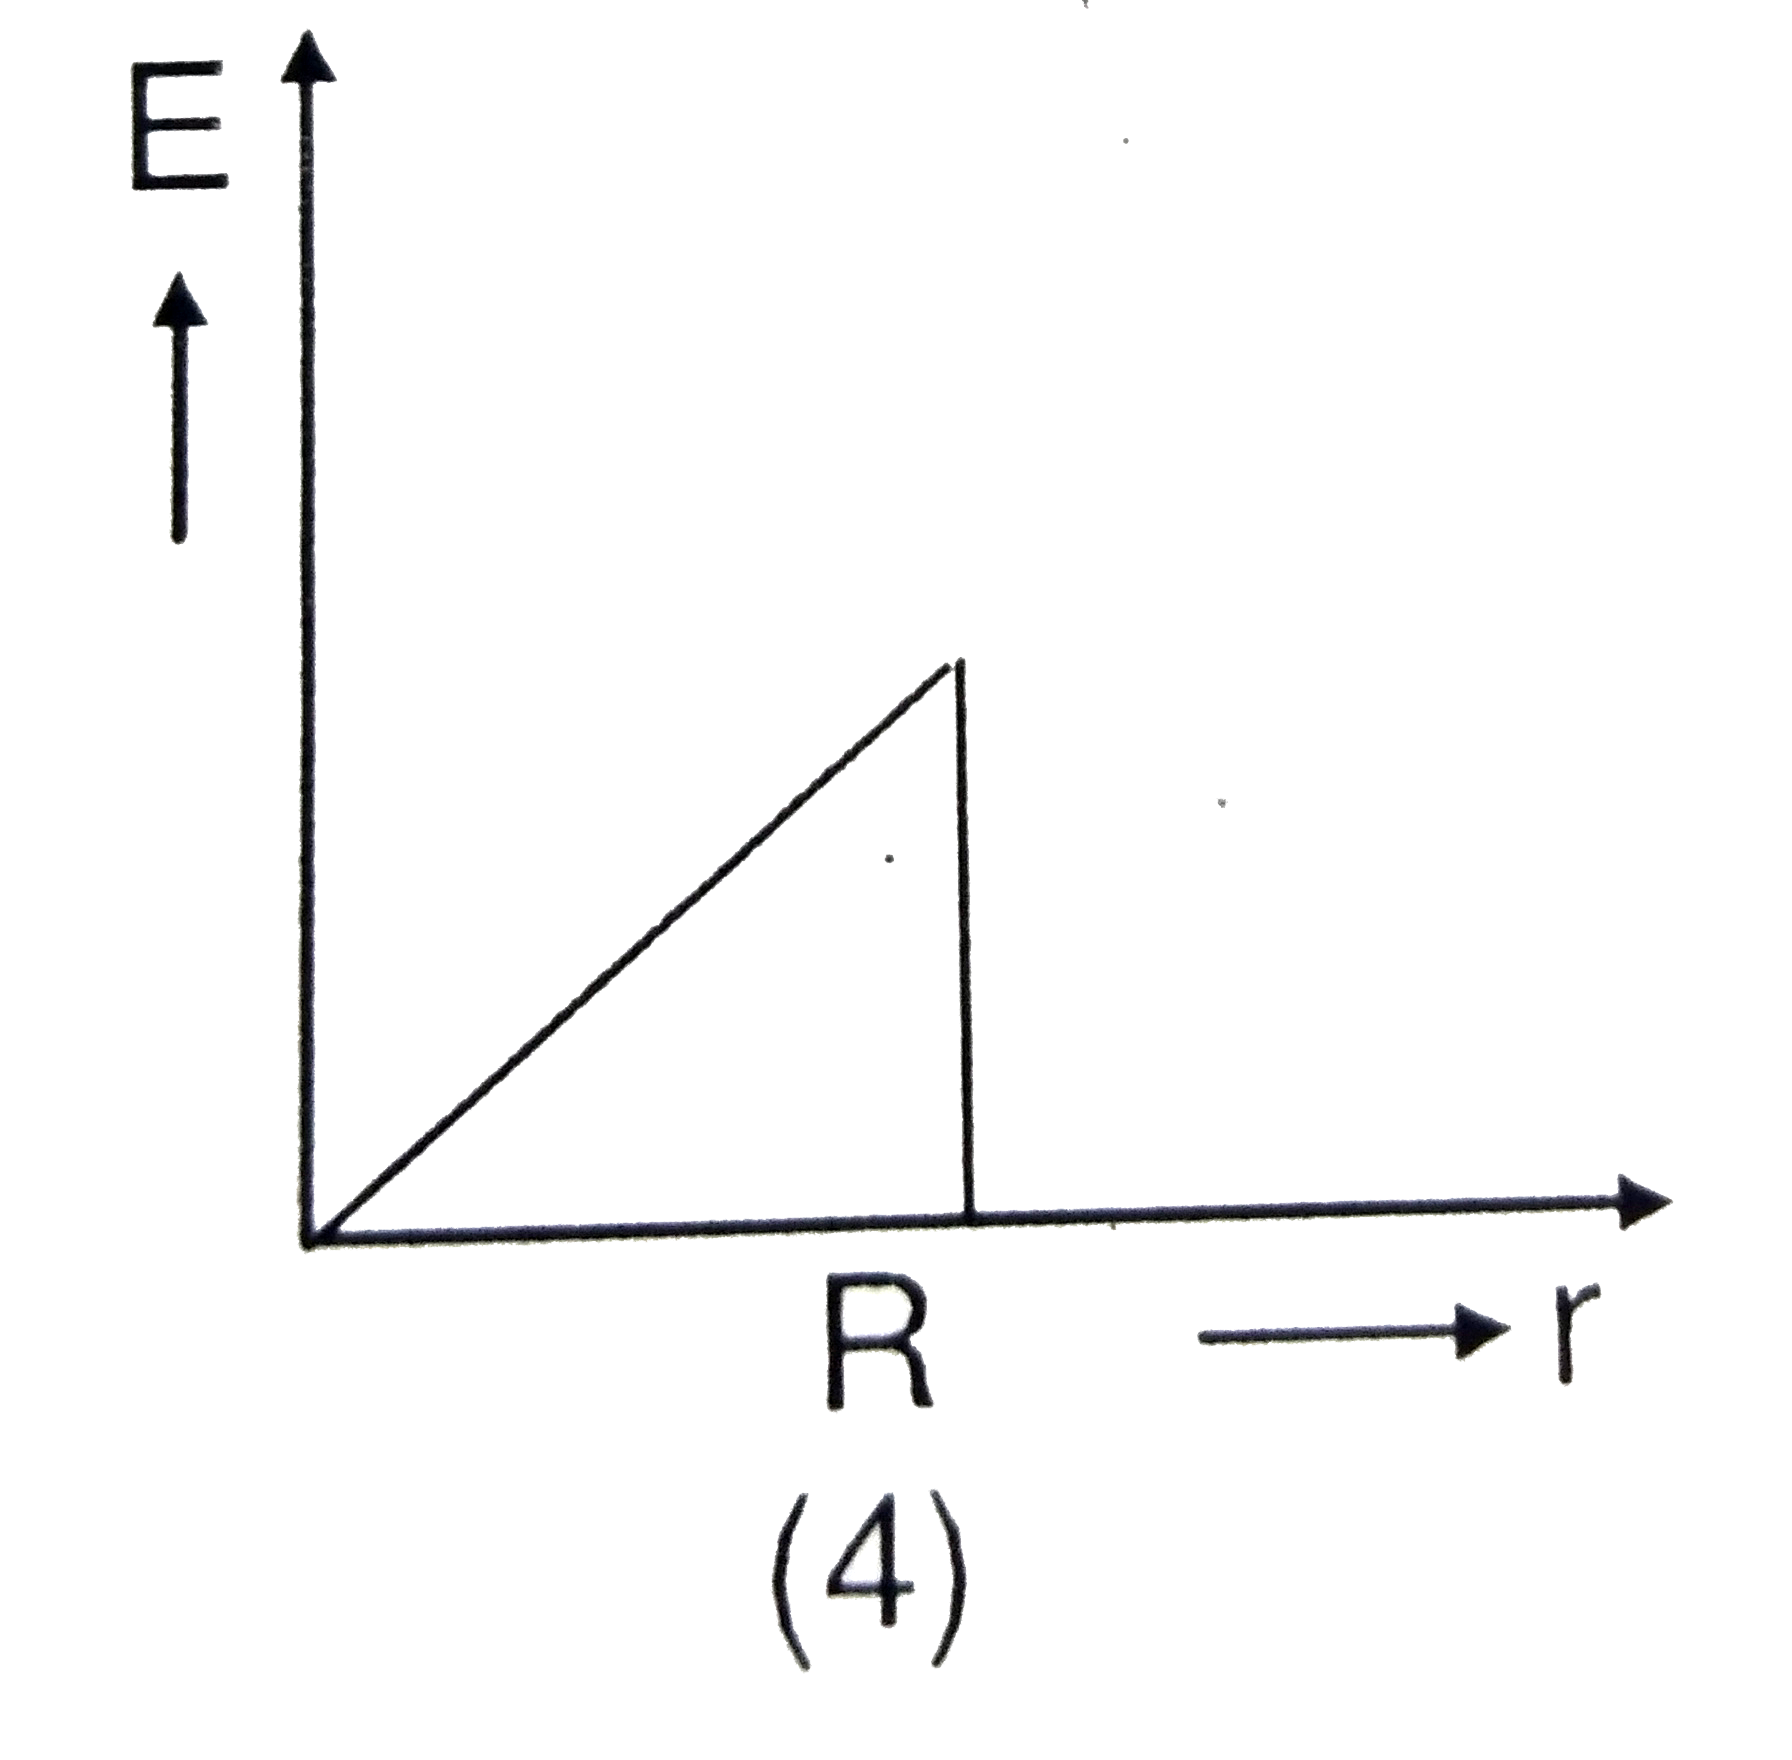
The correct Answer is:C
To solve the problem of finding the electric field E as a function of distance from the center of a uniformly charged sphere with total charge Q and radius R, we will analyze the electric field both inside and outside the sphere using Gauss's law.
1. Understanding the Problem:
We have a uniformly charged sphere with total charge Q and radius R. We need to determine how the electric field E varies with distance r from the center of the sphere.
2. Electric Field Inside the Sphere:
For points inside the sphere (where r<R):
- According to Gauss's law, the electric field E at a distance r from the center can be calculated using a Gaussian surface of radius r.
- The charge enclosed by this Gaussian surface is given by:
Qenc=ρ⋅V=ρ⋅43πr3
where ρ is the charge density and V is the volume of the sphere of radius r.
- The charge density ρ can be expressed as:
ρ=Q43πR3
- Substituting this into the expression for Qenc:
Qenc=Q43πR3⋅43πr3=Q⋅r3R3
- Applying Gauss's law:
E⋅4πr2=Qencϵ0
- Therefore:
E⋅4πr2=Q⋅r3R3ϵ0
- Solving for E:
E=Q4πϵ0R3r
- This shows that the electric field inside the sphere increases linearly with r.
3. Electric Field Outside the Sphere:
For points outside the sphere (where r≥R):
- The entire charge Q can be treated as if it were concentrated at the center of the sphere.
- Thus, the electric field E at a distance r is given by:
E=Q4πϵ0r2
- This indicates that the electric field decreases with the square of the distance from the center.
4. Graphical Representation:
- For r<R, the electric field E increases linearly from 0 to a maximum value at r=R.
- For r≥R, the electric field E decreases with 1r2.
- Therefore, the graph of E as a function of r will show a linear increase for r<R and a hyperbolic decrease for r≥R.
5. Conclusion:
The correct graph corresponding to the electric field E as a function of distance r from the center of the uniformly charged sphere will show a linear increase for r<R and a 1r2 decrease for r≥R.
We have a uniformly charged sphere with total charge Q and radius R. We need to determine how the electric field E varies with distance r from the center of the sphere.
For points inside the sphere (where r<R):
- According to Gauss's law, the electric field E at a distance r from the center can be calculated using a Gaussian surface of radius r.
- The charge enclosed by this Gaussian surface is given by:
Qenc=ρ⋅V=ρ⋅43πr3
where ρ is the charge density and V is the volume of the sphere of radius r.
- The charge density ρ can be expressed as:
ρ=Q43πR3
- Substituting this into the expression for Qenc:
Qenc=Q43πR3⋅43πr3=Q⋅r3R3
- Applying Gauss's law:
E⋅4πr2=Qencϵ0
- Therefore:
E⋅4πr2=Q⋅r3R3ϵ0
- Solving for E:
E=Q4πϵ0R3r
- This shows that the electric field inside the sphere increases linearly with r.
For points outside the sphere (where r≥R):
- The entire charge Q can be treated as if it were concentrated at the center of the sphere.
- Thus, the electric field E at a distance r is given by:
E=Q4πϵ0r2
- This indicates that the electric field decreases with the square of the distance from the center.
- For r<R, the electric field E increases linearly from 0 to a maximum value at r=R.
- For r≥R, the electric field E decreases with 1r2.
- Therefore, the graph of E as a function of r will show a linear increase for r<R and a hyperbolic decrease for r≥R.
The correct graph corresponding to the electric field E as a function of distance r from the center of the uniformly charged sphere will show a linear increase for r<R and a 1r2 decrease for r≥R.
Topper's Solved these Questions
Similar Questions
For a uniformly charged ring of radius R, the electric field on its exis has the largest magnitude at a distance h from its centre. Then value of h is :
View SolutionA hallow metal sphere of radius R is uniformly charged. The electric field due to the sphere at a distance r from the centre:
View SolutionA solid sphere of radius R is charged uniformly. The electrostatic potential V is plotted as a function of distance r from the centre of th sphere. Which of the following best represents the resulting curve?
View SolutionIf the potential at the centre of a uniformly charged hollow sphere of radius R is V, then electric field at a distance r from the centre of sphere will be (r>R).

View SolutionFigure shows a uniformly charged thin non-conducting sphere of total charge Q and radius R. If point charge q is situated at point 'A' which is at a distance r<R from centre of the sphere, then find out following :
(i) Force acting on charge q.
(ii) Electric field at centre of sphere.
(iii) Electric field at point B.

View SolutionThe electrostatic potential of a uniformly charged thin spherical shell of charge Q and radius R at a distance r from the centre
View SolutionAt a point 20cm from the centre of a uniformly charged dielectric sphere of radius 10cm, the electric field is 100V/m. The electric field at 3cm from the centre of the sphere will be
View SolutionA non-conducting solid sphere of radius R, has a uniform charge density. The graph representing variation of magnitude of electric field (E) as a function of distance (x) from the centre of the sphere is

View SolutionThe electric field due to uniformly charged sphere of radius R as a function of the distance from its centre is represented graphically by
View SolutionA ring of radius R is placed in the plane its centre at origin and its axis along the x-asis and having uniformly distributed positive charge. A ring of radius r(<<R) and coaxial with the larger ring is moving along the axis with constant velcity , then the variation of electrical flux (ϕ) passing through the smaller ring with position will be best represent by :
View Solution
