The hysteresis curve for a material is shown in the figure. Then for the material retentivity, coercivity and saturation magnetization respectively will be
1.5 T, 50 A/m and 1.0 T
1.0 T, 50 A/m and 1.5 T
150 A/m, 1.0 T and 1.5 T
1.5 T, 50 A/m and 1.0 T
The correct Answer is:2
To solve the problem regarding the hysteresis curve for a material and to determine the retentivity, coercivity, and saturation magnetization, we can follow these steps:
1. Understanding the Hysteresis Curve:
- The hysteresis curve is a plot of magnetization (I) versus magnetic intensity (H). It shows how the magnetization of a material responds to an external magnetic field.
2. Identifying Retentivity:
- Retentivity is defined as the magnetization that remains in the material when the external magnetic field (H) is reduced to zero.
- From the hysteresis curve, locate the point where H = 0. The corresponding value of I at this point represents the retentivity.
- In the given figure, if the value of I at H = 0 is 1, then the retentivity is 1.
3. Identifying Coercivity:
- Coercivity is the measure of the resistance of a ferromagnetic material to becoming demagnetized. It is defined as the amount of magnetic intensity required to reduce the magnetization to zero after the material has been magnetized.
- From the hysteresis curve, find the value of H at which I returns to 0 after reaching the maximum magnetization. If this value is -50, then the coercivity is 50.
4. Identifying Saturation Magnetization:
- Saturation magnetization is the maximum magnetization that a material can achieve when subjected to a sufficiently strong magnetic field.
- On the hysteresis curve, this is the maximum value of I before it levels off and does not increase with further increases in H. If this value is 1.5, then the saturation magnetization is 1.5.
5. Final Values:
- Based on the observations from the hysteresis curve:
- Retentivity = 1
- Coercivity = 50
- Saturation Magnetization = 1.5
6. Conclusion:
- Therefore, the values for retentivity, coercivity, and saturation magnetization are 1, 50, and 1.5, respectively. The correct option from the provided choices is option number 2.
- The hysteresis curve is a plot of magnetization (I) versus magnetic intensity (H). It shows how the magnetization of a material responds to an external magnetic field.
- Retentivity is defined as the magnetization that remains in the material when the external magnetic field (H) is reduced to zero.
- From the hysteresis curve, locate the point where H = 0. The corresponding value of I at this point represents the retentivity.
- In the given figure, if the value of I at H = 0 is 1, then the retentivity is 1.
- Coercivity is the measure of the resistance of a ferromagnetic material to becoming demagnetized. It is defined as the amount of magnetic intensity required to reduce the magnetization to zero after the material has been magnetized.
- From the hysteresis curve, find the value of H at which I returns to 0 after reaching the maximum magnetization. If this value is -50, then the coercivity is 50.
- Saturation magnetization is the maximum magnetization that a material can achieve when subjected to a sufficiently strong magnetic field.
- On the hysteresis curve, this is the maximum value of I before it levels off and does not increase with further increases in H. If this value is 1.5, then the saturation magnetization is 1.5.
- Based on the observations from the hysteresis curve:
- Retentivity = 1
- Coercivity = 50
- Saturation Magnetization = 1.5
- Therefore, the values for retentivity, coercivity, and saturation magnetization are 1, 50, and 1.5, respectively. The correct option from the provided choices is option number 2.
Topper's Solved these Questions
Similar Questions
Knowledge Check
The hysteresis cycle forhe material of a transformer core is
Ashort and wideBtall and narrowCtall and wideDshort and narrow
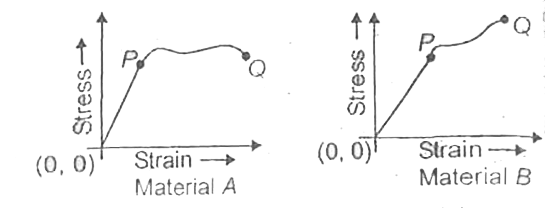
The stress-strain graphs for two materials A and are shown in figure. The graphs are drawn to the same scale. Select the correct statement
View SolutionThe permanent magnetic moment of the atoms of a material is not zero. The material
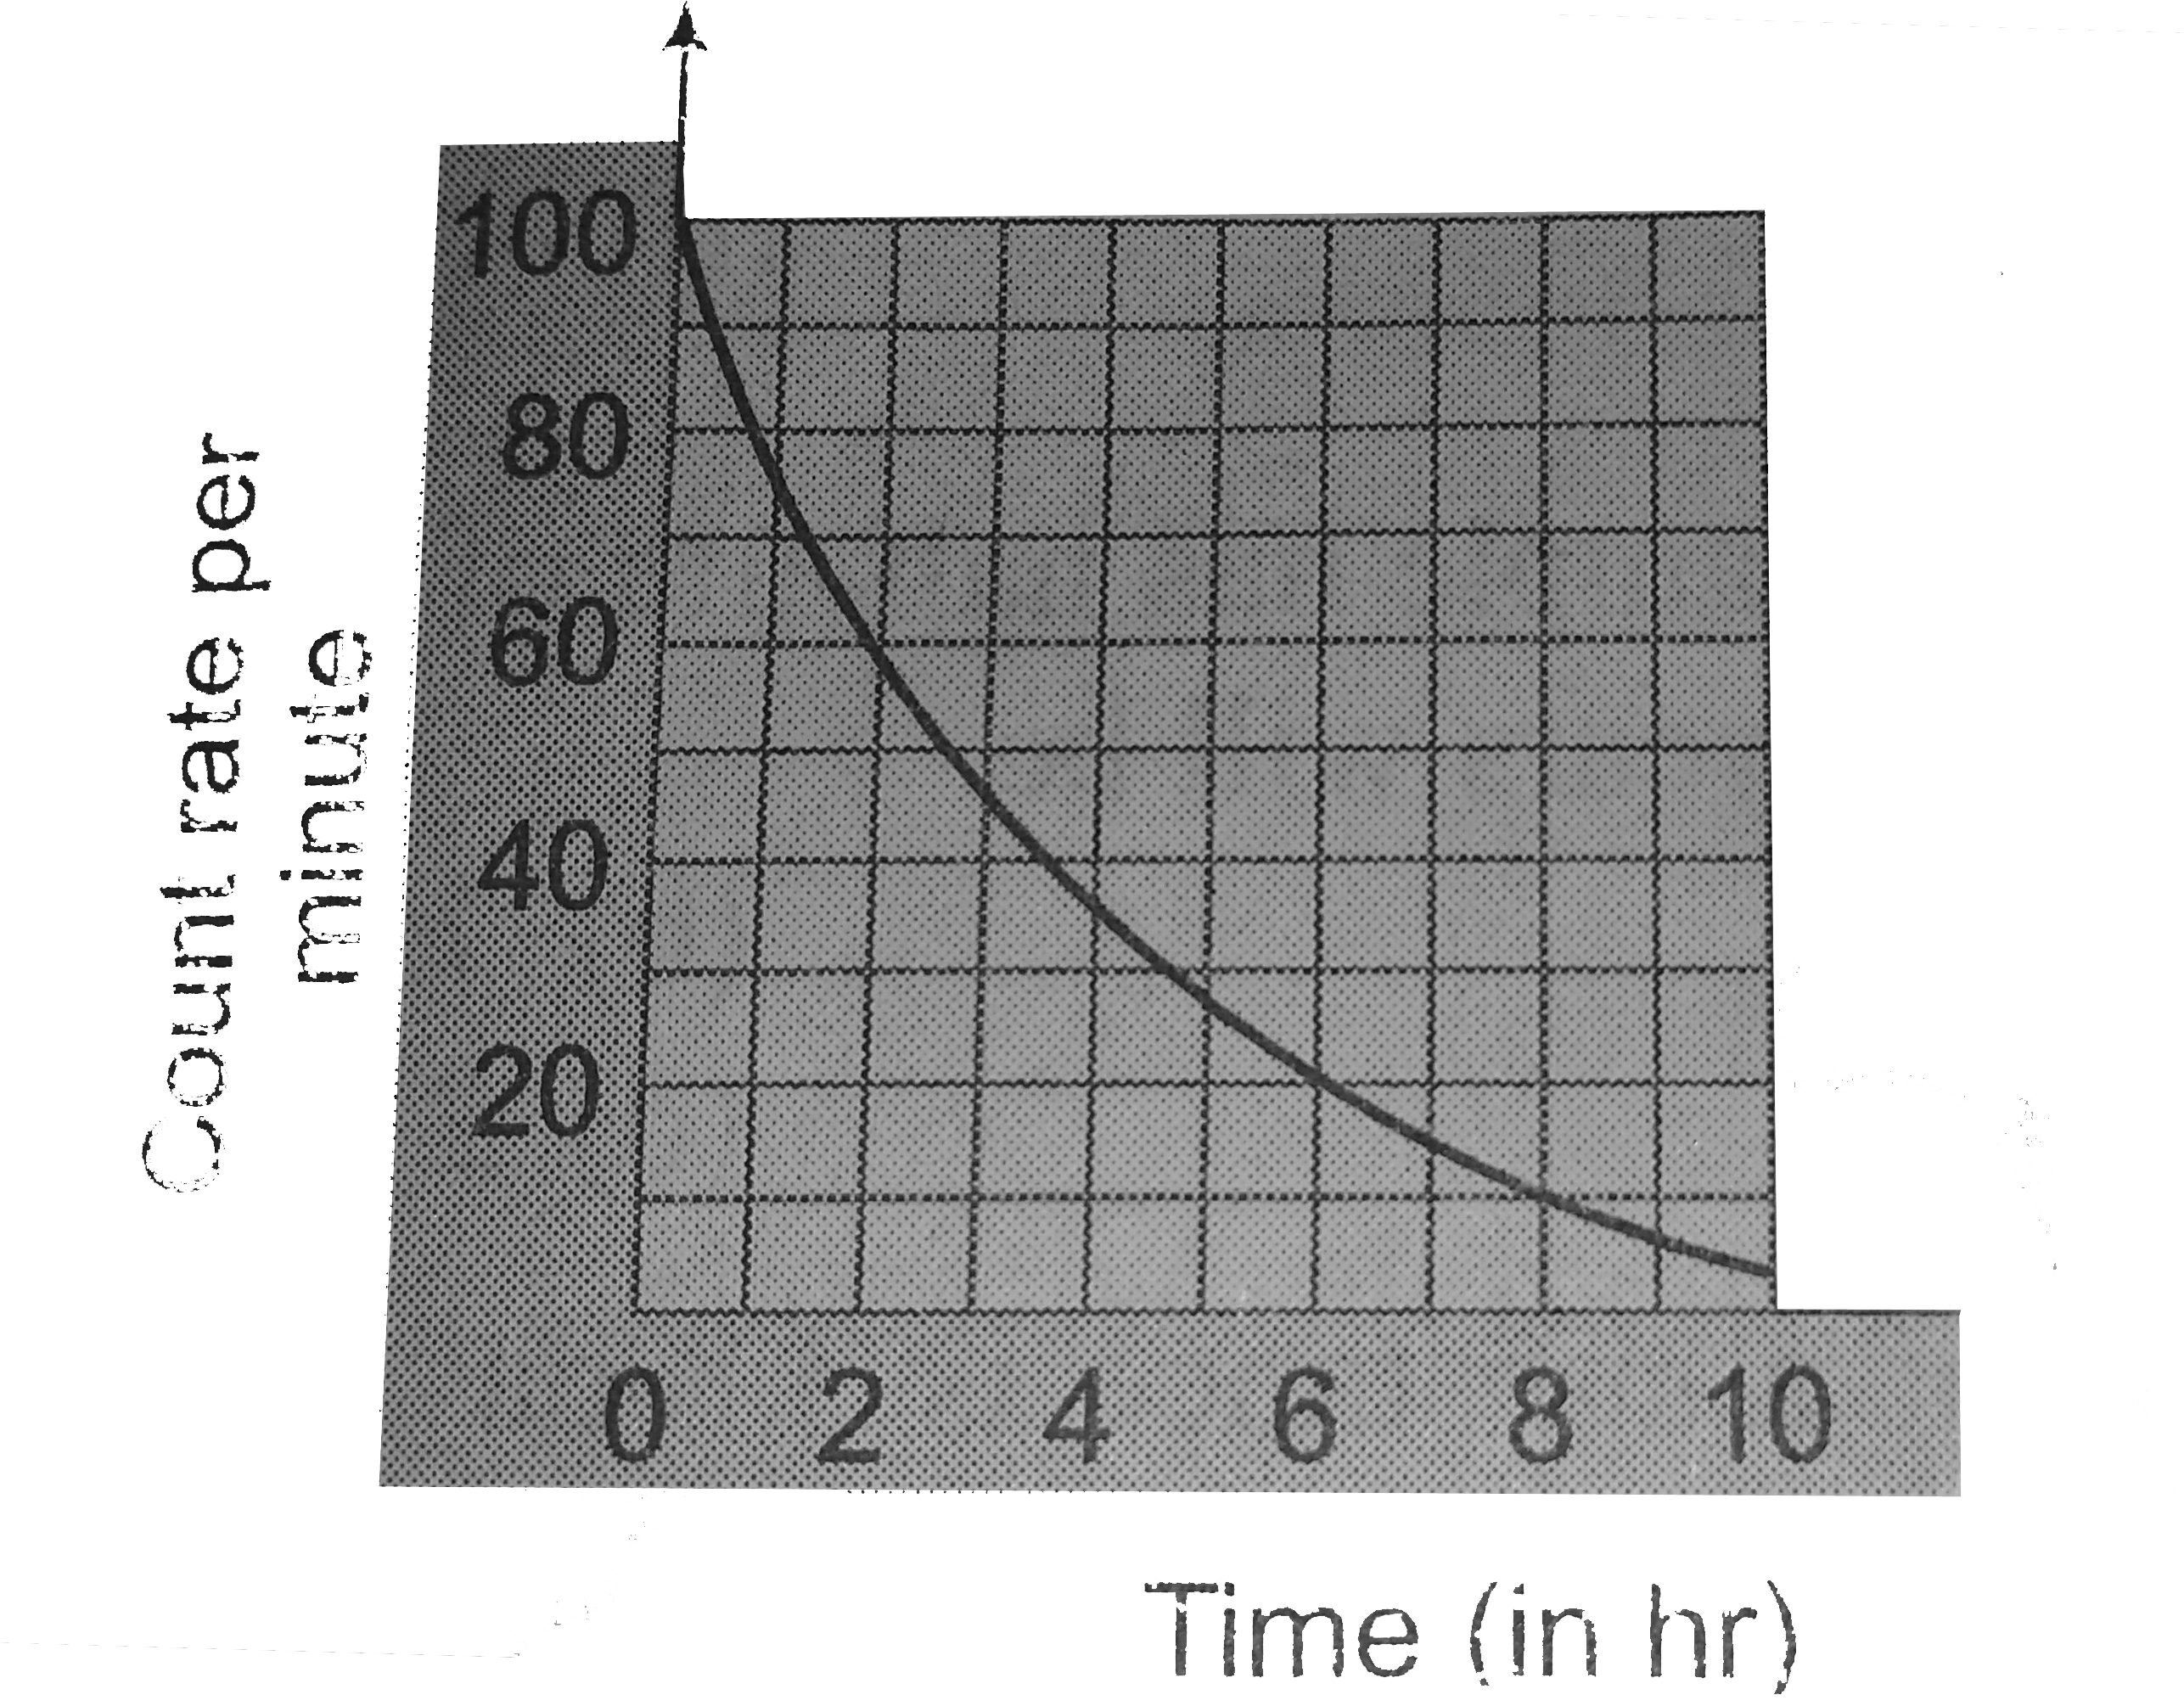
View SolutionThe count rate of 10g of radioactive material was measured at different times and times has been shown in the figure. The half-life of material and the total counts (approximately) in the first half life period, respectively are.
 .
.
View SolutionThe variation of temperature of a material as heat is given to it at a constant rate is shown in the figure. The material is in solid state at the point O. The state of the material at the point P is…..
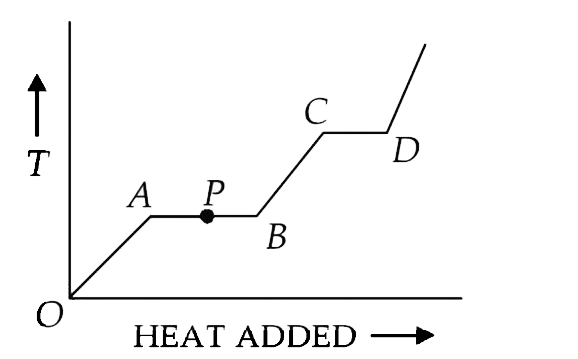
View SolutionThe variation of temperature of a material as heat is given to it at a constant rate is shown in the figure. The material is in solid state at the point O. The state of the material at the point P is…..

View SolutionThe stress-strain graphs for two materials A and B are shown in the figure. The graphs are drawn to the same scale.
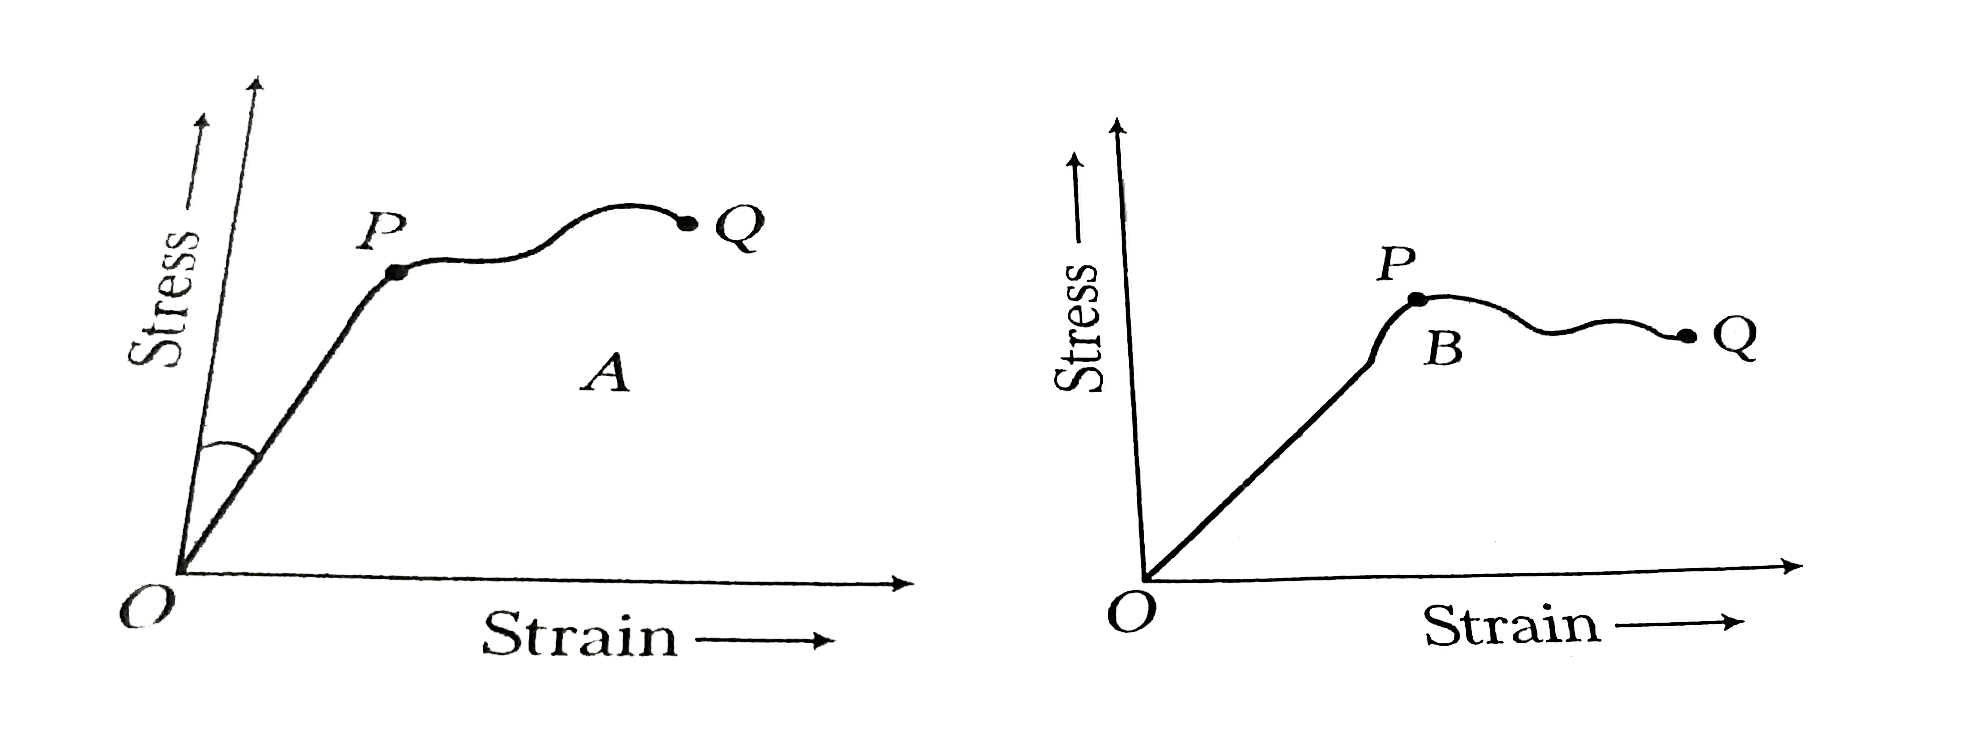
(a) Which material has a greater Young's modulus ?
(b) Which material is more ductile ?
(c) Which material is more brittle?
(d) Which of the two is the stronger material ?
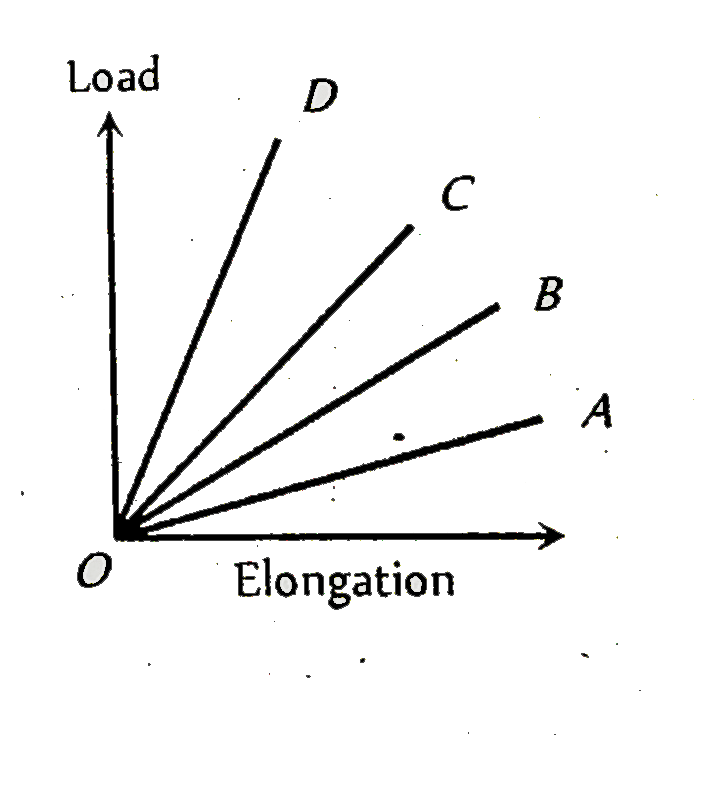
View SolutionThe load versus elongation graph for four wires of the same material is shown in the figure. The thickest wire is represented by
View Solution

