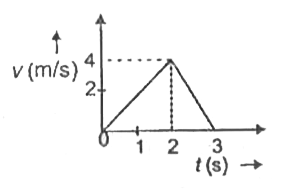
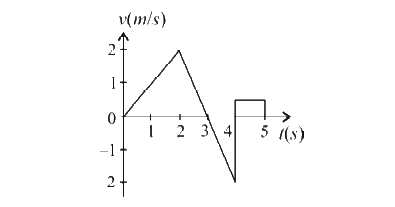
The velocity (v) and time (t) graph of a body in a straight line motion is shown in the figure . The point S is at 4.333 seconds . The total distance covered by the body in 6s is :
373m
12 m
11m
494m
To solve the problem of finding the total distance covered by the body in 6 seconds using the velocity-time graph, we will follow these steps:
Step 1: Identify the time intervals and the areas under the graph
- The graph shows the velocity of the body at different time intervals. We need to break down the graph into segments to calculate the area under the curve for each segment.
- The point S is at 4.333 seconds, which is approximately 1/3 seconds after 4 seconds.
Step 2: Calculate the area of the trapezium from 0 to 5 seconds
- The trapezium is formed between the time intervals 0 to 4 seconds and 4 to 5 seconds.
- The height of the trapezium is the velocity at these points.
- The area of a trapezium is given by the formula:
Area=12×(b1+b2)×h
where b1 and b2 are the lengths of the parallel sides (velocities) and h is the height (time interval).
Step 3: Calculate the area of the triangle from 5 to 6 seconds
- The triangle is formed between the time intervals 5 to 6 seconds.
- The area of a triangle is given by the formula:
Area=12×base×height
where the base is the time interval and the height is the velocity.
Step 4: Calculate the total distance
- Add the areas of the trapezium and triangle to find the total distance covered.
Detailed Calculation:
1. Area of the trapezium (0 to 5 seconds):
- From the graph, let's assume:
- Velocity at 0 seconds = 0 m/s
- Velocity at 4 seconds = 4 m/s
- Velocity at 5 seconds = 0 m/s
- The area of the trapezium:
Areatrapezium=12×(0+4)×4=12×4×4=8 m
2. Area of the triangle (5 to 6 seconds):
- From the graph, the velocity decreases to -2 m/s at 6 seconds.
- The base of the triangle = 1 second (from 5 to 6 seconds)
- The height = 2 m/s (magnitude of -2 m/s)
- The area of the triangle:
Areatriangle=12×1×2=1 m
3. Total distance covered:
Total Distance=Areatrapezium+Areatriangle=8+1=9 m
Final Answer:
The total distance covered by the body in 6 seconds is 9 meters.
- The graph shows the velocity of the body at different time intervals. We need to break down the graph into segments to calculate the area under the curve for each segment.
- The point S is at 4.333 seconds, which is approximately 1/3 seconds after 4 seconds.
- The trapezium is formed between the time intervals 0 to 4 seconds and 4 to 5 seconds.
- The height of the trapezium is the velocity at these points.
- The area of a trapezium is given by the formula:
Area=12×(b1+b2)×h
where b1 and b2 are the lengths of the parallel sides (velocities) and h is the height (time interval).
- The triangle is formed between the time intervals 5 to 6 seconds.
- The area of a triangle is given by the formula:
Area=12×base×height
where the base is the time interval and the height is the velocity.
- Add the areas of the trapezium and triangle to find the total distance covered.
1. Area of the trapezium (0 to 5 seconds):
- From the graph, let's assume:
- Velocity at 0 seconds = 0 m/s
- Velocity at 4 seconds = 4 m/s
- Velocity at 5 seconds = 0 m/s
- The area of the trapezium:
Areatrapezium=12×(0+4)×4=12×4×4=8 m
- From the graph, the velocity decreases to -2 m/s at 6 seconds.
- The base of the triangle = 1 second (from 5 to 6 seconds)
- The height = 2 m/s (magnitude of -2 m/s)
- The area of the triangle:
Areatriangle=12×1×2=1 m
Total Distance=Areatrapezium+Areatriangle=8+1=9 m
The total distance covered by the body in 6 seconds is 9 meters.
Topper's Solved these Questions
Similar Questions
Knowledge Check
The velocity-time graph of a body in motion is a straight line inclined to the time axis. The correct statement is :
Avelocity is uniformBacceleration is uniformCboth velocity and acceleration are uniformDneither velocity nor acceleration is uniform.
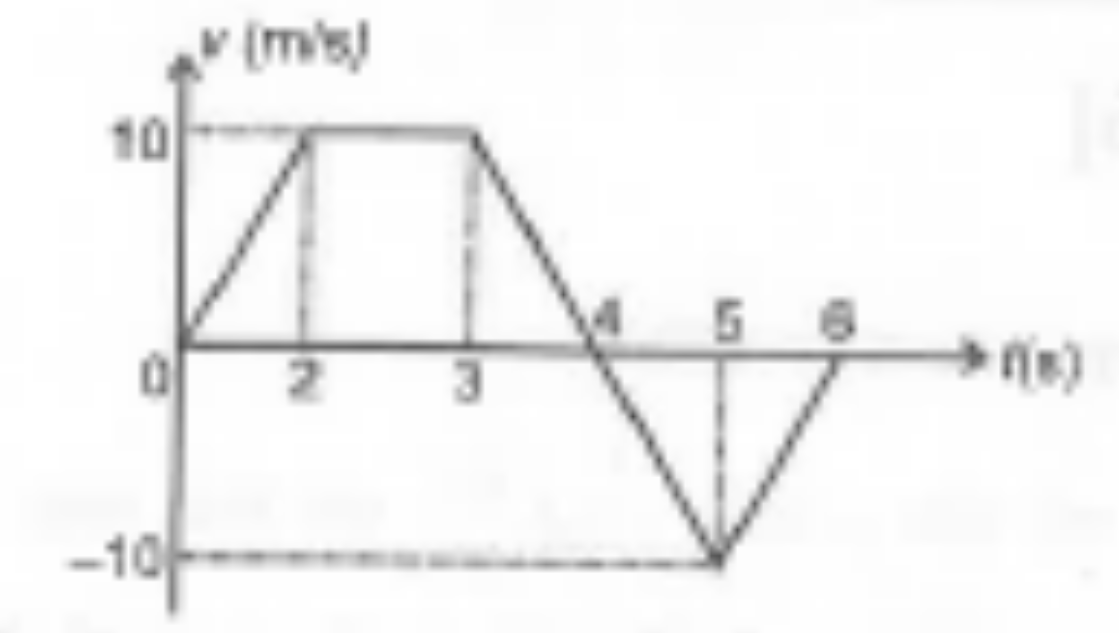
The velocity (v)-time (t) graph of a partide moving along a straight line is as shown in the figure. The displacement of the particle from t = 0 to t = 4 is
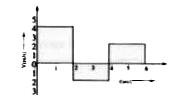
View SolutionThe velocity time graph of a body moving in a straight line is shown in the figure. The displacement and distance travelled by the body in 6 sec are respectively.
View SolutionThe velocity and time graph for a particle moving in a straight line s shown in the figure. Then, the average velocity between t=4 s and t=6 s is _____
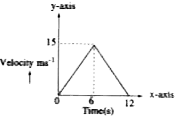
View Solution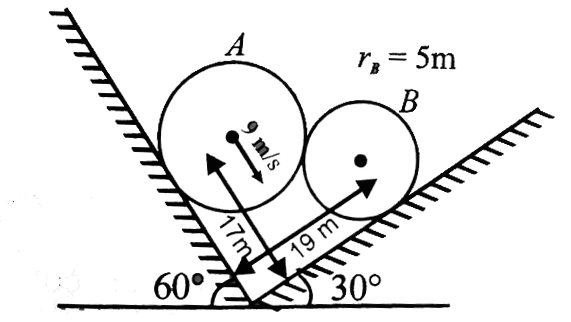
System is shown in the figure. Velocity of sphere A is 9 ms. Find the speed of sphere B.
View SolutionThe velocity time graph of a linear motion is shown in the figure. The distance from the starting point after 8 seconds will be
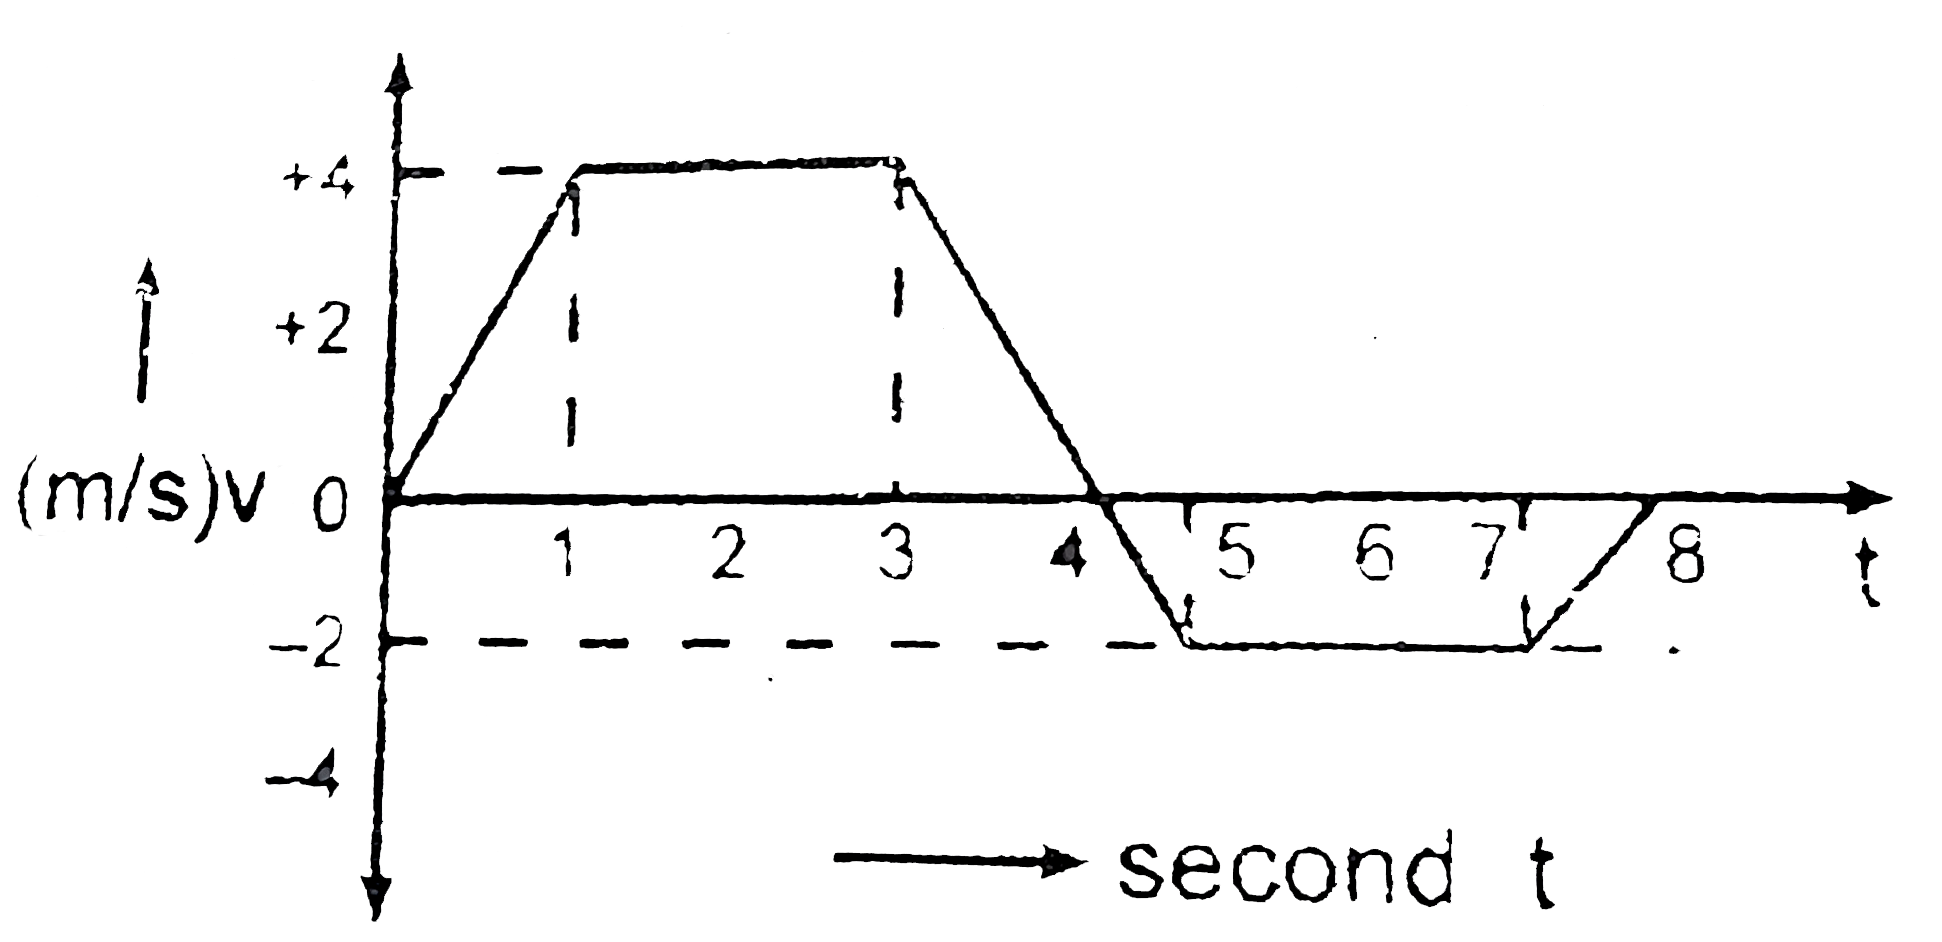 .
.
View SolutionThe velocity - time graph of a particle moving along a straight line is shown in the figure given below
The displacement of the particle in 5 second is
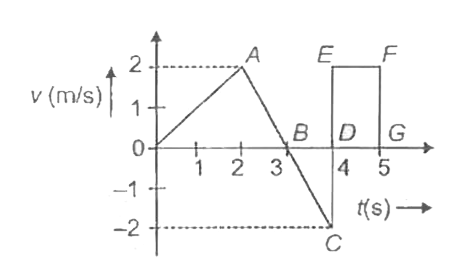
View SolutionThe speed - time graph for a body moving along a straight line is shown in figure. The average acceleration of body may be
View Solution

