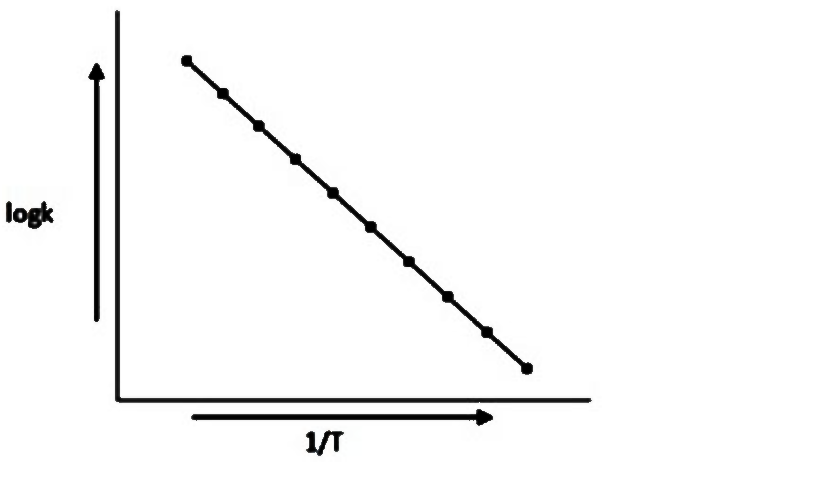
If graph log K→1T is plotted ,a straight line is obtained then what will be value of slope ?
Ea2.303R
−E3.203R
−2.303REa
−Ea2.303R
The correct Answer is:D
Topper's Solved these Questions
- CHEMICAL KINETICSBook:KUMAR PRAKASHANChapter:CHEMICAL KINETICSExercise:Section-E(MCQs asked in JEE/NEET/AIEEE)
Explore 34 Videos
- BOARD EXAM QUESTION PAPER MARCH - 2020 Book:KUMAR PRAKASHANChapter:BOARD EXAM QUESTION PAPER MARCH - 2020 Exercise:PART -B
Explore 23 Videos
- CHEMISTRY IN EVERYDAY LIFEBook:KUMAR PRAKASHANChapter:CHEMISTRY IN EVERYDAY LIFEExercise:SECTION - E (MCQs ASKED IN GUJCET/BOARD EXAM)
Explore 37 Videos
Similar Questions
Knowledge Check
According to Moseley, a straight line graph is obtained on plotting:
Athe frequencioes of characteristic line graphBthe square of the frequencies of characteristic X-rays of elements against their atomic numbersCthe square root of the frequencies of characteristis X-rays of elements against their atomic numbers.Dthe reciprocal of the frequencies of characteristic X-rays of elements against their atomic numbersRate constant k of a reaction varies with temperature according to the equation, log k = constant -Ea2.303RT When a graph is plotted for logk versus 1/T a straight line with a slope -5632 is obtained. The energy of activation for this reaction is
A127.67 kJ mol−1B107.84 kJ mol−1C86 kJ mol−1D246.8 kJ mol−1When loge k is plotted against 1T using the Arrhenius equation a straight line is expected with a slope equal to ,
AEaRB−EaRC−Ea2.303RD−REa
When a plot between logk and 1/T is plotted we get the graph as shown.

What is the value of slope in the graph?
View SolutionWhen a plot between logk and 1/T is plotted we get the graph as shown.

What is the value of slope in the graph?
View SolutionThe rate constant 'k'. For a reaction varies with temperature 'T' according to the question. logk=logA−Ea2.303R(1T)
Where Ea is the activation energy. When a graph is plotted for logkvs1/T, a straight line with a slope of −4250 K is obtained. Calcualte Ea for this reaction.
View SolutionThe graph between the log K versus 1T is a straight line. The slope of the line is
View SolutionFor the order reaction , plot of log10(a−x) against time t is a straight line with a negative slope equal to ________.
View Solution
