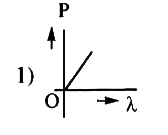
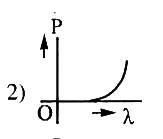
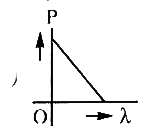
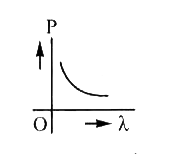
Which of the following figures represents the variation of particle momentum and associated de-Broglie wavelengthSolution in Telugu


The correct Answer is:D
Step by step video, text & image solution for Which of the following figures represents the variation of particle momentum and associated de-Broglie wavelength by Physics experts to help you in doubts & scoring excellent marks in Class 12 exams.
Updated on:21/07/2023Topper's Solved these Questions
- DUAL NATURE OF RADIATION AND MATTERBOOK - AAKASH SERIESCHAPTER - DUAL NATURE OF RADIATION AND MATTEREXERCISE - PRACTICE EXERCISEX
44 Videos
- DUAL NATURE OF RADIATION AND MATTERBOOK - AAKASH SERIESCHAPTER - DUAL NATURE OF RADIATION AND MATTEREXERCISE - EXERCISE-I ASSERTION AND REASON
4 Videos
- CURRENT ELECTRICITYBOOK - AAKASH SERIESCHAPTER - CURRENT ELECTRICITYEXERCISE - EXERCISE - III
73 Videos
- ELECTRIC CHARGES AND FIELDSBOOK - AAKASH SERIESCHAPTER - ELECTRIC CHARGES AND FIELDSEXERCISE - Practice Exercise
57 Videos
Similar Questions
Two separate monochromatic light beams A and B of the same intensity are falling normally on a unit area of a metallic surface. Their wave lengths are λA and λB, respectively. Assuming that all the incident light is used in ejecting the photoelectrons the ratio of the photoelectrons from the beam A to that from B is :
View Solution(A) : Photoemission of electrons from a photosensitive surface is possible only if the incident radiation has a frequency above threshold frequency
(R): Unless the hv>hv0 = work function of metals, no photoemission of electrons is possible
View SolutionIn a hydrogen tube it is observed that through a given cross-section 3.13×10¹⁵ electrons persec. moving from right to left and 3.12×10¹⁵ protons per sec are moving from left to right. The electric current in the discharge tube and its direction is
View SolutionWat is the charge acquired by a body when one million electrons are transferred to it.
View SolutionWhich of the following graphs correctly represents the variation of particle momentum with associated de Broglie wavelength?
View SolutionWhich of the following figure represents the variation of particle momentum and the associated de - Broglie wavelength ?
View SolutionWhich of following graphs correctly represents the variation of particle momentum with de-Broglie wavelength?
View SolutionWhich of the following figures represent the variation of particle momentum and the associated de Broglie wavelength?
View SolutionWhich of the following figure represents the variation of particle momentum and the associated de - Broglie wavelength ?
View SolutionRepresent graphically Variation of the de-Broglie wavelenght with linear momentum of a particle.
View SolutionThe wavelength of de-Broglie wave associated with a matter particle is 2Å. The momentum of the particle is
View SolutionWhich of the following graph represent the variation of particle momentum and associated de Broglie wavelength?
View SolutionWhich of following graphs correctly represents the variation of particle momentum with de-Broglie wavelength?
View SolutionWhich of the following figure represents the variation of particle momentum and the associated de - Broglie wavelength ?
View SolutionWhich of the following graph represent the variation of particle momentem and the associated de Broglie wavelength
View Solution
