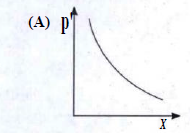
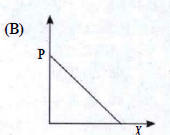
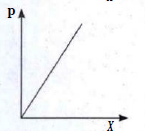
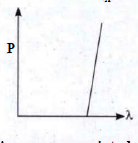
Which of the following graph represent the variation of particle momentem and the associated de Broglie wavelengthSolution in Marathi
:
:
:
:
Step by step video & image solution for Which of the following graph represent the variation of particle momentem and the associated de Broglie wavelength by Physics experts to help you in doubts & scoring excellent marks in Class 12 exams.
Updated on:21/07/2023Topper's Solved these Questions
- Dual Nature of Radiation and MatterBOOK - CHETANA PUBLICATIONCHAPTER - Dual Nature of Radiation and MatterEXERCISE - EXERCISE
89 Videos
- Current ElectricityBOOK - CHETANA PUBLICATIONCHAPTER - Current ElectricityEXERCISE - Exercise
92 Videos
- Electromagnetic InductionBOOK - CHETANA PUBLICATIONCHAPTER - Electromagnetic InductionEXERCISE - EXERCISE
109 Videos
Similar Questions
Determine frequency and wavelength of a photon having energy 1.3eW.
View Solution(1)In the following circuit, calculate the value of the current (I).
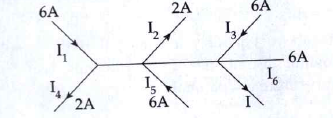
View SolutionA magnetic flux associated with a coil changes by 5×10⁻² Wb in 25 second. Find the emf induced in the coil.
View SolutionWhich of the following graphs correctly represents the variation of particle momentum with associated de Broglie wavelength?
View SolutionWhich of the following figure represents the variation of particle momentum and the associated de - Broglie wavelength ?
View SolutionWhich of following graphs correctly represents the variation of particle momentum with de-Broglie wavelength?
View SolutionThe de Broglie wavelength associated with particle is
View SolutionWhich of the following figures represent the variation of particle momentum and the associated de Broglie wavelength?
View SolutionThe de-Broglie wavelength 1 associated with an elementary particle of linear moemntum, p is best represented by the graph.
View SolutionThe de-Broglie wavelength L associated with an elementary particle of linear momentum p is bets represented by the graph
View SolutionWhich of the following graph represent the variation of particle momentum and associated de Broglie wavelength?
View SolutionWhich of following graphs correctly represents the variation of particle momentum with de-Broglie wavelength?
View SolutionWhich of the following figures represents the variation of particle momentum and associated de-Broglie wavelength
View SolutionWhich of the following figure represents the variation of particle momentum and the associated de - Broglie wavelength ?
View SolutionWhich of the following figure represents the variation of particle momentum (P) and associated de Broglie wavelength (lambda) ?
View Solution
