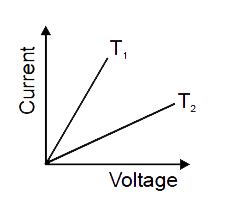
A carbon resistor is used in a circuit, at different constant temperatures, T1 and T2(T1>T2) for different voltages. Which of the following graphs are correct ? [ i is the current through the resistor, V is the voltage applied across it]
A

B

C
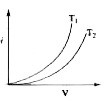
D

Text Solution
The correct Answer is:A
|
Topper's Solved these Questions
- CURRENT ELECTRICITYBOOK - AAKASH SERIESCHAPTER - CURRENT ELECTRICITYEXERCISE - LECTURE SHEET (EXERCISE- II LEVEL- II (ADVANCED) (Linked Comprehension Type Questions))
2 Videos
- CURRENT ELECTRICITYBOOK - AAKASH SERIESCHAPTER - CURRENT ELECTRICITYEXERCISE - LECTURE SHEET (EXERCISE- II LEVEL- II (ADVANCED) (Matrix Matching Type Questions))
1 Videos
- CURRENT ELECTRICITYBOOK - AAKASH SERIESCHAPTER - CURRENT ELECTRICITYEXERCISE - LECTURE SHEET (EXERCISE- II LEVEL-I (MAIN) (Straight Objective Type Questions))
14 Videos
- CURRENT ELECTRICITYBOOK - AAKASH SERIESCHAPTER - CURRENT ELECTRICITYEXERCISE - PROBLEMS (LEVEL-II)
26 Videos
- DUAL NATURE OF RADIATION AND MATTERBOOK - AAKASH SERIESCHAPTER - DUAL NATURE OF RADIATION AND MATTEREXERCISE - PRACTICE EXERCISEX
44 Videos
Similar Questions
Knowledge Check
The current I and voltage V variations for a given metallic wire at tow different temperature T1andT2 are shown in the figure. Then which one of the following is correct
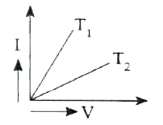 AT1>T2BT1<T2CT1=T2DT1=2T2
The current (I) and voltage (V) graphs for a given metallic wire at two different temperature (T1) and (T2) are shown in fig. It is concluded that
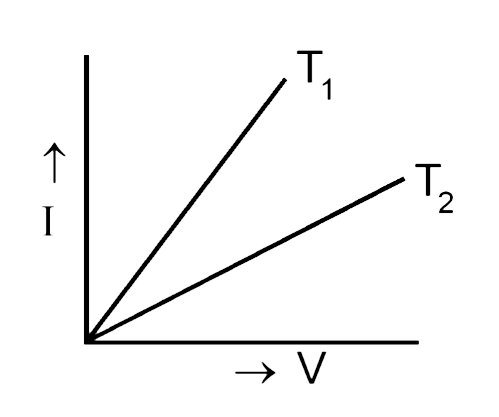 AT1=T2BT1>T2CT1<T2DNone of these
The current in a metallic conductor is plotted against voltage at two different temperatures T1 and T2. Which is correct
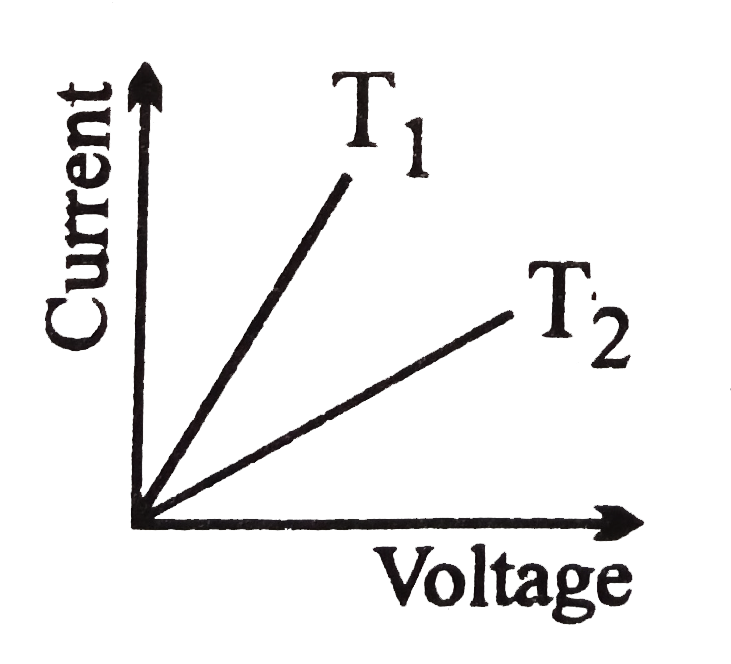 AT1>T2BT1<T2CT1=T2Dnone
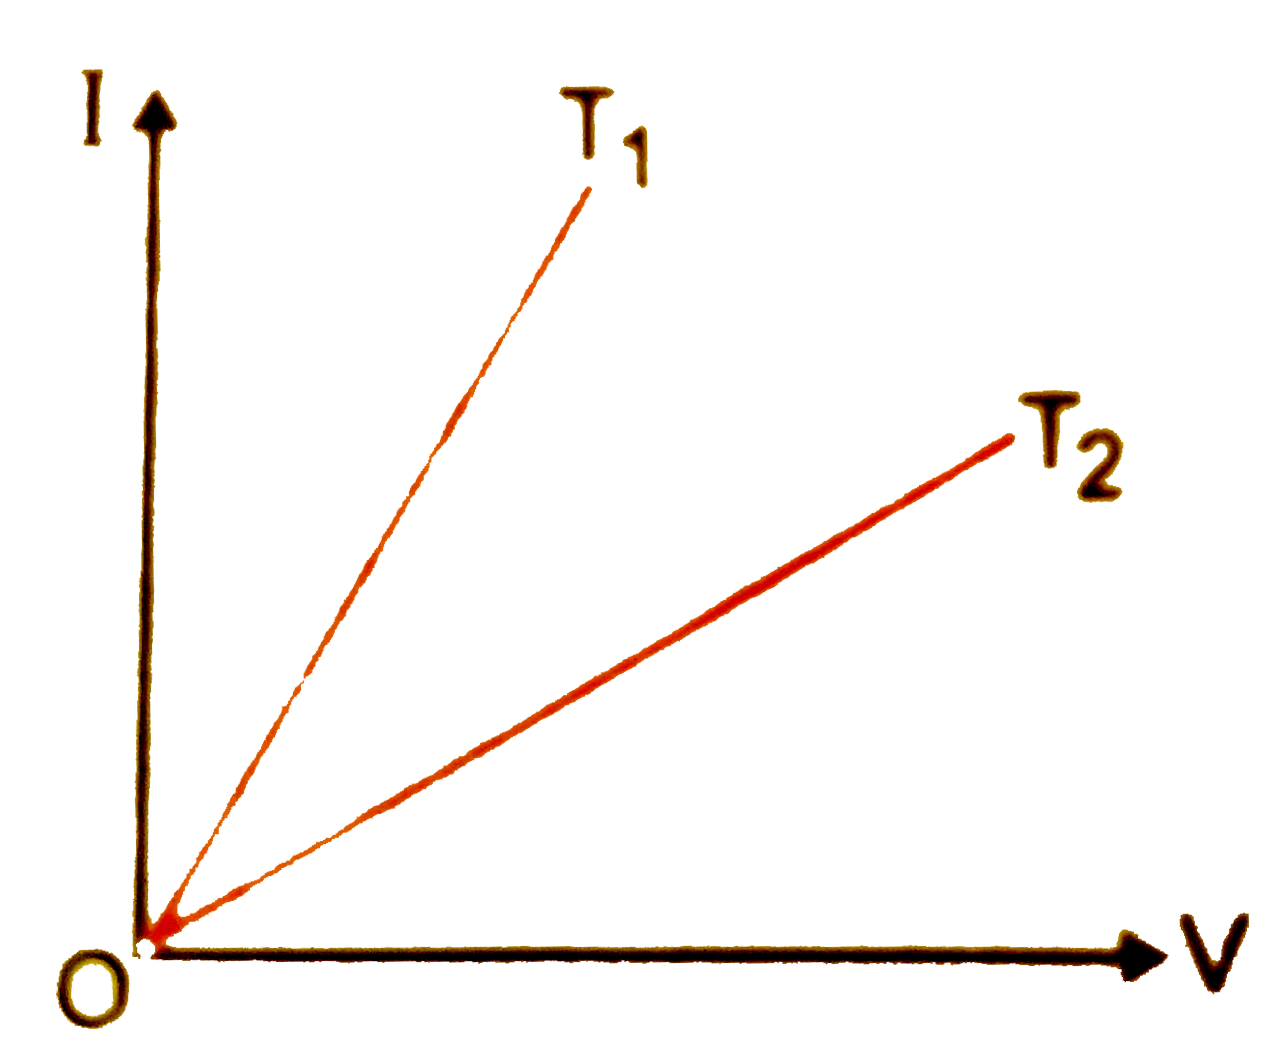
I-V graph for a metallie wire at two different tempearture, T1andT2 is as shown in the figure. Which of the two temperatures is lower and why ?

View SolutionI-V graph for a metallie wire at two different tempearture, T1andT2 is as shown in the figure. Which of the two temperatures is lower and why ?

View SolutionThe current in a metallic conductor is plotted against voltage at two different temperatures T1 and T2. Which is correct

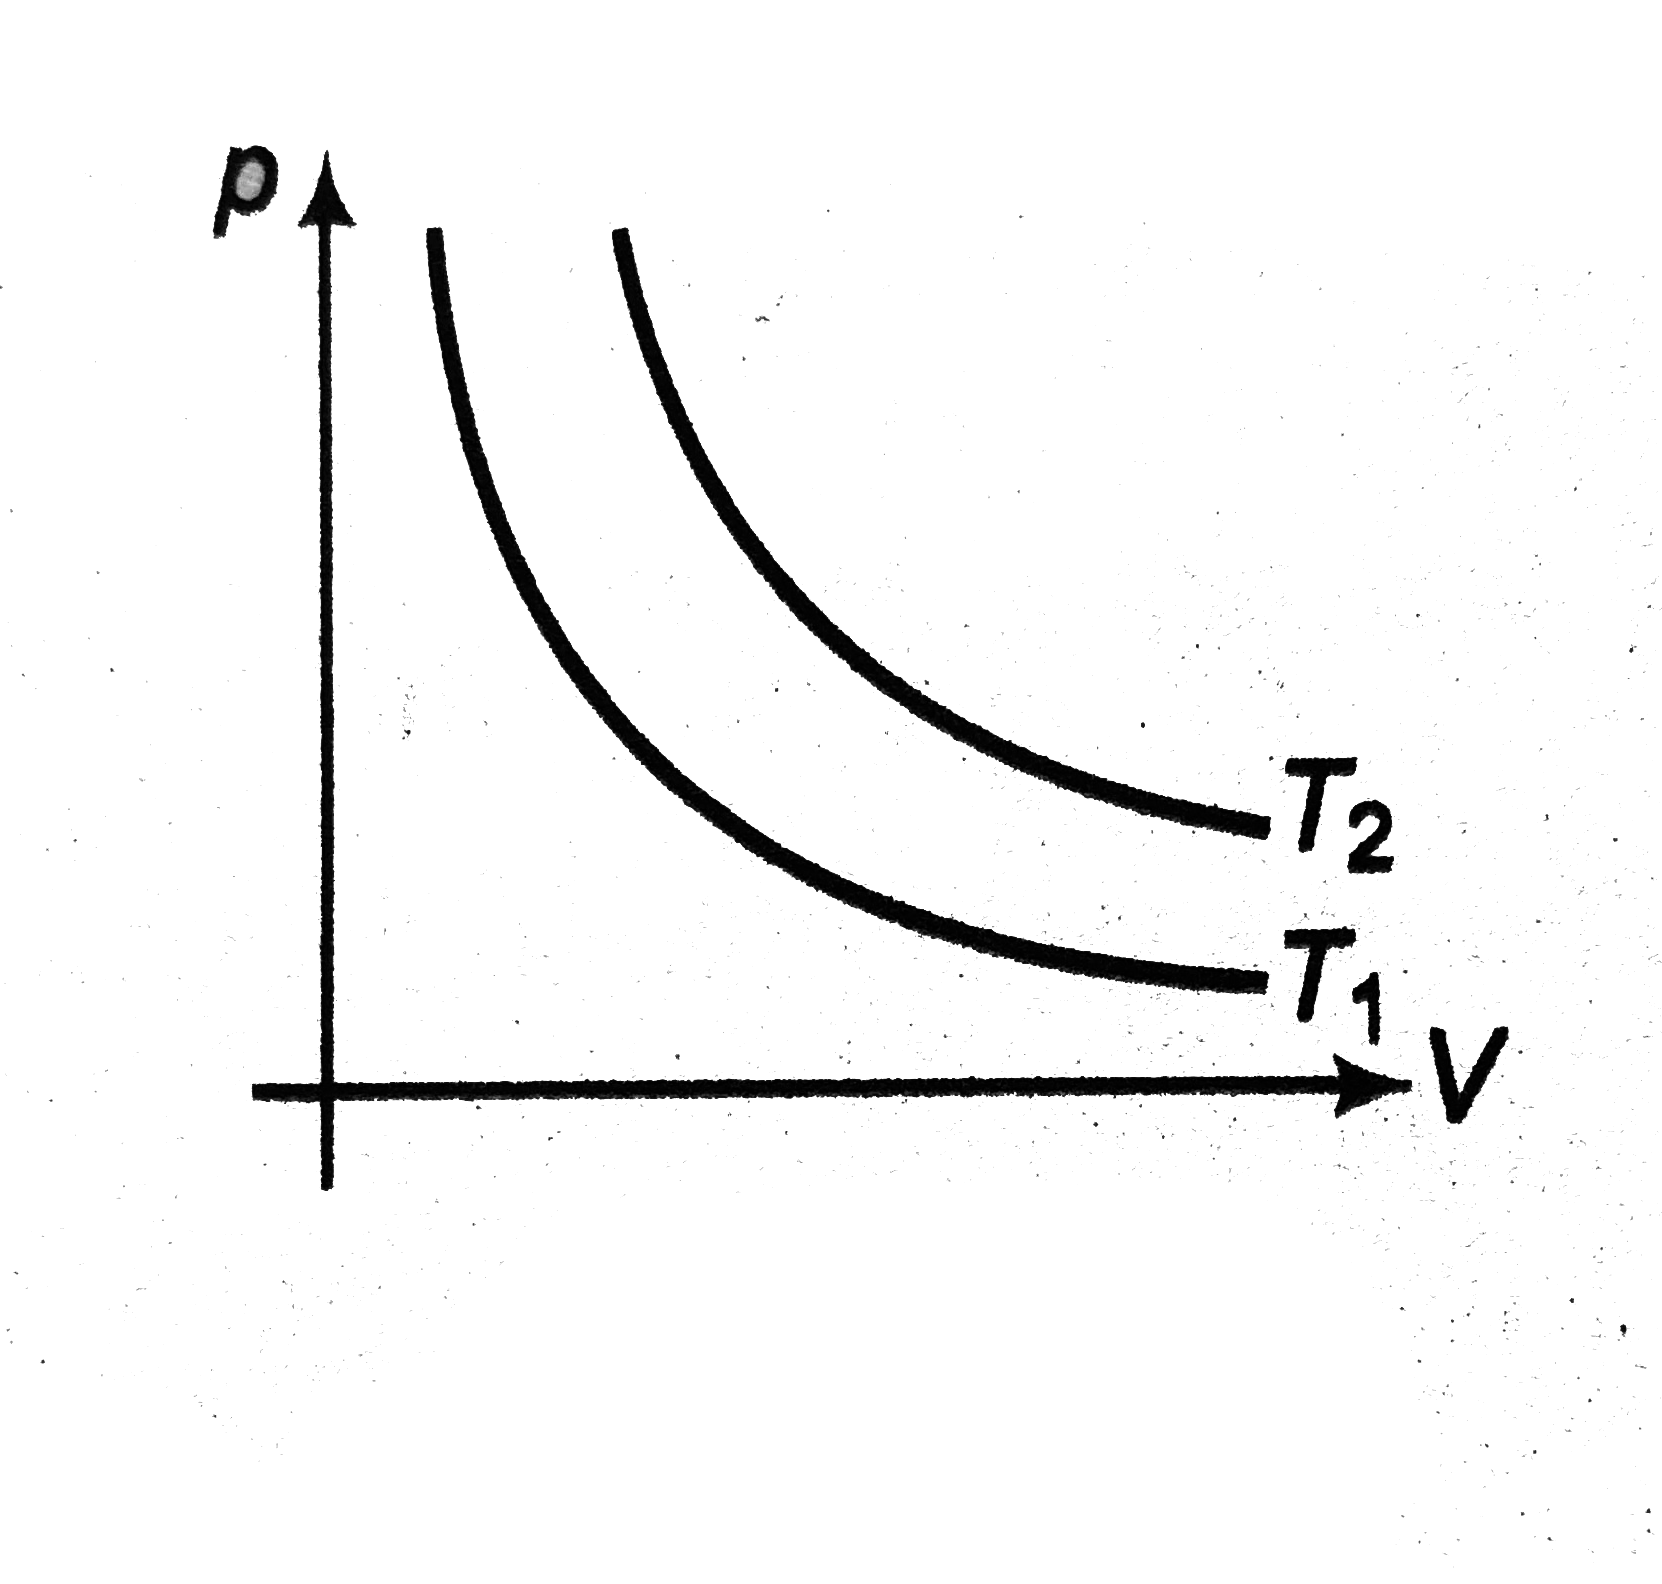
View Solutionp−V diagram of same mass of a gas are drawn at two different temperatures (T1) and (T2). Explain whether T1>T2orT2>T1.
 .
.
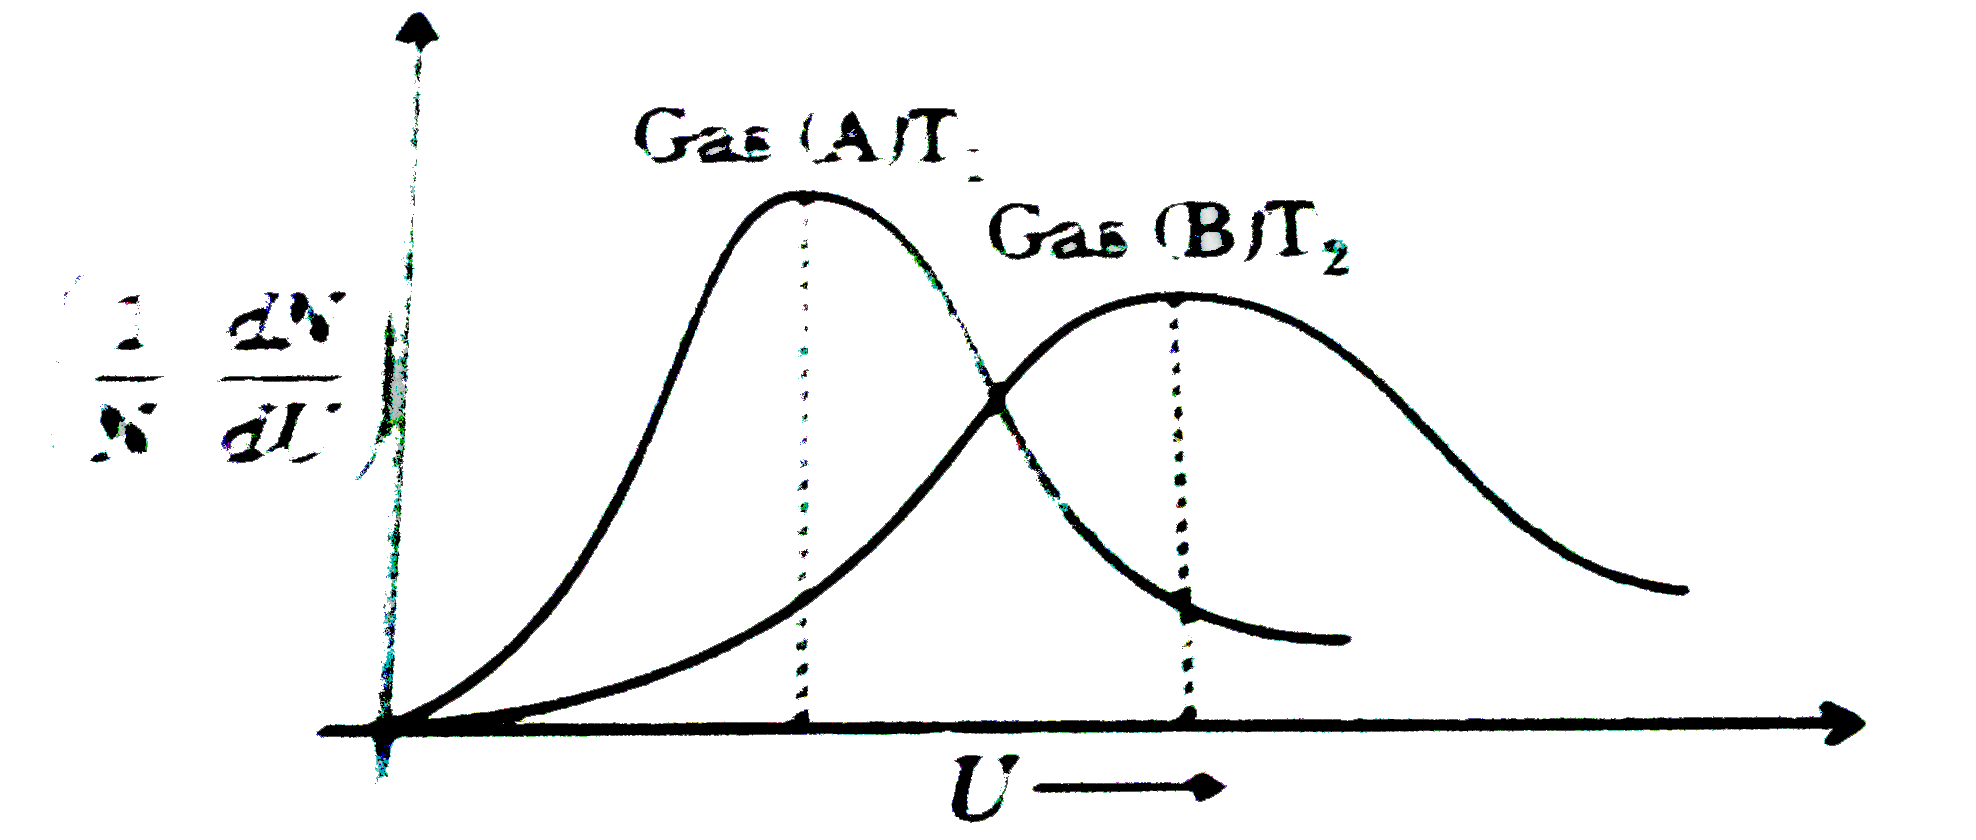
View SolutionFor the following graph, drawn from two different samples of gases at two different temperatures T1andT2, which of the following statements is/are necessarily true?
View Solution

