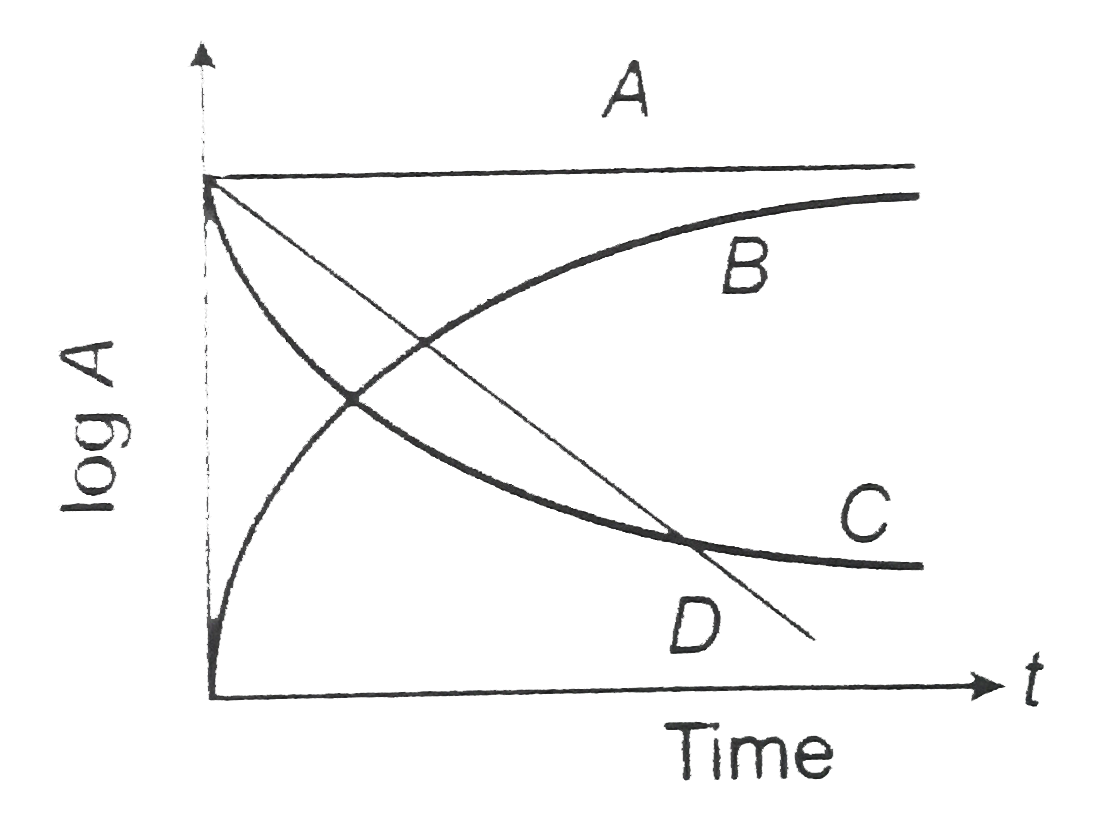
At time t = 0, some radioactive gas is injected into a sealed vessel. At time T, some more of the same gas is injected into the same vessel. The graph representing the variation of the logarithm of the activity A of the gas with time t is.


The correct Answer is:B
Topper's Solved these Questions
- NUCLEAR PHYSICSBOOK - AAKASH SERIESCHAPTER - NUCLEAR PHYSICSEXERCISE - ADDITIONAL PRACTICE LEVEL-II (LECTURE SHEET (ADVANCED)) More than one correct answer Type Questions )
4 Videos
- NUCLEAR PHYSICSBOOK - AAKASH SERIESCHAPTER - NUCLEAR PHYSICSEXERCISE - ADDITIONAL PRACTICE LEVEL-II (LECTURE SHEET (ADVANCED)) Linked Comprehension Type Questions Passage-I :)
2 Videos
- NUCLEAR PHYSICSBOOK - AAKASH SERIESCHAPTER - NUCLEAR PHYSICSEXERCISE - ADDITIONAL PRACTICE EXERCISE (LEVEL-I (MAIN)) (Straight Objective Type Questions)
10 Videos
- MOVING CHARGES AND MAGNETISMBOOK - AAKASH SERIESCHAPTER - MOVING CHARGES AND MAGNETISMEXERCISE - EXERCISE-III
45 Videos
- NUCLEIBOOK - AAKASH SERIESCHAPTER - NUCLEIEXERCISE - Practice Exercise
40 Videos
Similar Questions
At time t=0, some radioactive gas is injected into a sealed vessel. At time T, some more of the same gas is injected into the same vessel. Which one of the following graphs best represents the variation of the logarithm of the activity A of the gas with time t?
View SolutionThe graph shown the variation with times t of the velocity v of an object . Which one of the following graphs best represents the variation of acceleration a of the object with time t?

View Solution
Knowledge Check
At time t=0, some radioactive gas is injected into a sealed vessel. At time T, some more of the same gas is injected into the same vessel. Which one of the following graphs best represents the variation of the logarithm of the activity A of the gas with time t?
A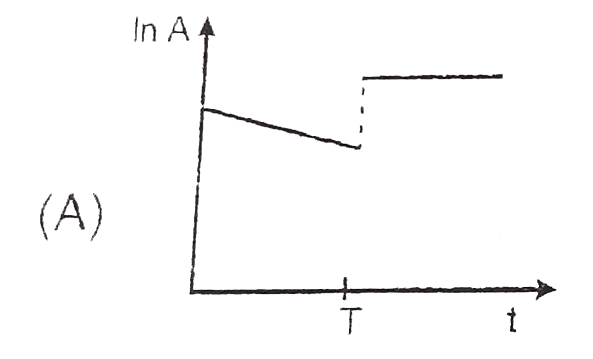 B
B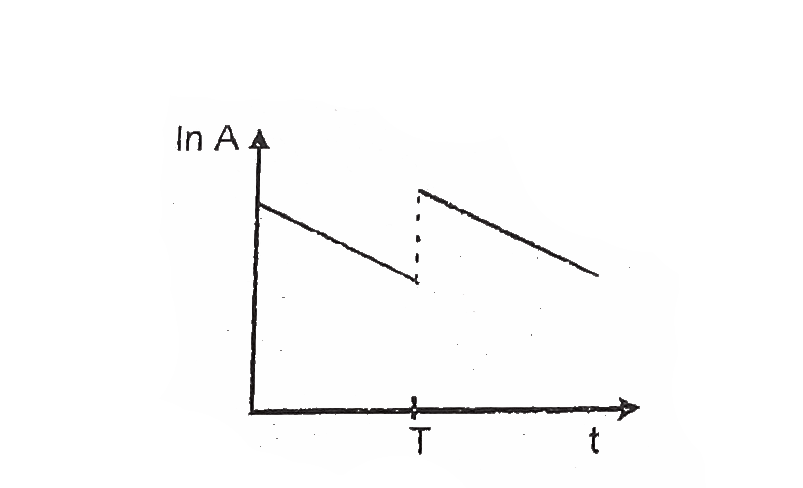 C
C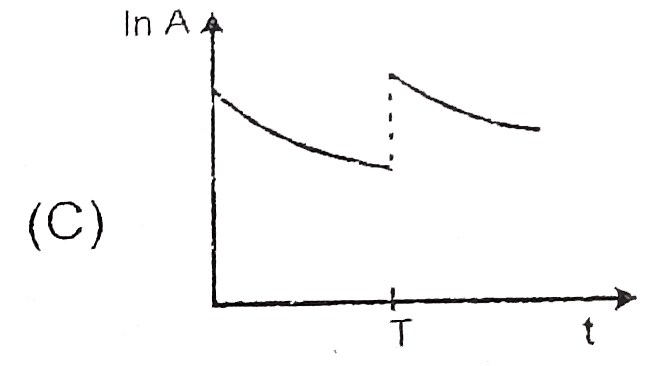 D
D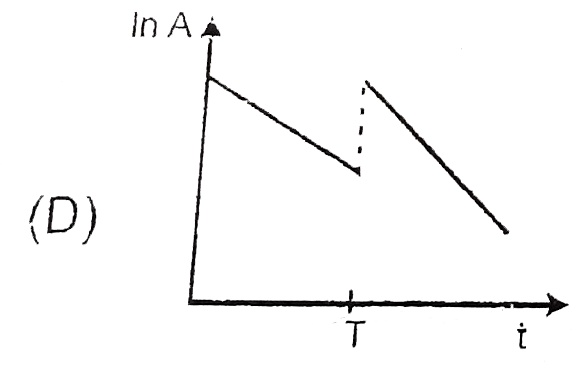
At time t=0, some radioactive gas is injected into a sealed vessel. At time T, some more of the same gas is injected into the same vessel. Which one of the following graphs best represents the variation of the logarithm of the activity A of the gas with time t?
A B
B C
C D
D
The graph which represents the correct variation of logarithm of activity (log A) versus time, in figure is.
 .AABBCCDD
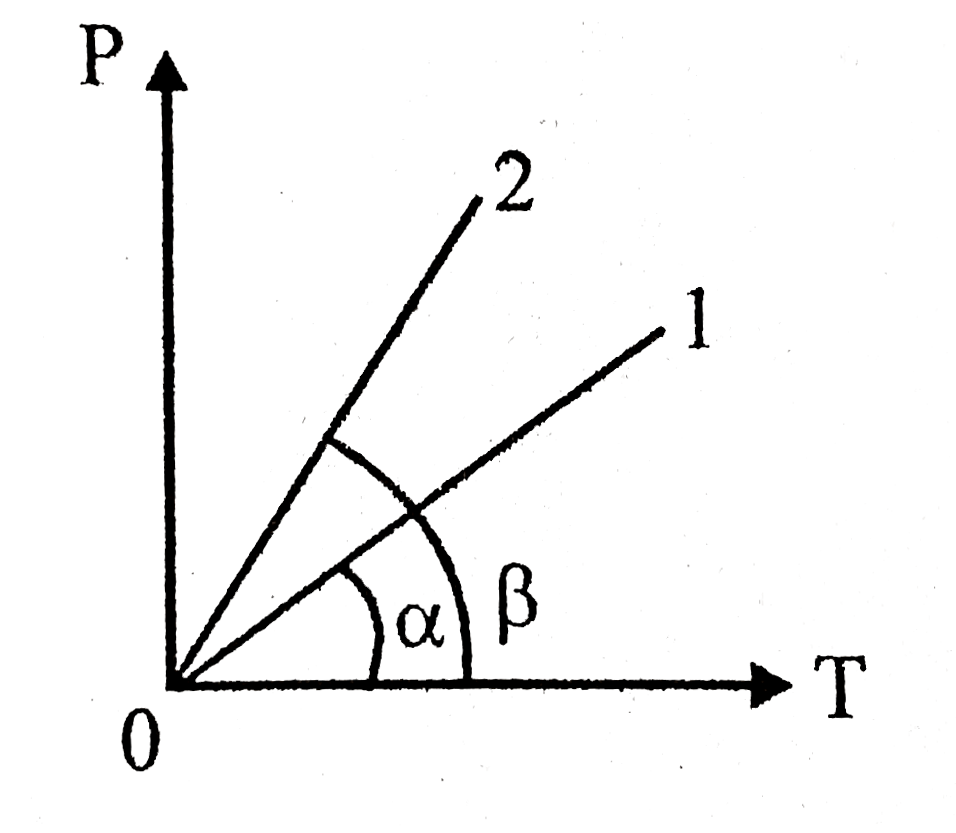
A certain mass of a gas was heated in a constant volume vessel, its P-T curve is 1, similarly alnother mass of the gas was heated in the same vessel , its P-T curve is 2. if tan β=2 tan α what is the ratio of masses of gas in the two experiments?
View SolutionWhich of the following graphs represents the variation of activity (A) of a radioactive substance with time (t).
View SolutionThe graph shown the variation with times t of the velocity v of an object . Which one of the following graphs best represents the variation of acceleration a of the object with time t?

View SolutionTwo vessels of the same volume contain the same gas at same temperature. If the pressure in the vessels is in the ratio of 1 : 2, then
View SolutionAt a constant pressure, of the following graphs that one which represents the variation of the density of an ideal gas with the absolute temperature T, is
View Solution
