The temperature of water in calorimeter is θ and the temperature of surrounding is θc(<θ). Observation are recorded for temperature difference (θ−θ0) and time t. The cooling curve is best represented in graph.


The correct Answer is:C
Topper's Solved these Questions
- PRACTICAL PHYSICSBOOK - AAKASH SERIESCHAPTER - PRACTICAL PHYSICSEXERCISE - LECTURE SHEET LEVEL-II (ADVANCED) Straight Objective Type Questions
22 Videos
- PRACTICAL PHYSICSBOOK - AAKASH SERIESCHAPTER - PRACTICAL PHYSICSEXERCISE - LECTURE SHEET LEVEL-II (ADVANCED) Linked Comprehension Type Questions
6 Videos
- PHYSICAL WORLDBOOK - AAKASH SERIESCHAPTER - PHYSICAL WORLDEXERCISE - Exercise -I
10 Videos
- RAY OPTICSBOOK - AAKASH SERIESCHAPTER - RAY OPTICSEXERCISE - PROBLEMS ( LEVEL-II)
50 Videos
Similar Questions
Themperature of a body θ is slightly more than the temperature of the surrounding θ0 its rate of cooling (R) versus temperature of body (θ) is plotted its shape would be .
View SolutionA liquid in a beaker has temperature θ(t) at time t and θ0 is temperature of surroundings, then according to Newton's law of cooling the correct graph between loge(θ−θ0) and t is :
View Solution
Knowledge Check
If the temperature of the body θ and time of cooling 't' and room temperature of the surrounding θ0. The cooling curve is
A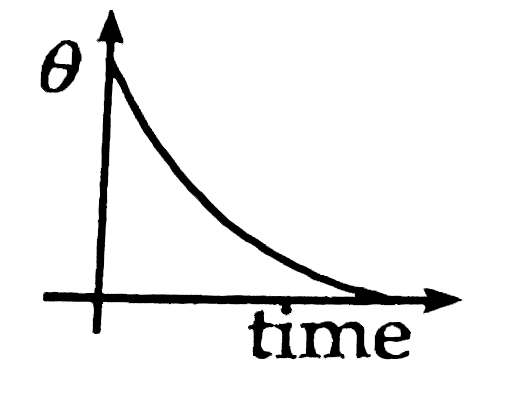 B
B C
C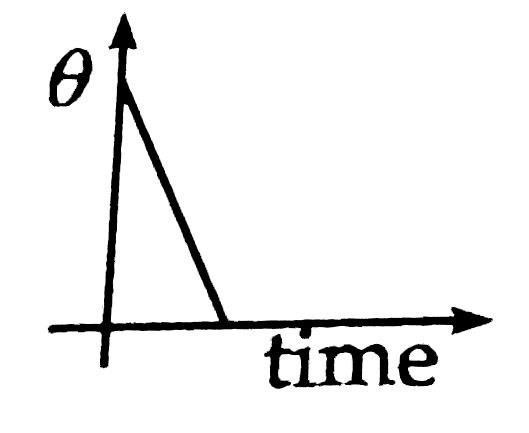 D
D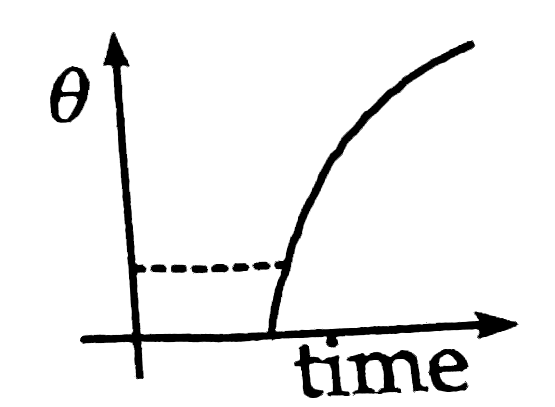
Themperature of a body θ is slightly more than the temperature of the surrounding θ0 its rate of cooling (R) versus temperature of body (θ) is plotted its shape would be .
A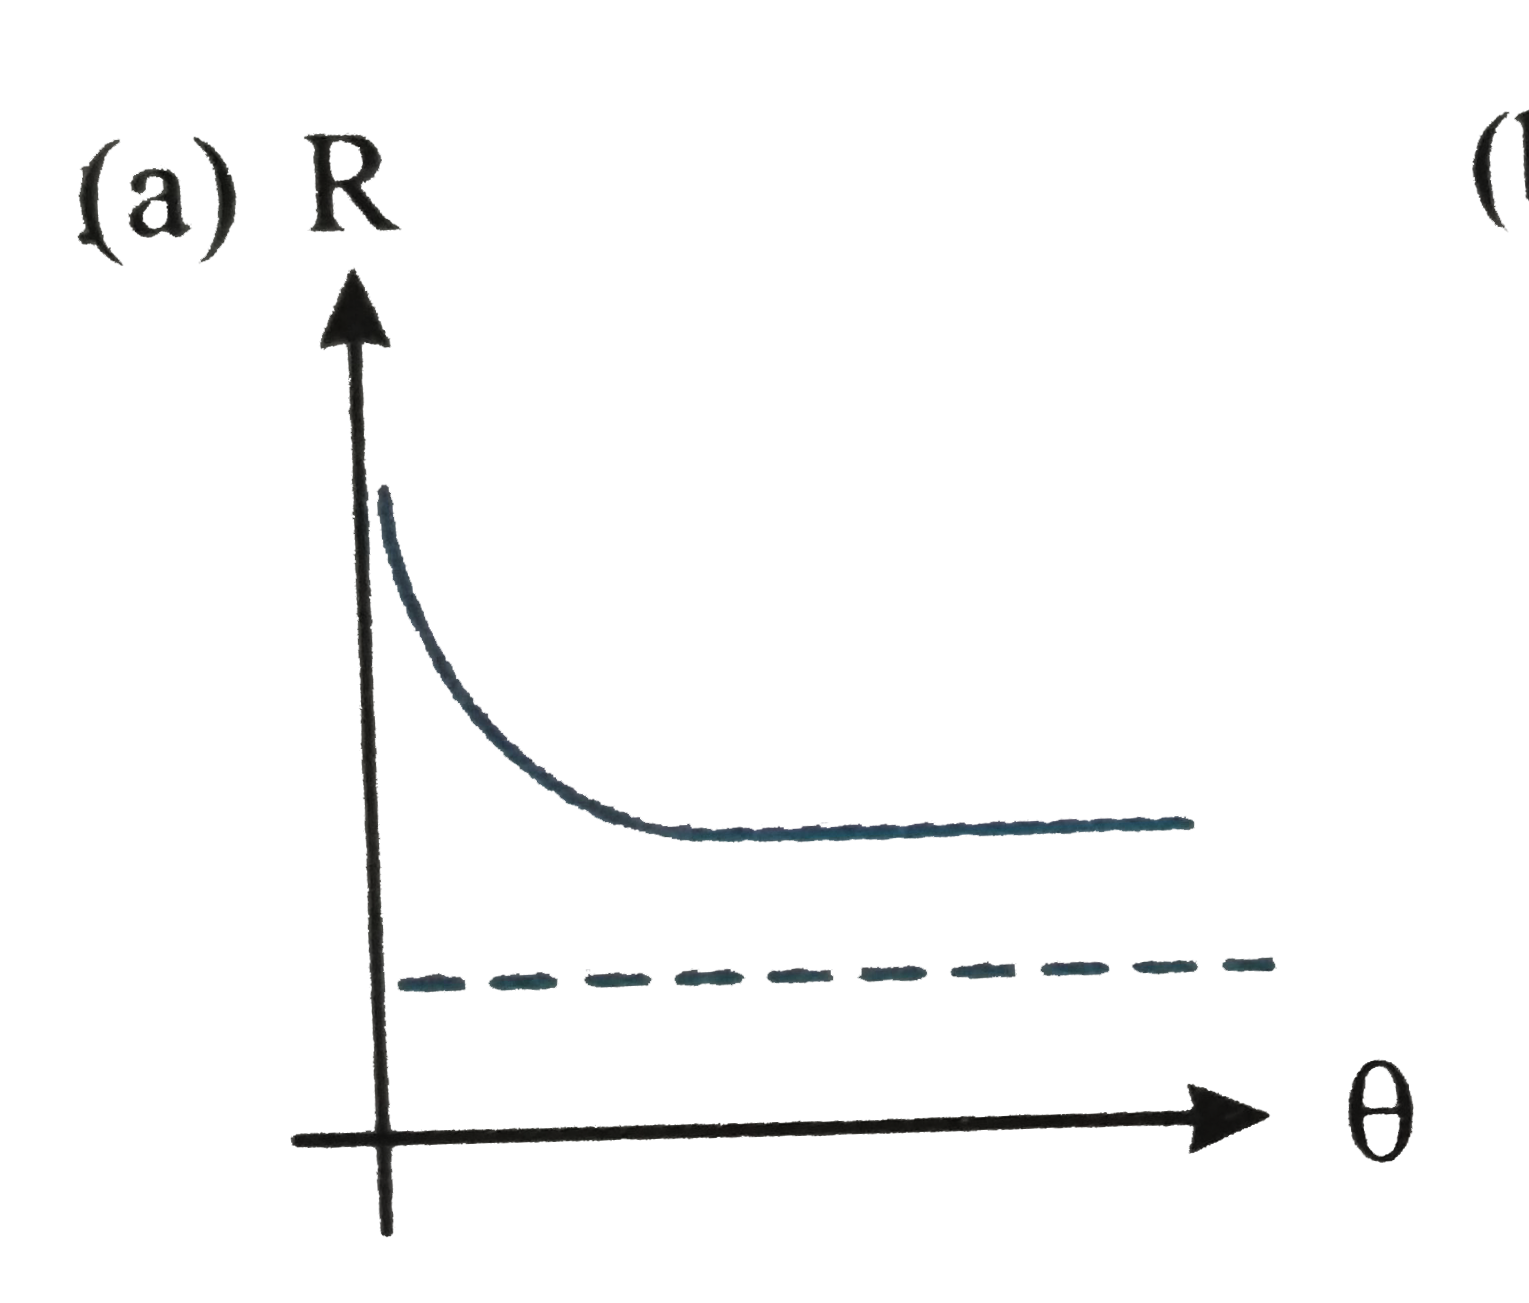 B
B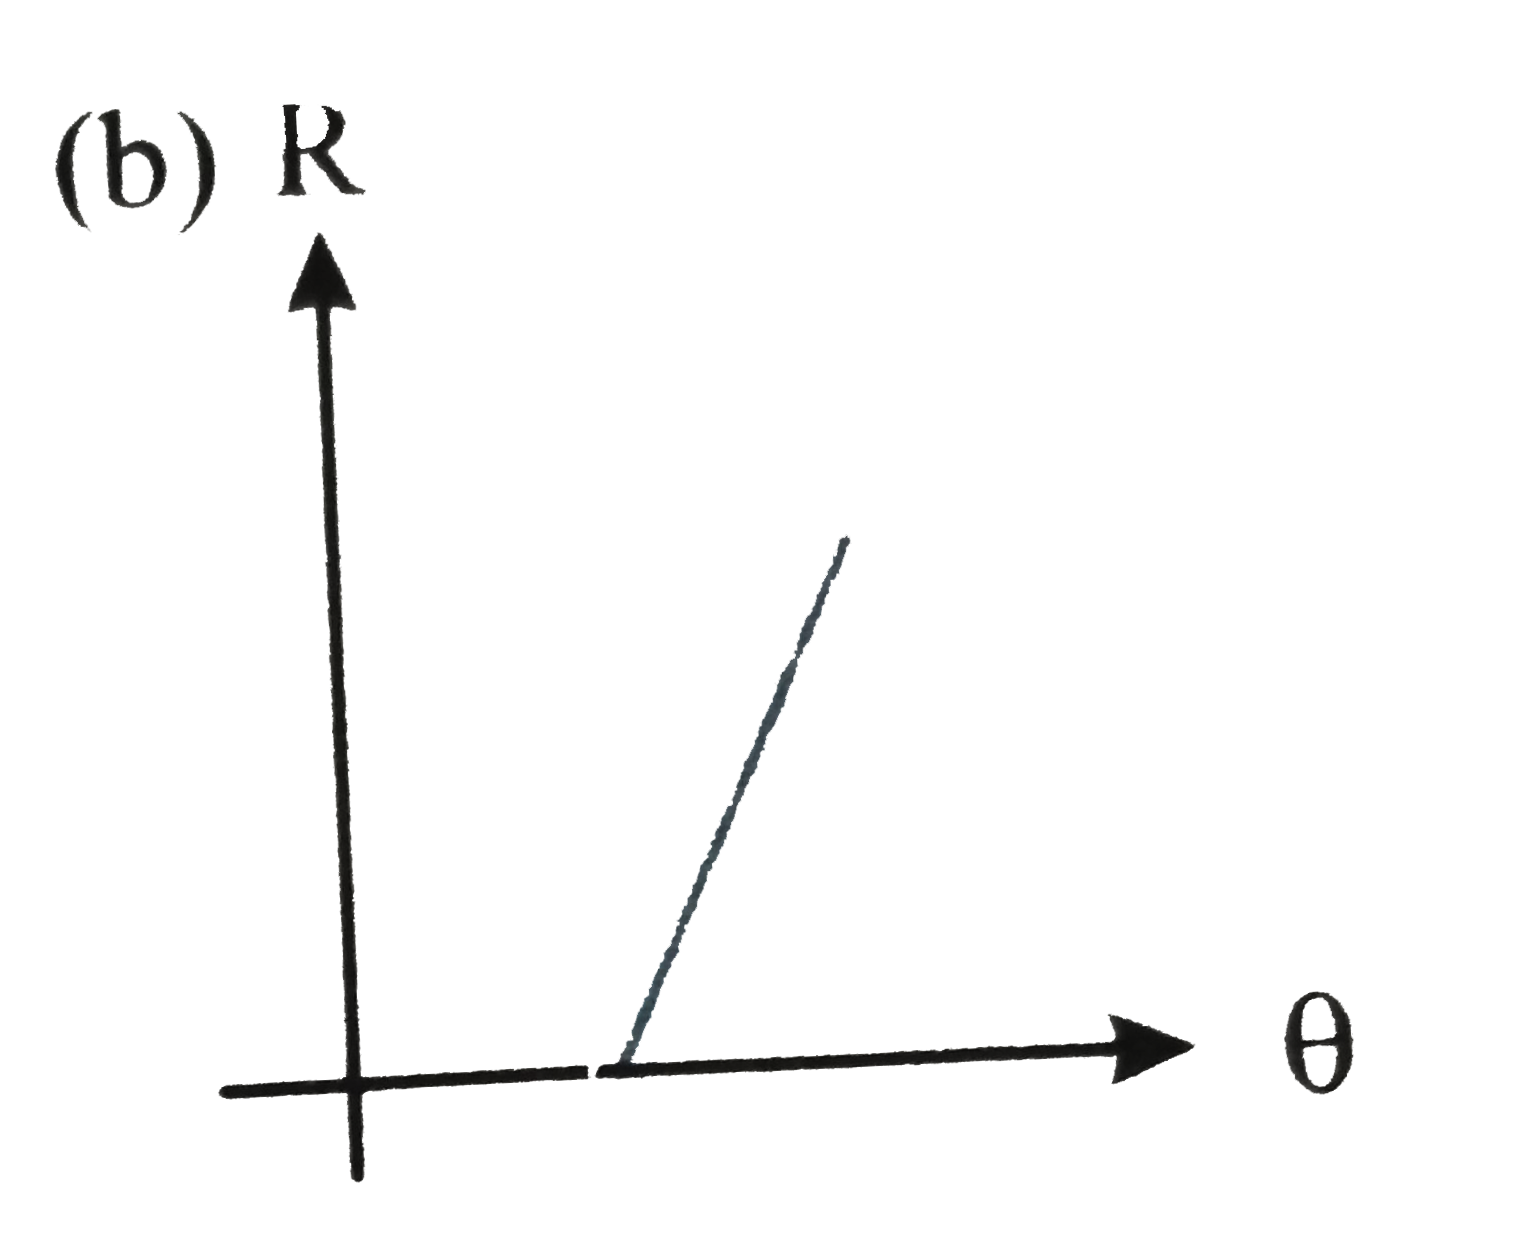 C
C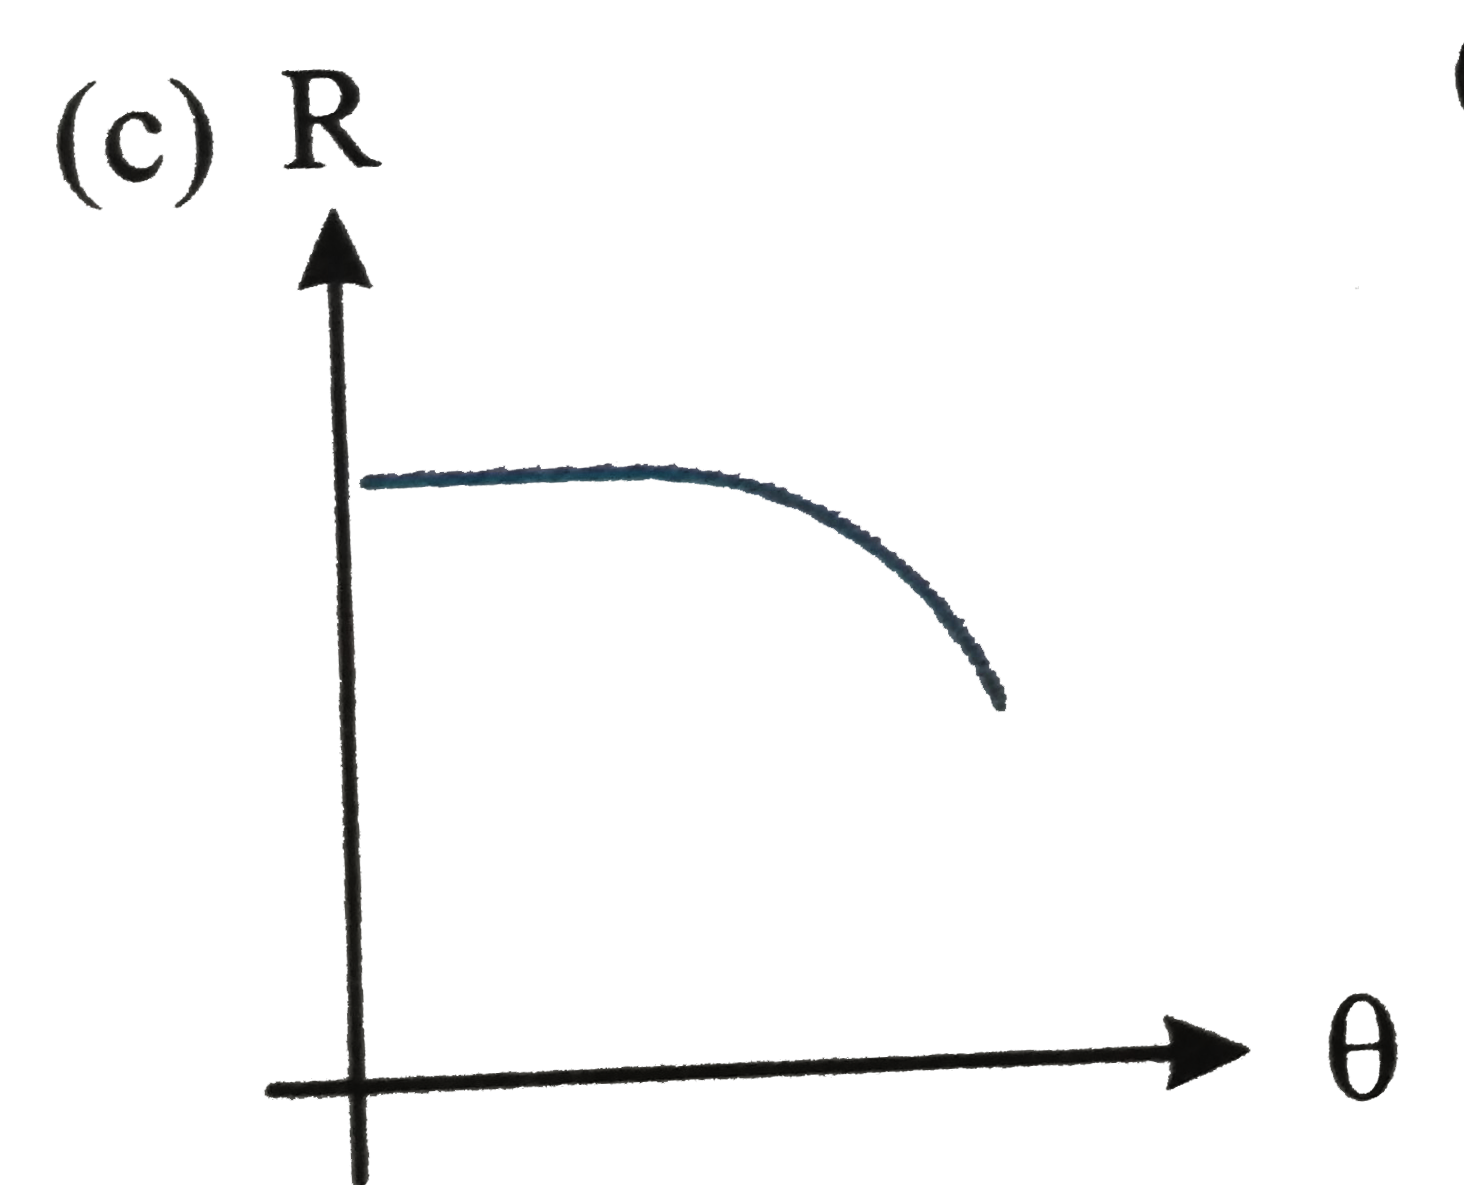 D
D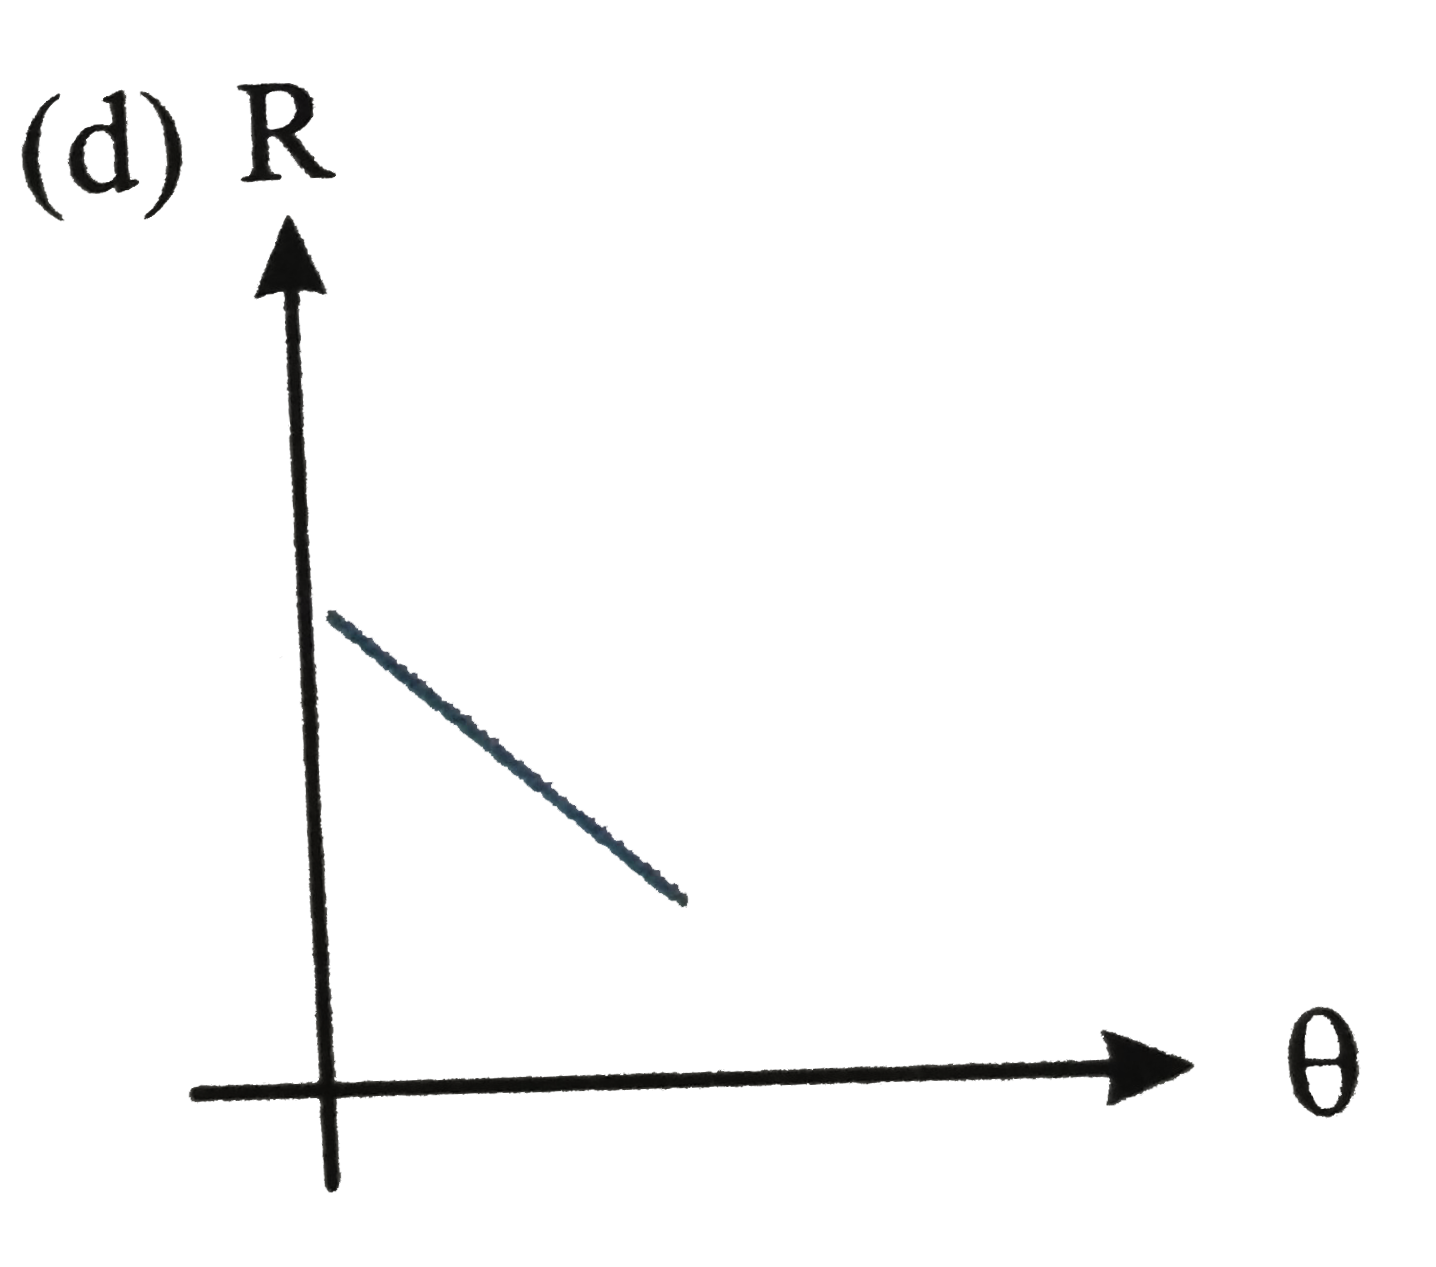
A liquid in a beaker has temperature θ(t) at time t and θ0 is temperature of surroundings, then according to Newton's law of cooling the correct graph between loge(θ−θ0) and t is :
A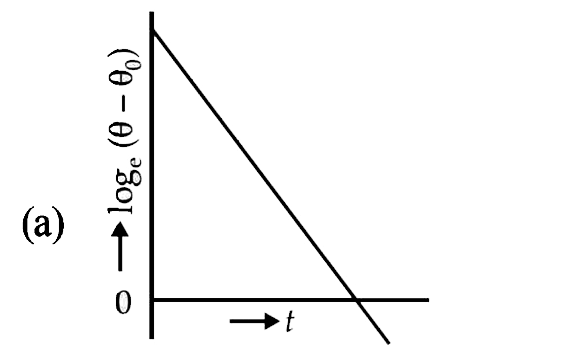 B
B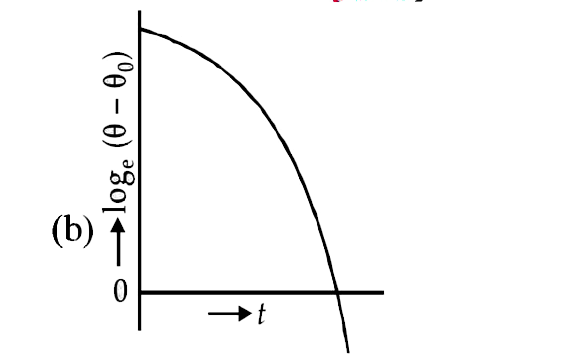 C
C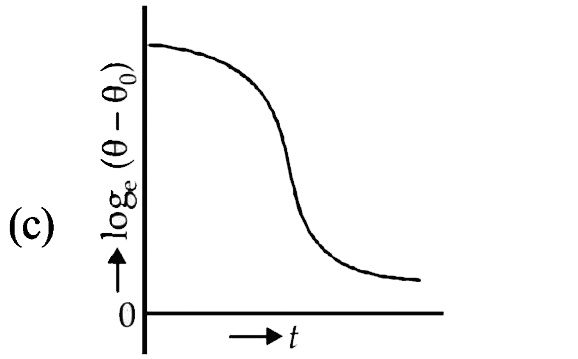 D
D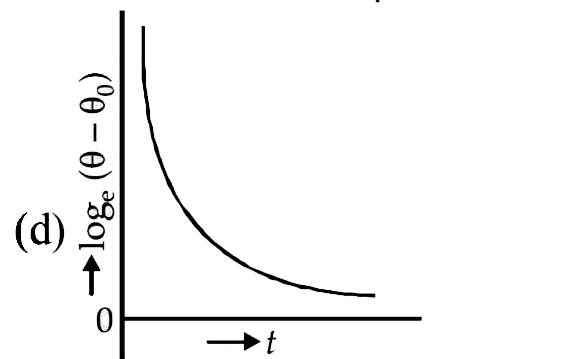
If a piece of metal is heated to temperature θ and the allowed to cool in a room which is at temperature θ0, the graph between the temperature T of the metal and time t will be closet to
View SolutionIn Newton's law of cooling experiment, we plot a graph of (dθdt) against the temperature difference (θ−θ0). The graph is
View SolutionIf 0∘<θ<90∘, then the value of sinθ+cosθ is
View SolutionIf a piece of metal is heated to temperature θ and the allowed to cool in a room which is at temperature θ0, the graph between the temperature T of the metal and time t will be closet to
View SolutionFigure shows an electrical calorimeter to determine specific heat capacity of an unknown liquid, First of all, the mass of empty calorimeter (a copper container) is measured and suppose it is m1. Then the unknown liquid is poured in it. Now the combined mass of calorimeter+liquid system is measured and let it be m2. So the mass of liquid is (m2−m1). Initially both were at room temperature (θ0).
Now a heater is immeresed in if for time interval t. The voltage drop across the heater is V and current passing through it is I. Due to heat supplied, the temperature of both the liquid and calorimeter will rise simultaneously. After tsec, heater was switched off, and final temperature is θr. If there is no heat loss to surroundings. Heat supplied by the heater=Heat absorbed by the liquid+heat absorbed by the calorimeter (VI)t=(m2−m1)S1(θf−θ0)+m1Sc(θf−θ0)
The specific heat of the liquid S1=(VI)tθf−θ0−m1Sc(m2−m1)
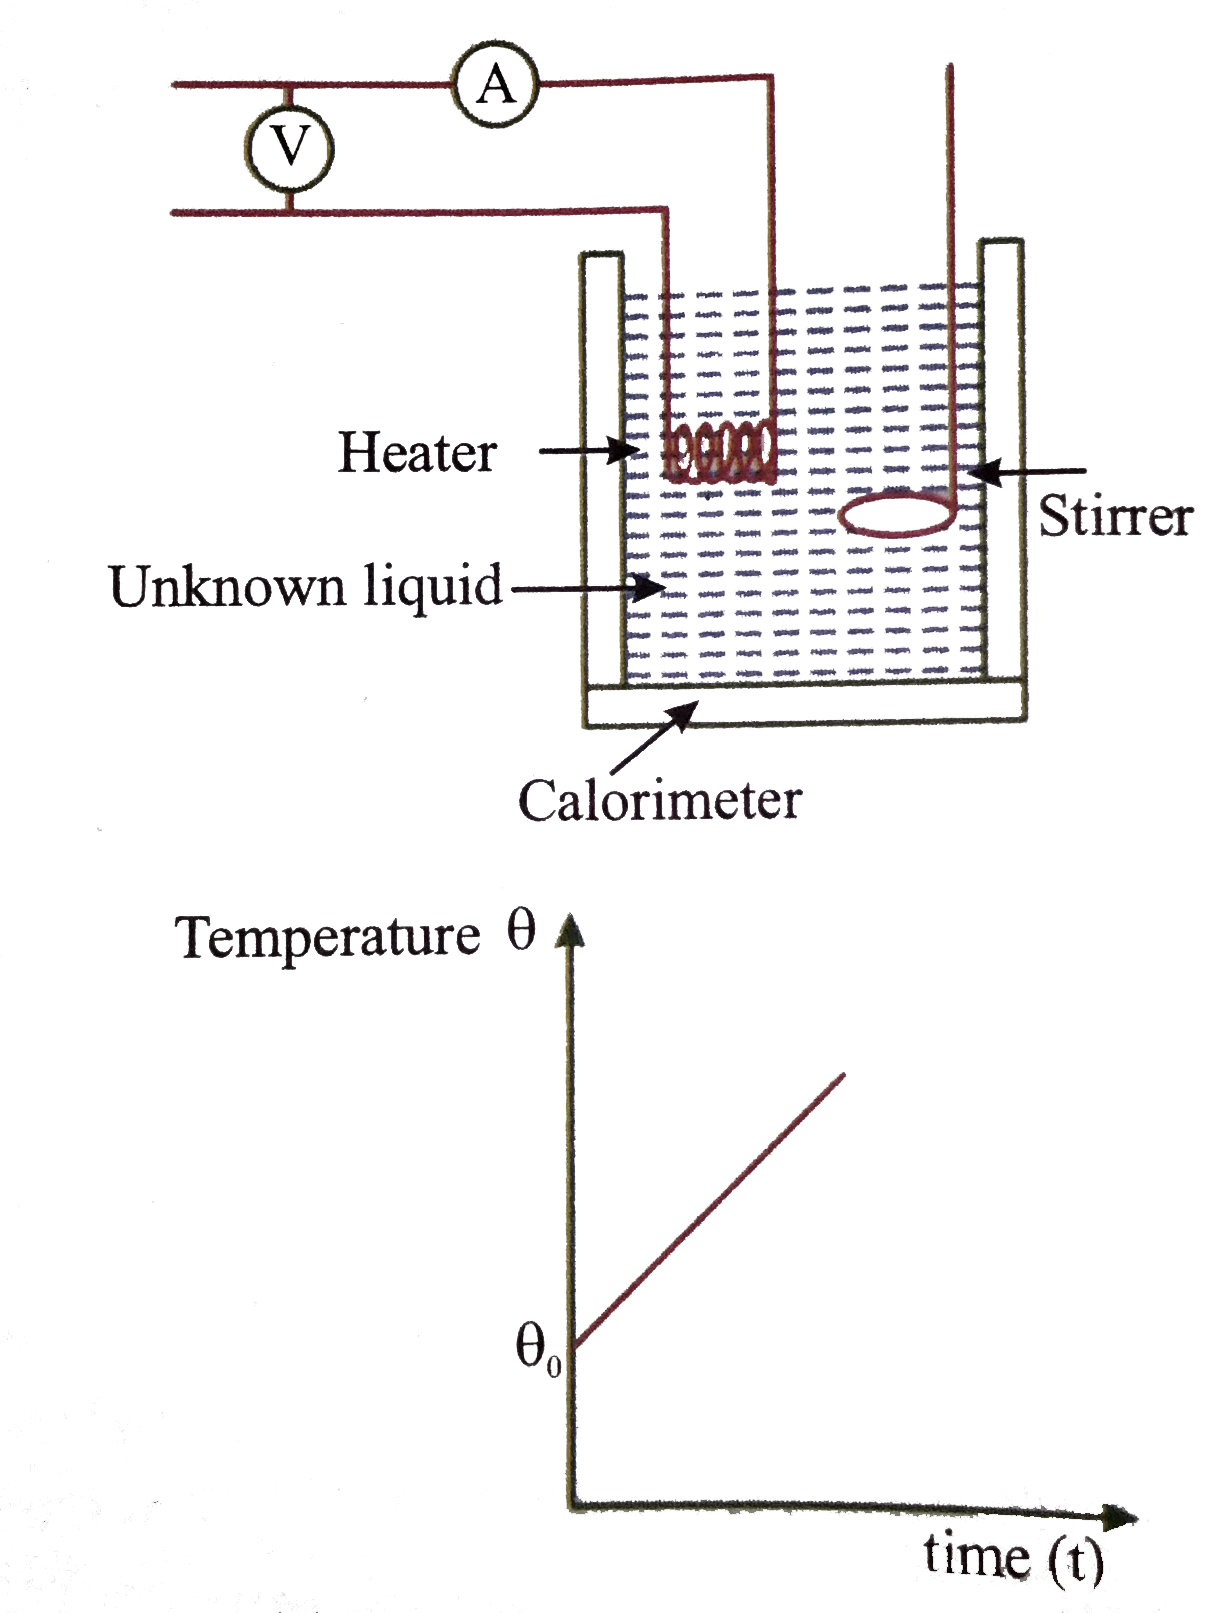
Radiation correction: There can be heat loss to environment. To compensate this loss, a correction is introduced.
Let the heater was on for tsec, and then it is switched off. Now the temperature of the mixture falls due to heat loss to environment. The temperature of the mixture is measured t/2sec. after switching off. Let the fall in temperature during this time is ɛ
Now the corrected final temperature is taken as θf=θf+ɛ
In this experiment voltage across the heater is 100.0V and current is 10.0A, and heater was switched on for t=700.0sec. Initially all elements were at room temperature θ∘=10.0∘C and final temperature was measured as θf=73.0∘C.
Mass of empty calorimeter ws 1.0kg and the combined mass of calorimeter + liquid is 3.0kg. The specific heat capacity of the calorimeter =3.0×10³J/kg∘C. The falls in temperature 350 second after switching off the heater was 7.0∘C. Find the specific heat capacity of the unknown liquid in proper significant figures.
View Solution
