Figure shows plot of PV/T versus Pfor1.00×10−3 kg of oxygen gas at two different temperatures.
(i) What does the dotted plot signify?
(ii) Which is true . T1>T2orT1<T2?
(iii) What is the value of PV/T where the curves meet on the y-axis? _E01_262_Q01.png)
The correct Answer is:(i) ideal gas behaviour (ii) T1>T2 (iii) 0.26JK^(-1)
(i) Dotted lines correspond to ideal gas
(ii) T1>T2
(On high temp. real gas behaves as ideal gas)
(iii) PVT=mMR=10−332×10−3×8.314=0.26J/K
Topper's Solved these Questions
- BOOK - ALLENCHAPTER - GEOMETRICAL OPTICSEXERCISE - EXERCISE - 04 (B)15videos
GEOMETRICAL OPTICS
- BOOK - ALLENCHAPTER - GEOMETRICAL OPTICSEXERCISE - EXERCISE - 05 (A)73videos
GEOMETRICAL OPTICS
- BOOK - ALLENCHAPTER - GEOMETRICAL OPTICSEXERCISE - Comprehension Based Questions66videos
GEOMETRICAL OPTICS
- BOOK - ALLENCHAPTER - CURRENT ELECTRICITYEXERCISE - EX.II66videos
CURRENT ELECTRICITY
- BOOK - ALLENCHAPTER - GRAVITATIONEXERCISE - EXERCISE 49videos
GRAVITATION
Similar Questions
Knowledge Check
- Question 1 - Select One
The voltage V and current I v graphs for a conductor at two different temperatures T1andT2 are shown in the figure. The relation between T1andT2 is
 AT1>T2BT1<T2CT1=T2DT1=1T2
 - Question 2 - Select One
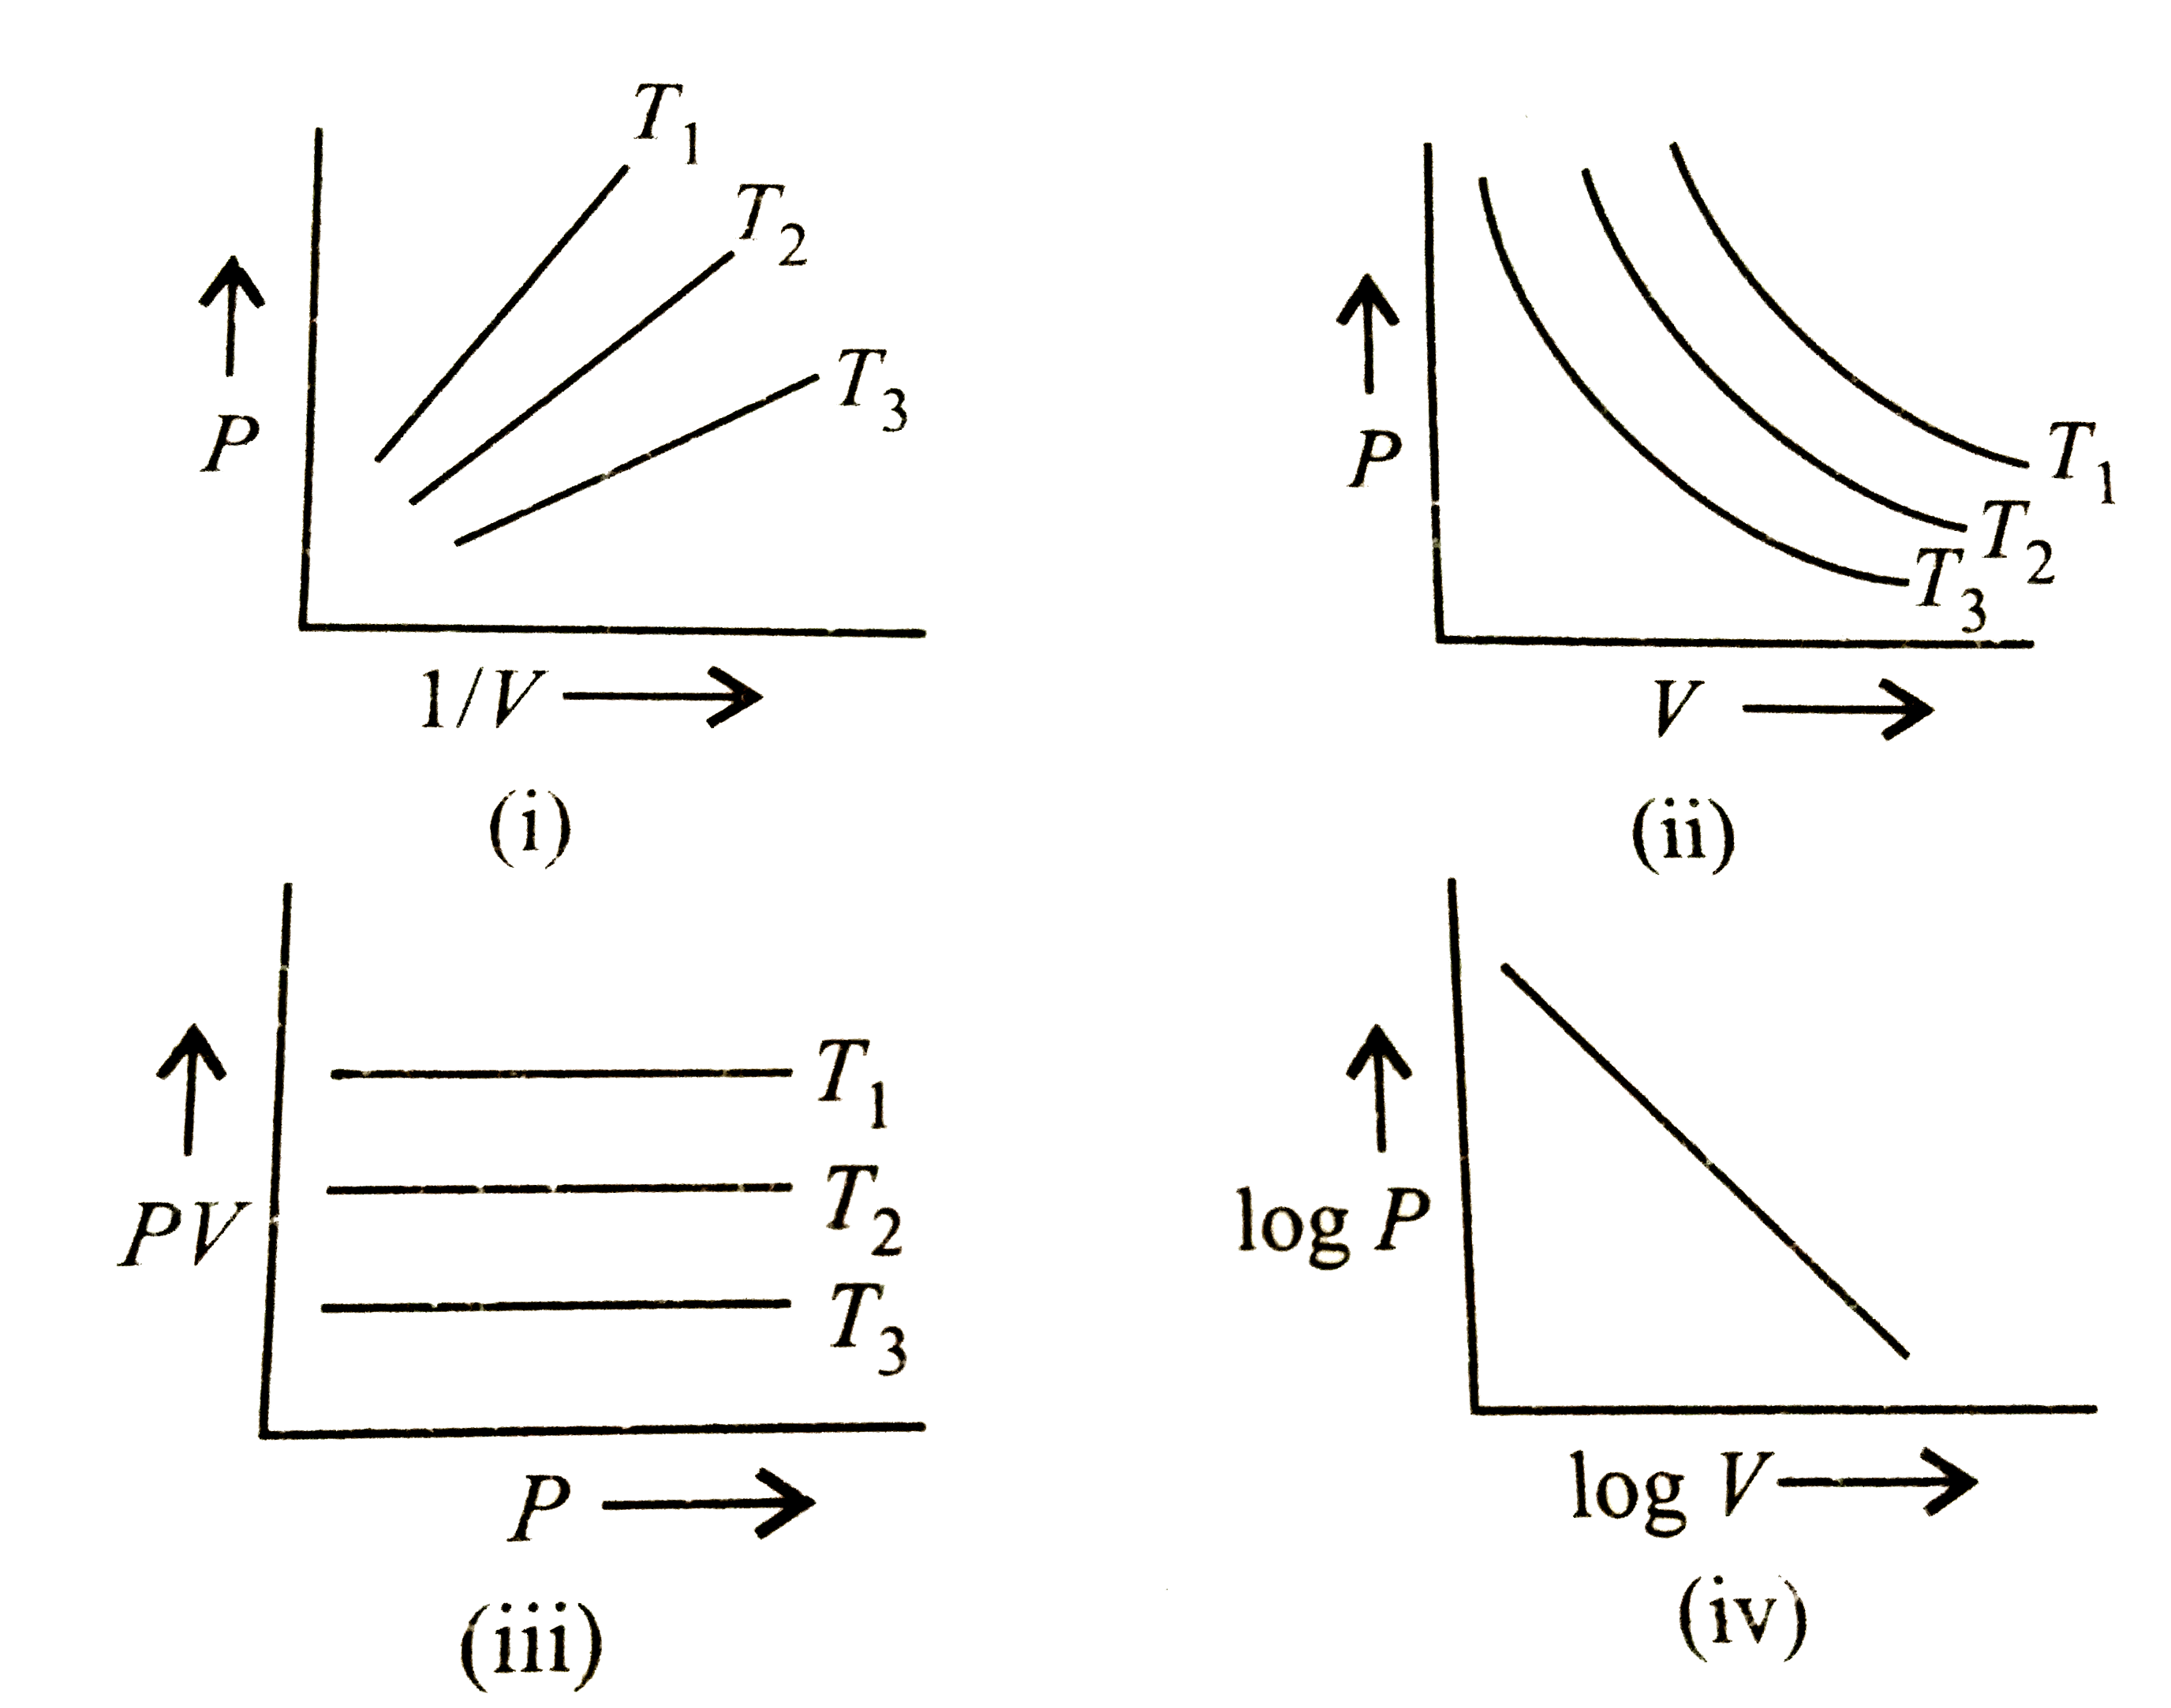
The isothermal diagram of a gas at three different temperatures T1,T2andT3, is show in the given figure .Then
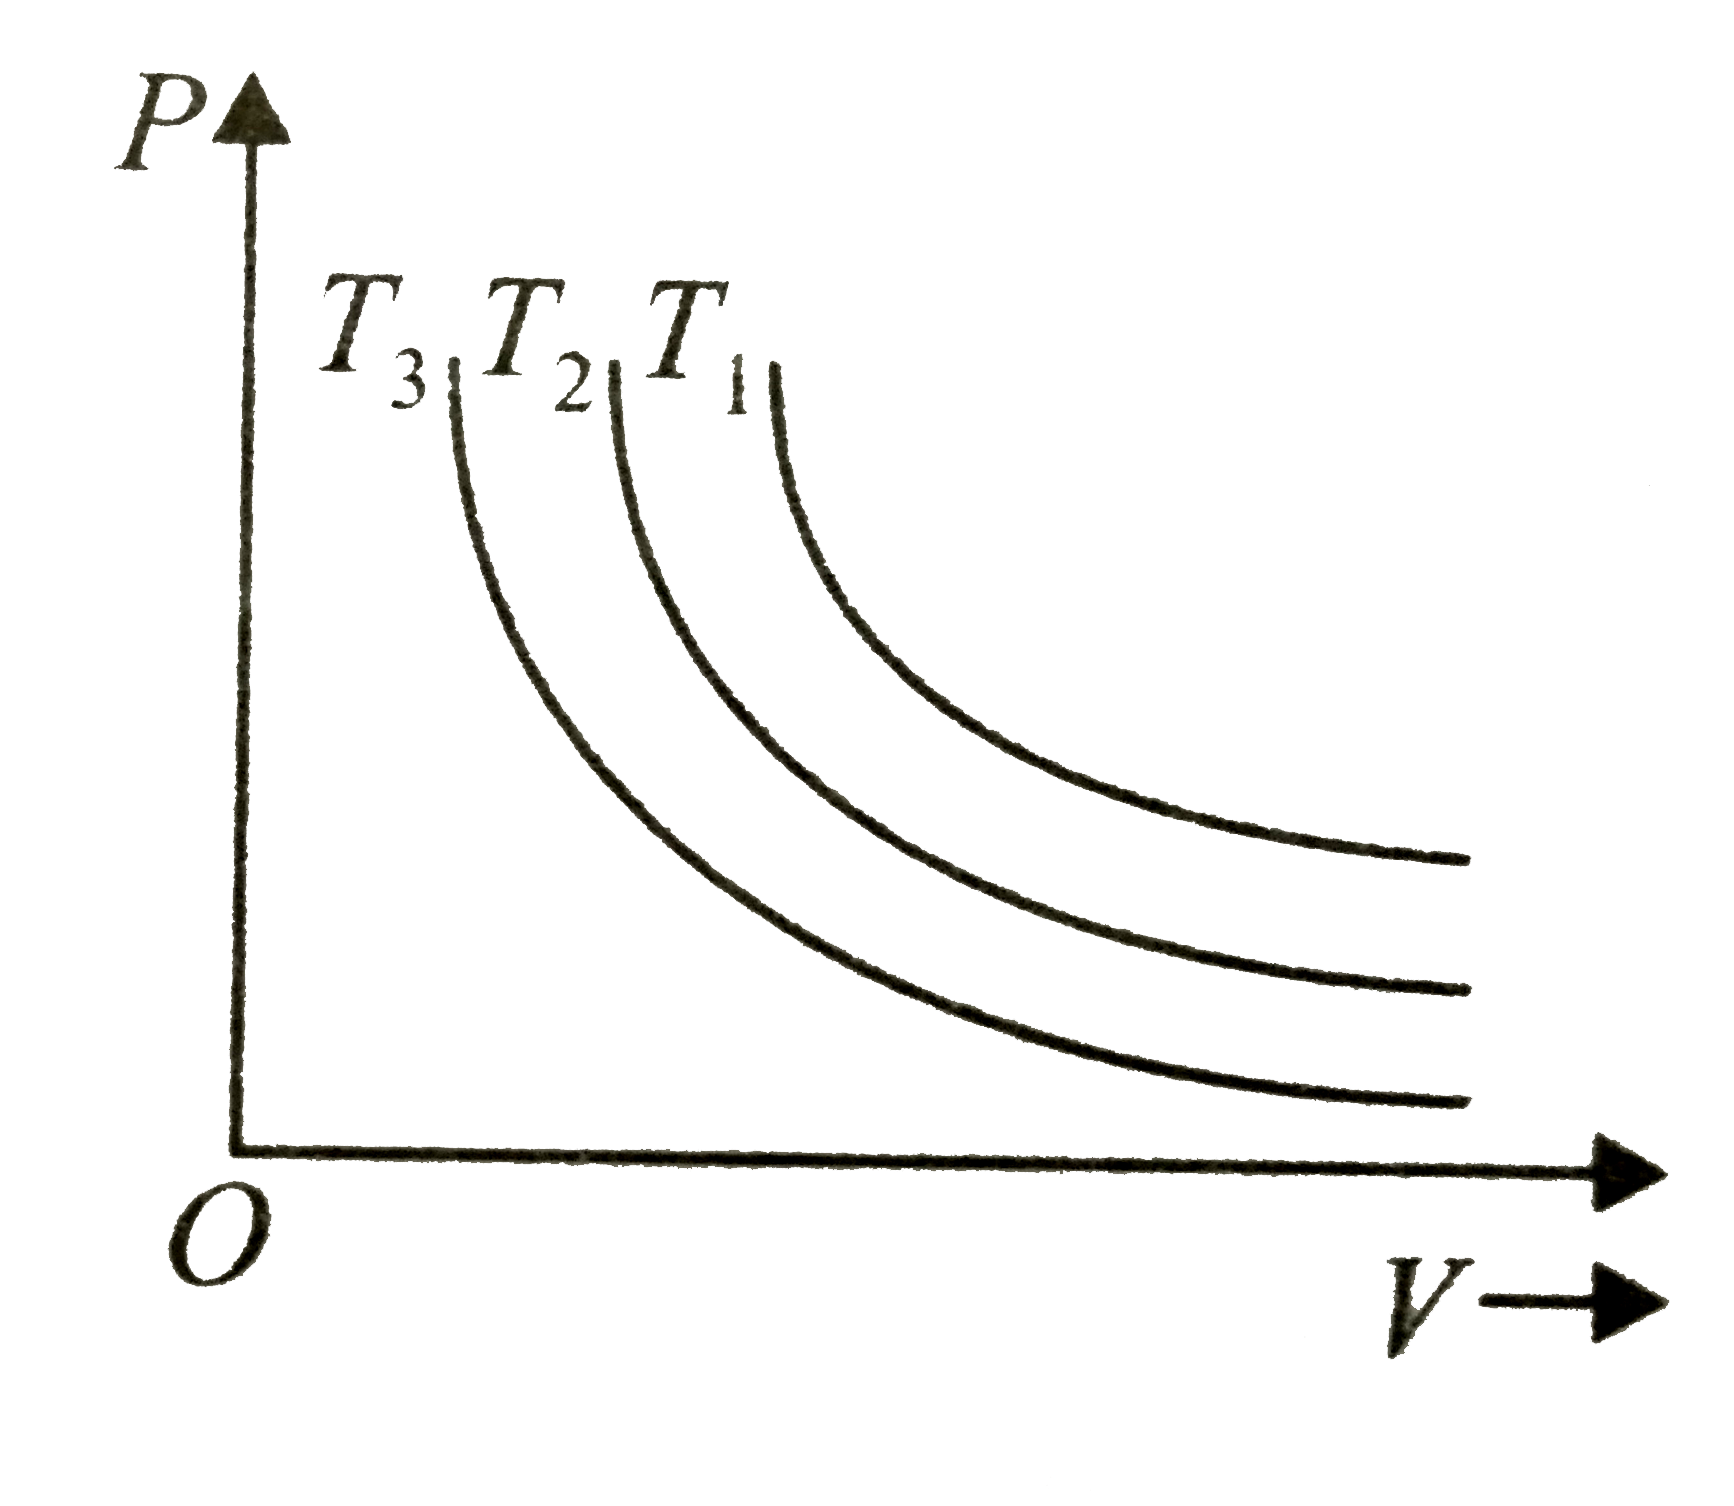 Aa.T1<T2<TBb. T1<T2>T3Cc.T1>T2>T3Dd.T1>T2<T3
Figure shows graphs of pressure versus density for an ideal gas at two temperatures T1 and T2 Which is correct ?
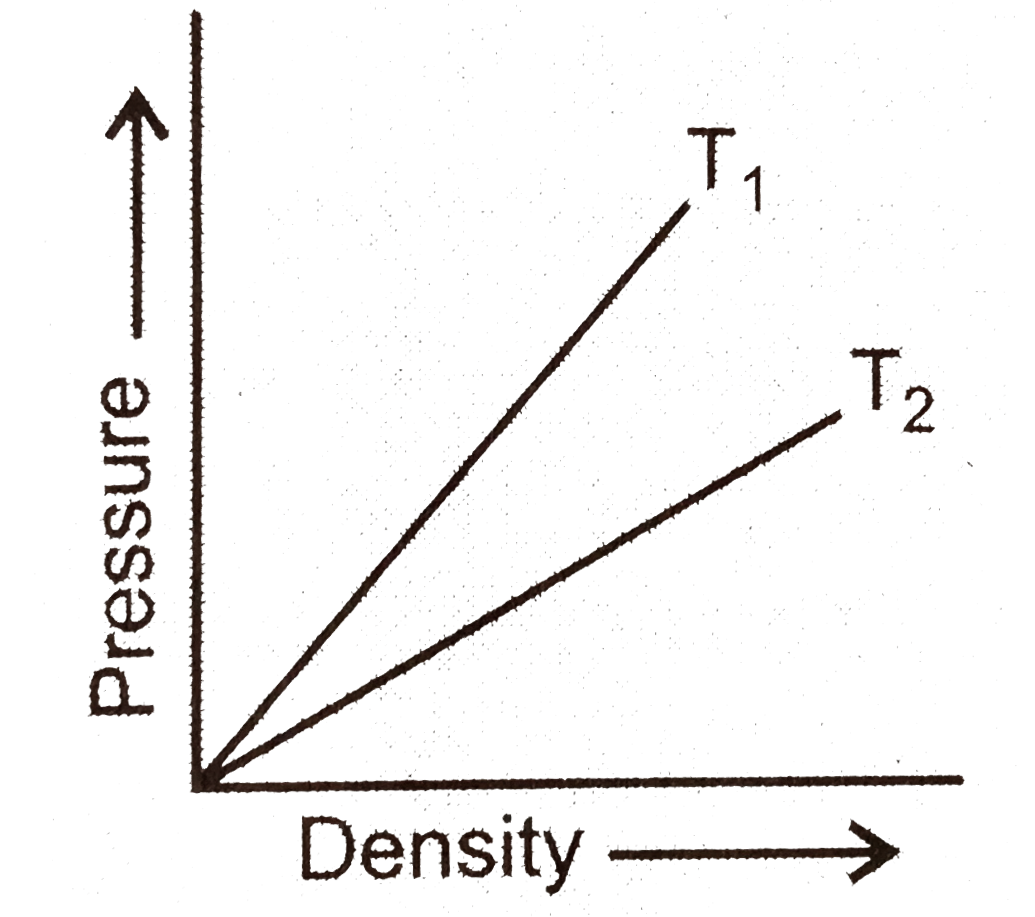 .View Solution
The stress-strain graph for a metallic wire is shown at two different temperature, T1 and T2 which temperature is high T1 or T2 ?
View SolutionFigure shows graphs of pressure vs density for an ideal gas at two temperature T1andT2. Which of the following is correct?
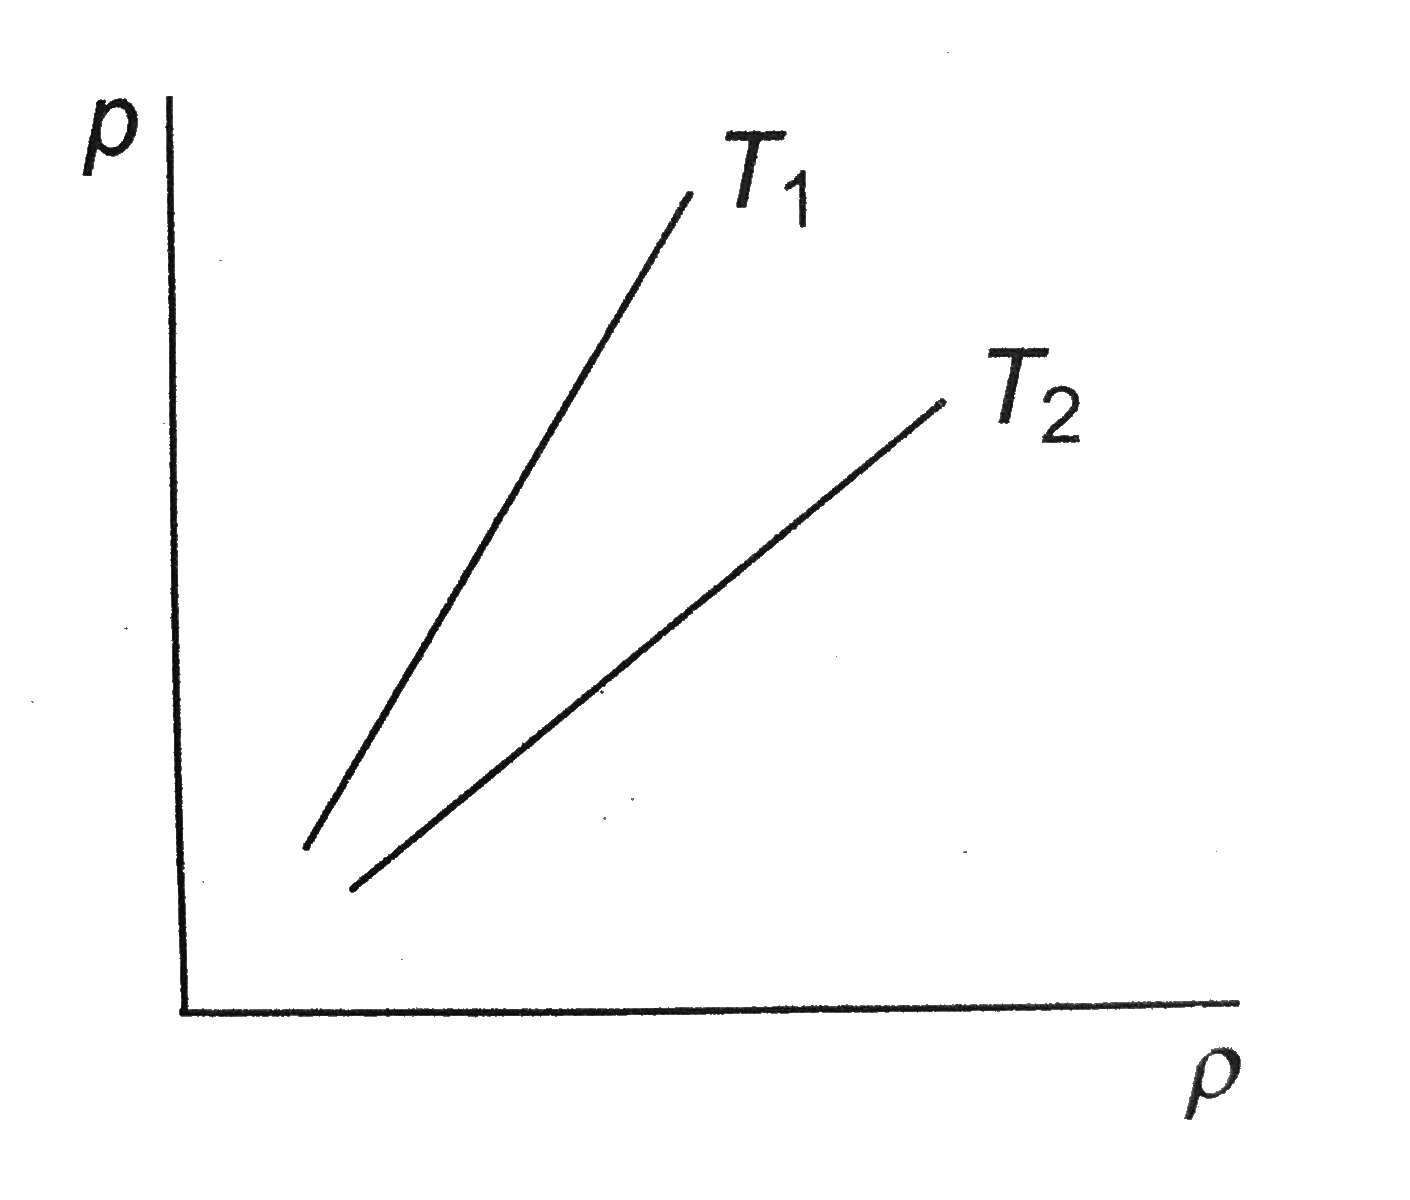 View Solution
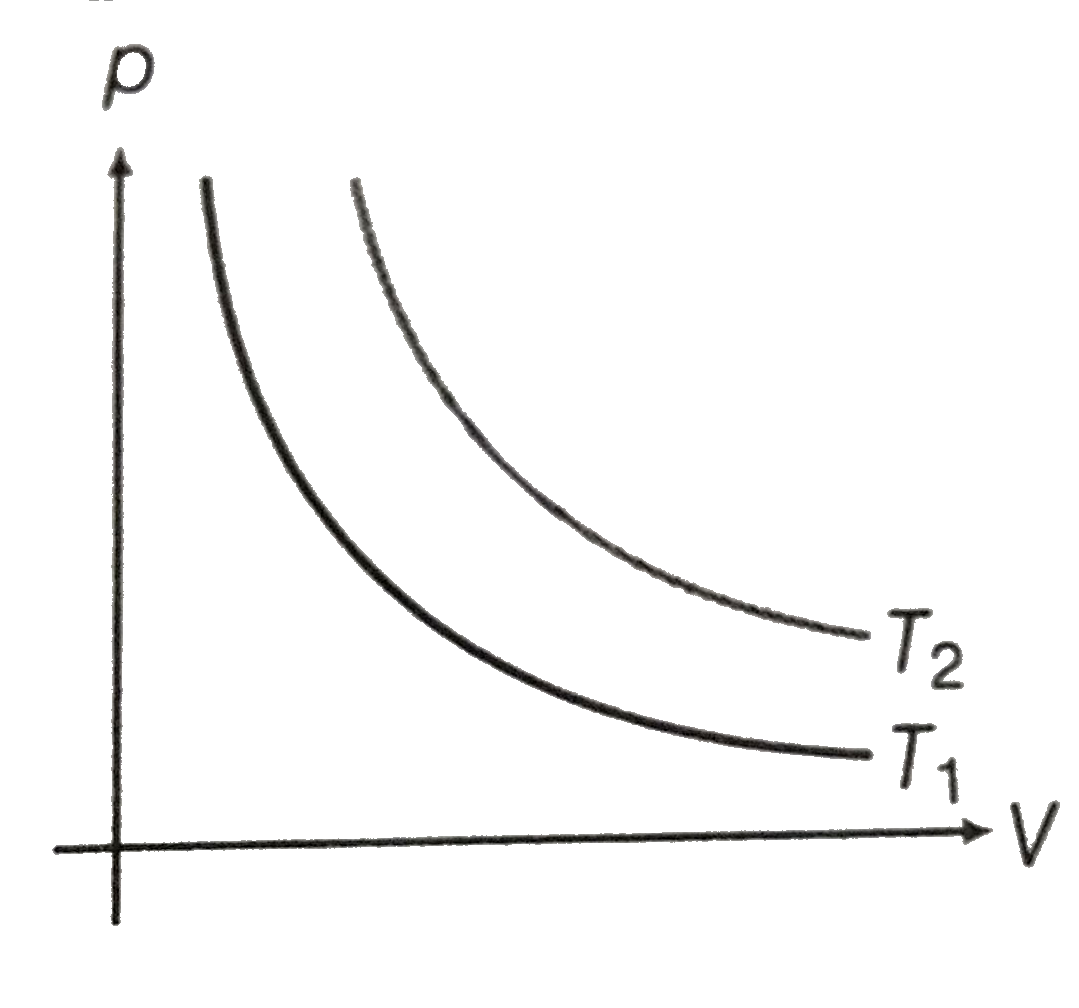
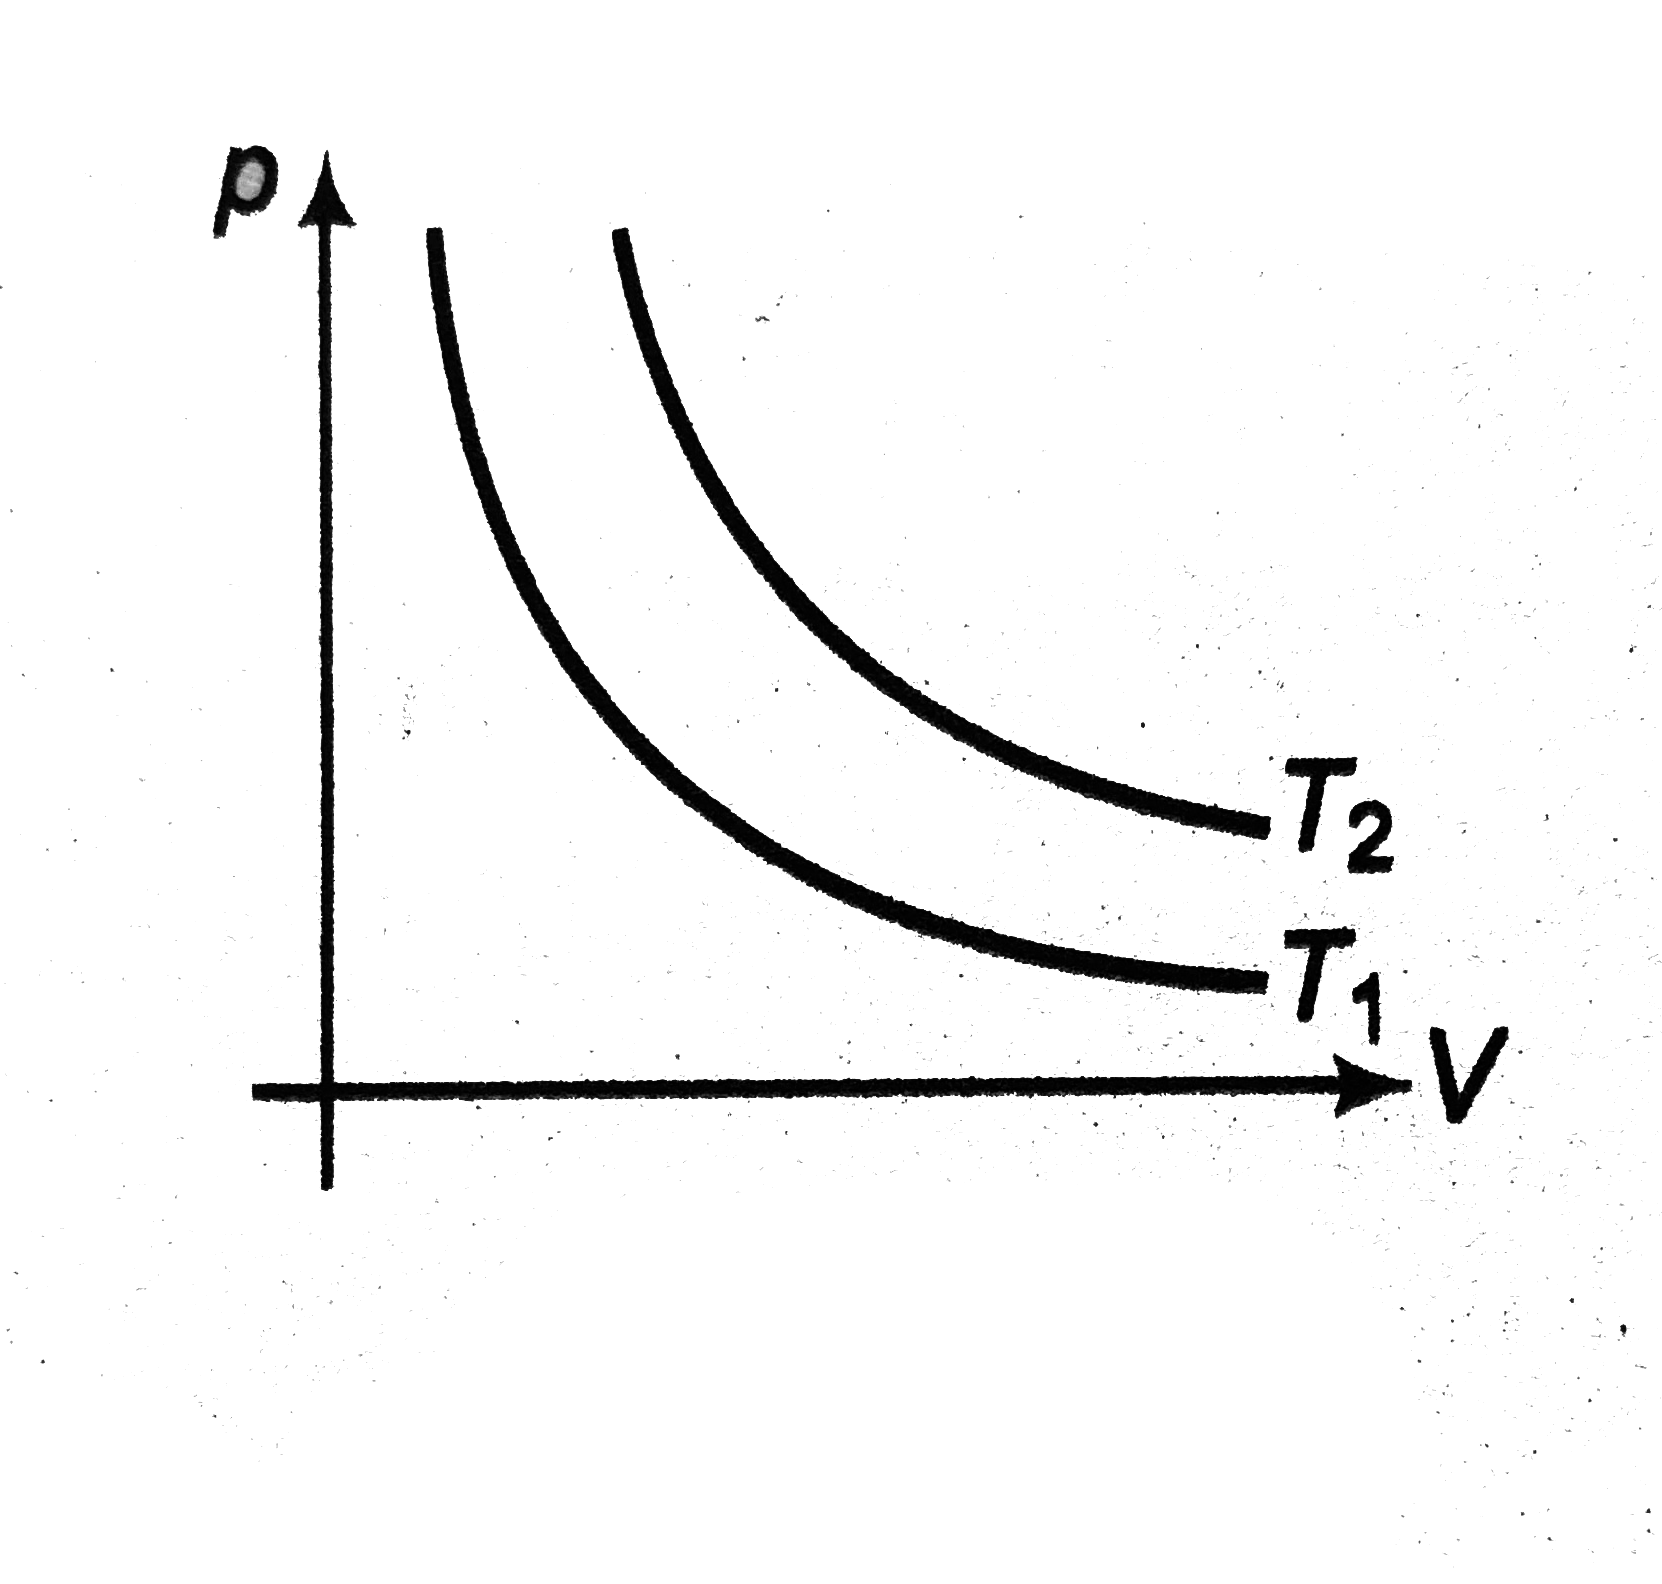
The adjoining fgure shows graph of pressure and volume of a gas at two temperatures T1 and T2 Which one the following is correct
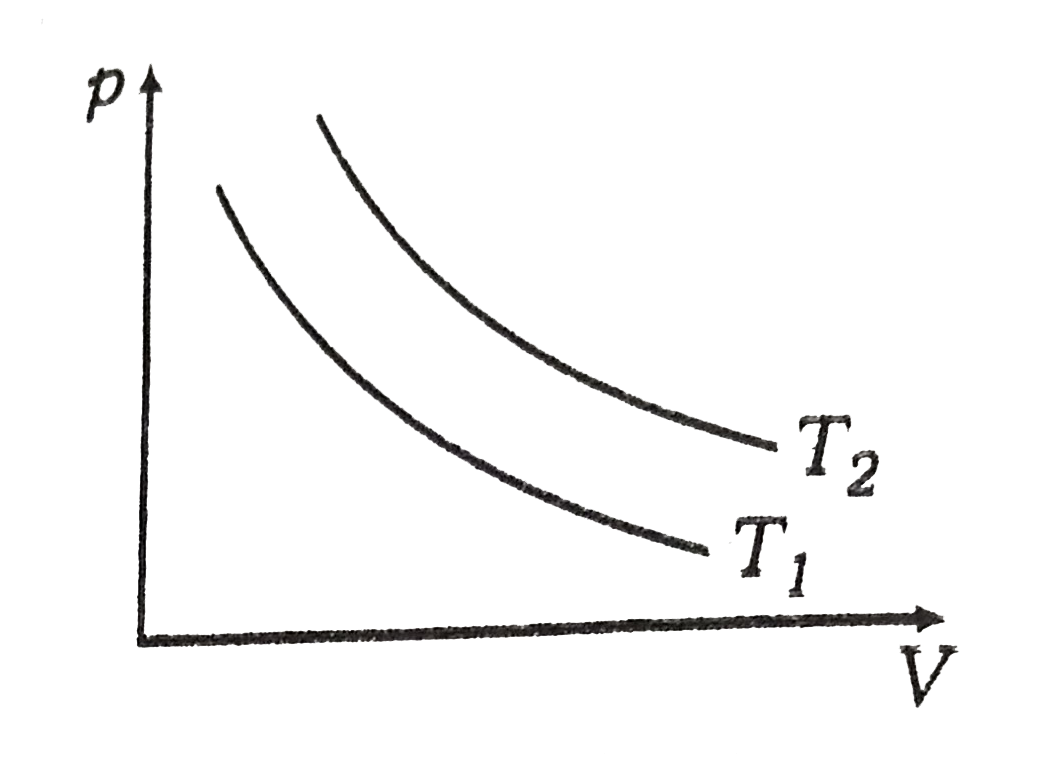 View Solution
The product (PV) is plotted against P at two temperature T1andT2 and the result is given in following figure
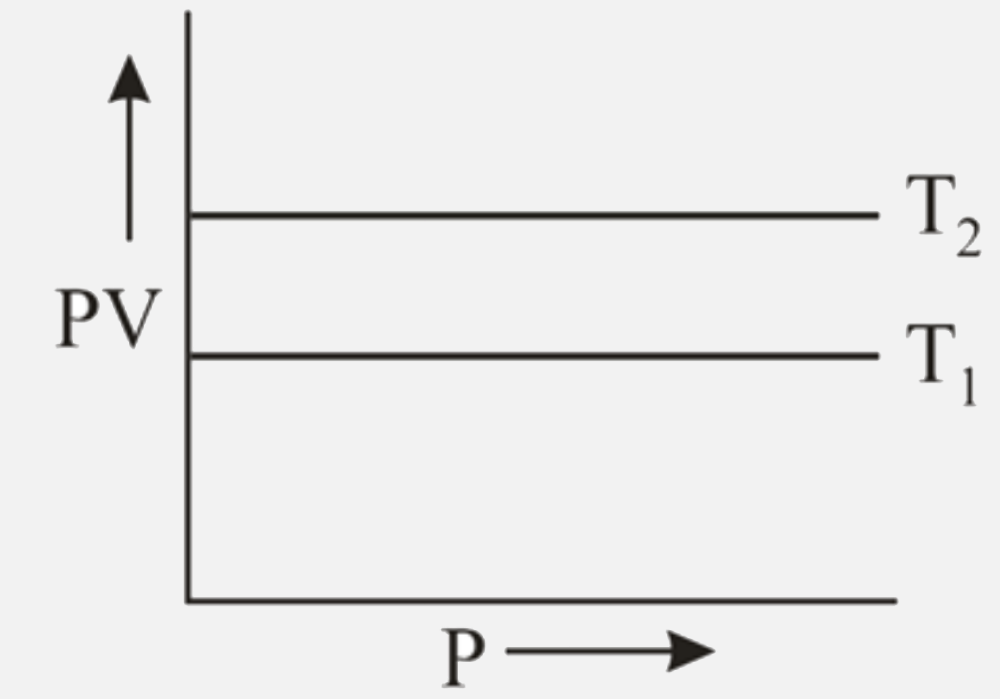
What is correct about T1andT2 ?View SolutionGraphs between pressure and volume are plotted at different temperatures . Which of the following isotherms represents Boyle's law as PV = constant ? (T1>T2>T3)
 View Solution


 .
.