The oxygen dissociation curve is
parabola
slope
sigmoid
stright line.
The correct Answer is:C
Step-by-Step Solution:
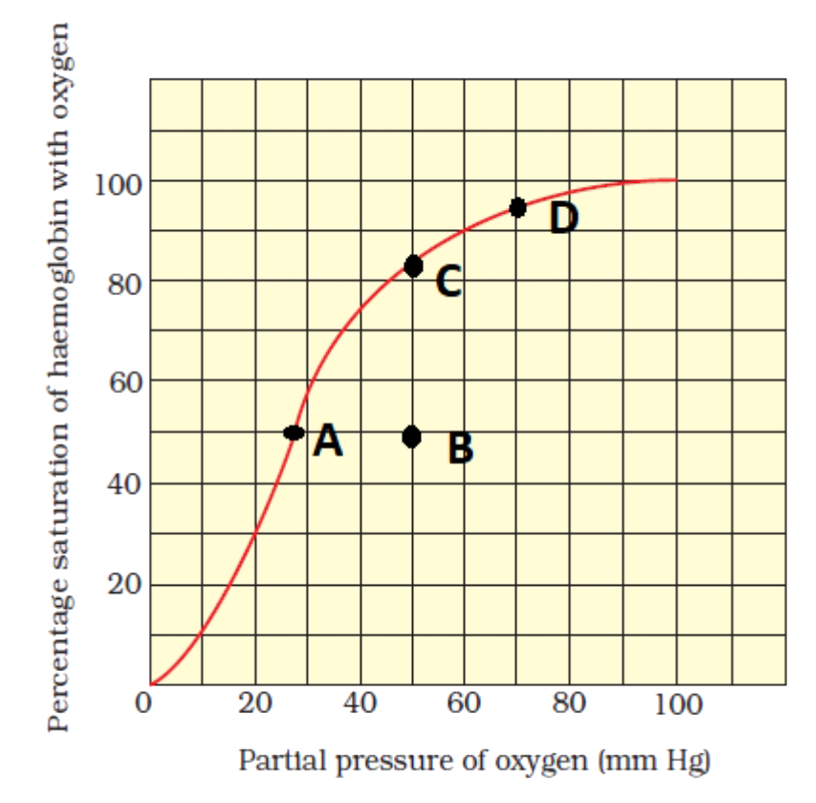
1. Understanding the Oxygen Dissociation Curve: The oxygen dissociation curve illustrates the relationship between the partial pressure of oxygen (pO2) and the saturation of hemoglobin with oxygen. It helps to understand how readily hemoglobin acquires and releases oxygen.
2. Graph Representation: To visualize this relationship, we plot a graph where the x-axis represents the partial pressure of oxygen (measured in mm Hg) and the y-axis represents the percentage saturation of hemoglobin with oxygen.
3. Shape of the Curve: As we plot the data points, we observe that the curve does not form a straight line. Instead, it exhibits a characteristic S-shape, which indicates that hemoglobin's affinity for oxygen changes at different levels of pO2.
4. Sigmoid Nature: The S-shaped curve is referred to as a sigmoid curve. This shape indicates that at low pO2 levels, hemoglobin binds oxygen slowly, but as pO2 increases, hemoglobin's affinity for oxygen increases rapidly until it reaches a plateau at high pO2 levels.
5. Conclusion: Based on the analysis of the graph, we conclude that the oxygen dissociation curve is a sigmoid curve. Therefore, the correct answer is option C (sigmoid).
Topper's Solved these Questions
- BOOK - NCERT FINGERTPS ENGLISHCHAPTER - BREATHING AND EXCHANGE OF GASESEXERCISE - Higher Order Thinking12videos
BREATHING AND EXCHANGE OF GASES
- BOOK - NCERT FINGERTPS ENGLISHCHAPTER - BREATHING AND EXCHANGE OF GASESEXERCISE - Exemplar Problems13videos
BREATHING AND EXCHANGE OF GASES
- BOOK - NCERT FINGERTPS ENGLISHCHAPTER - BODY FLUIDS AND CIRCULATIONEXERCISE - Body Fluids And Circulation151videos
BODY FLUIDS AND CIRCULATION
- BOOK - NCERT FINGERTPS ENGLISHCHAPTER - CELL - THE UNIT OF LIFEEXERCISE - Cell - The Unit Of Life159videos
CELL - THE UNIT OF LIFE
Similar Questions
Knowledge Check
- Question 1 - Select One
The oxygen dissociation curve will show a right shift in case of:
Ahigh PCO2Bhigh PO2Clow PCO2Dless H+ concentration - Question 2 - Select One
Which of the following causes a leftward shift in the oxygen dissociation curve?
AIncreased carbon dioxide concentrationBAn increase in hydrogen ion concentrationCA decrease in pHDAll of the above
What will be the effect on the oxygen dissociation curve, if the temperature is decreased ?
(a) The curve will be shifted right
(b) The curve will be shifted left
(c) The curve will became a straight line
(d) It is unpredictableView SolutionWhen parital pressure of CO2(pCO2) rises the oxygen dissociation curve of haemoglobin will
View SolutionWhich of the following point on the oxygen dissociation curve represent p50 of HbO2 in the. graph give below ?
 View Solution
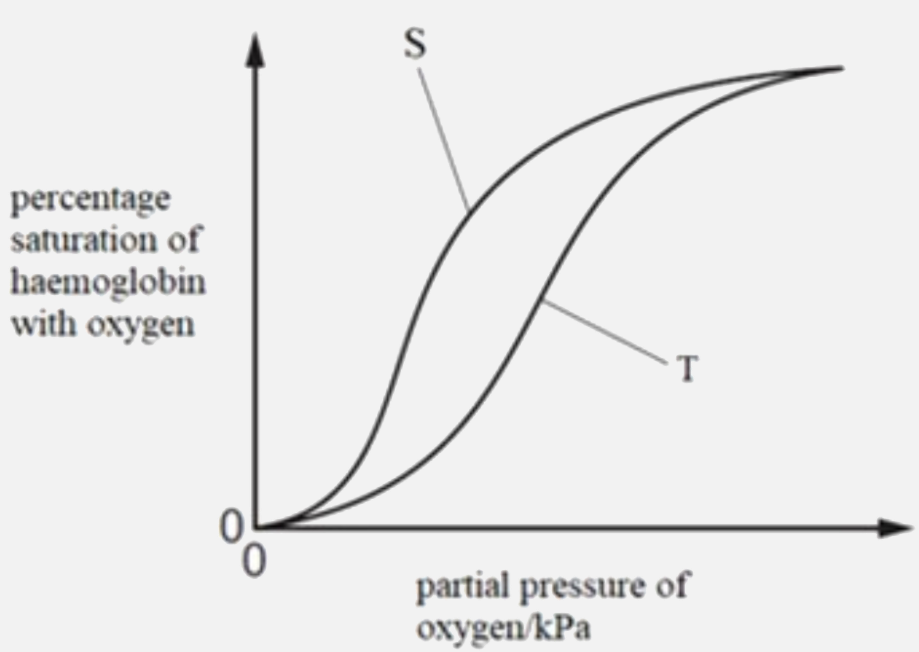
The graph shows the oxygen dissociation curves of haemoglobin from two species of mammals, s and T .

Which statements could explain the difference in the oxygen dissociation curves of species S and species T ?
I. Species T has higher haemoglobin concentration in its red blood cells than species S.
II. The haemoglobin in species T has a lower affinity for oxygen than the haemoglobin in species S.
III. Species T may be living at a higher altitudes than species S.View SolutionHow many factors shift the oxygen dissociation curve to the right shift?
I Low partial pressure of oxygen
ii High concentation of carbon dioxide
iii High number of hydrogrn ions
iv Low body temperature
v Daily exercise
vi Haemoglobin of babies or fetal haemoglobinView SolutionDefine oxygen dissociation curve. Can you suggest any reason for its sigmoidal pattern?
View Solution

