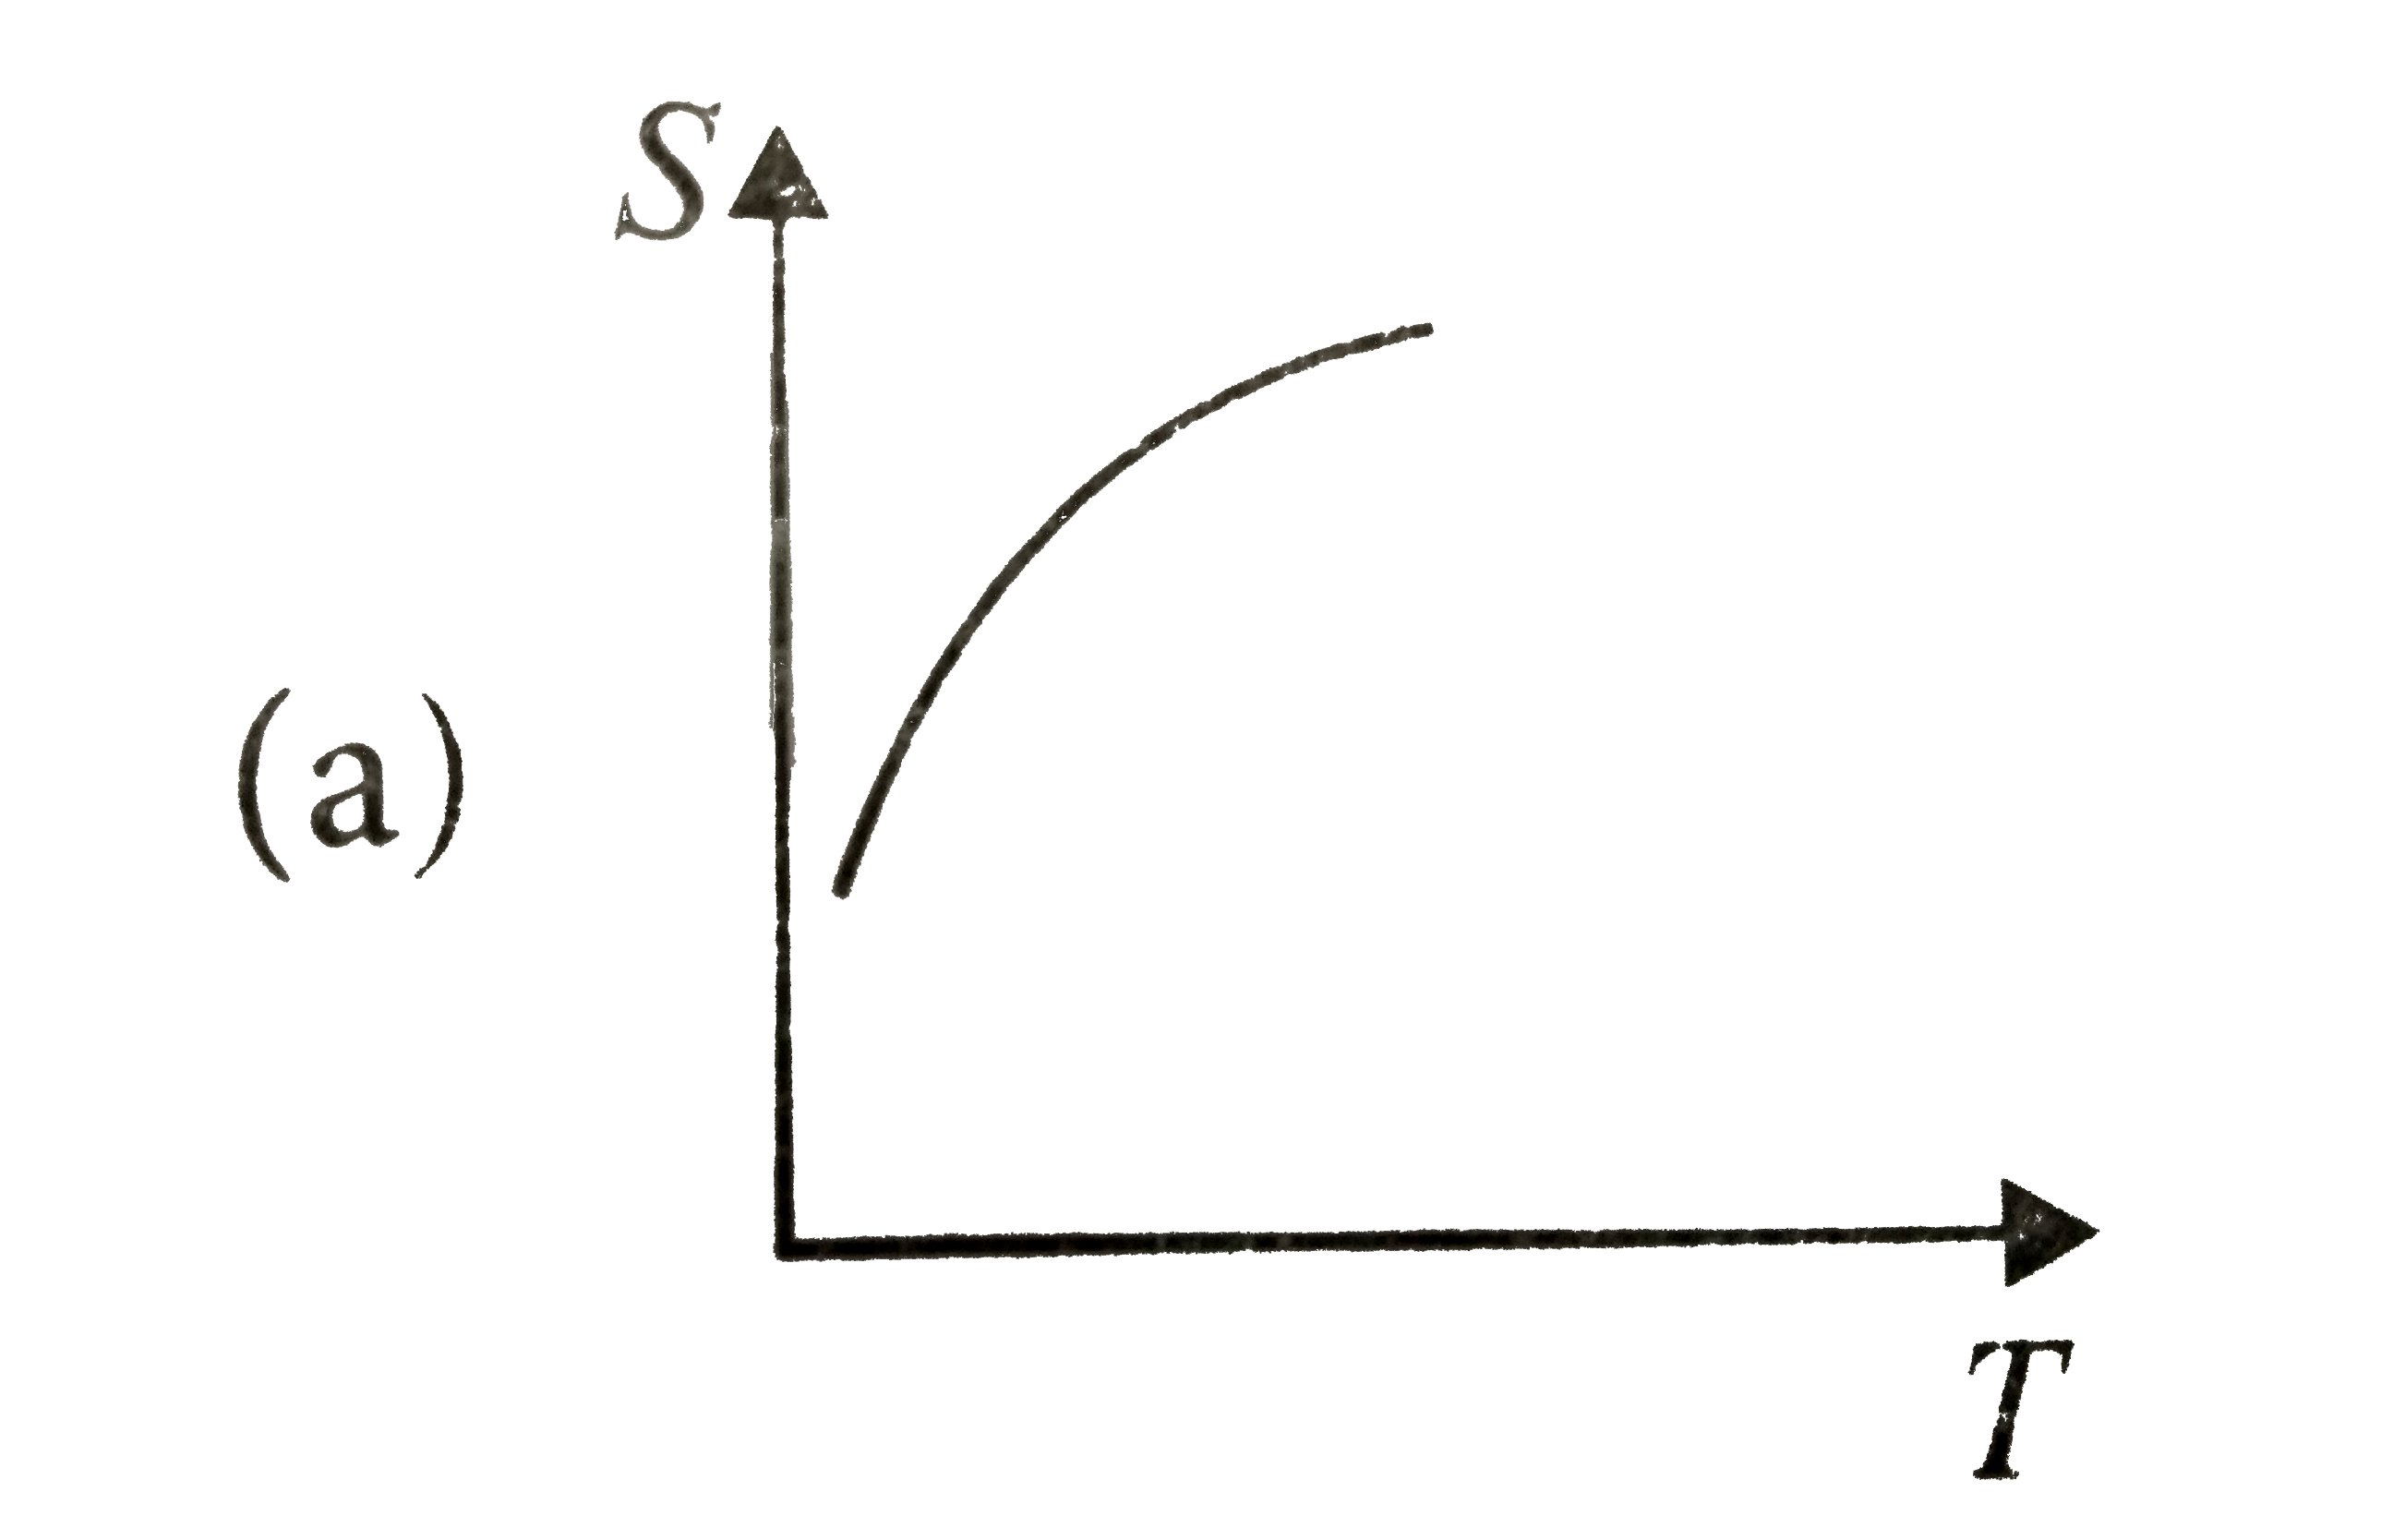
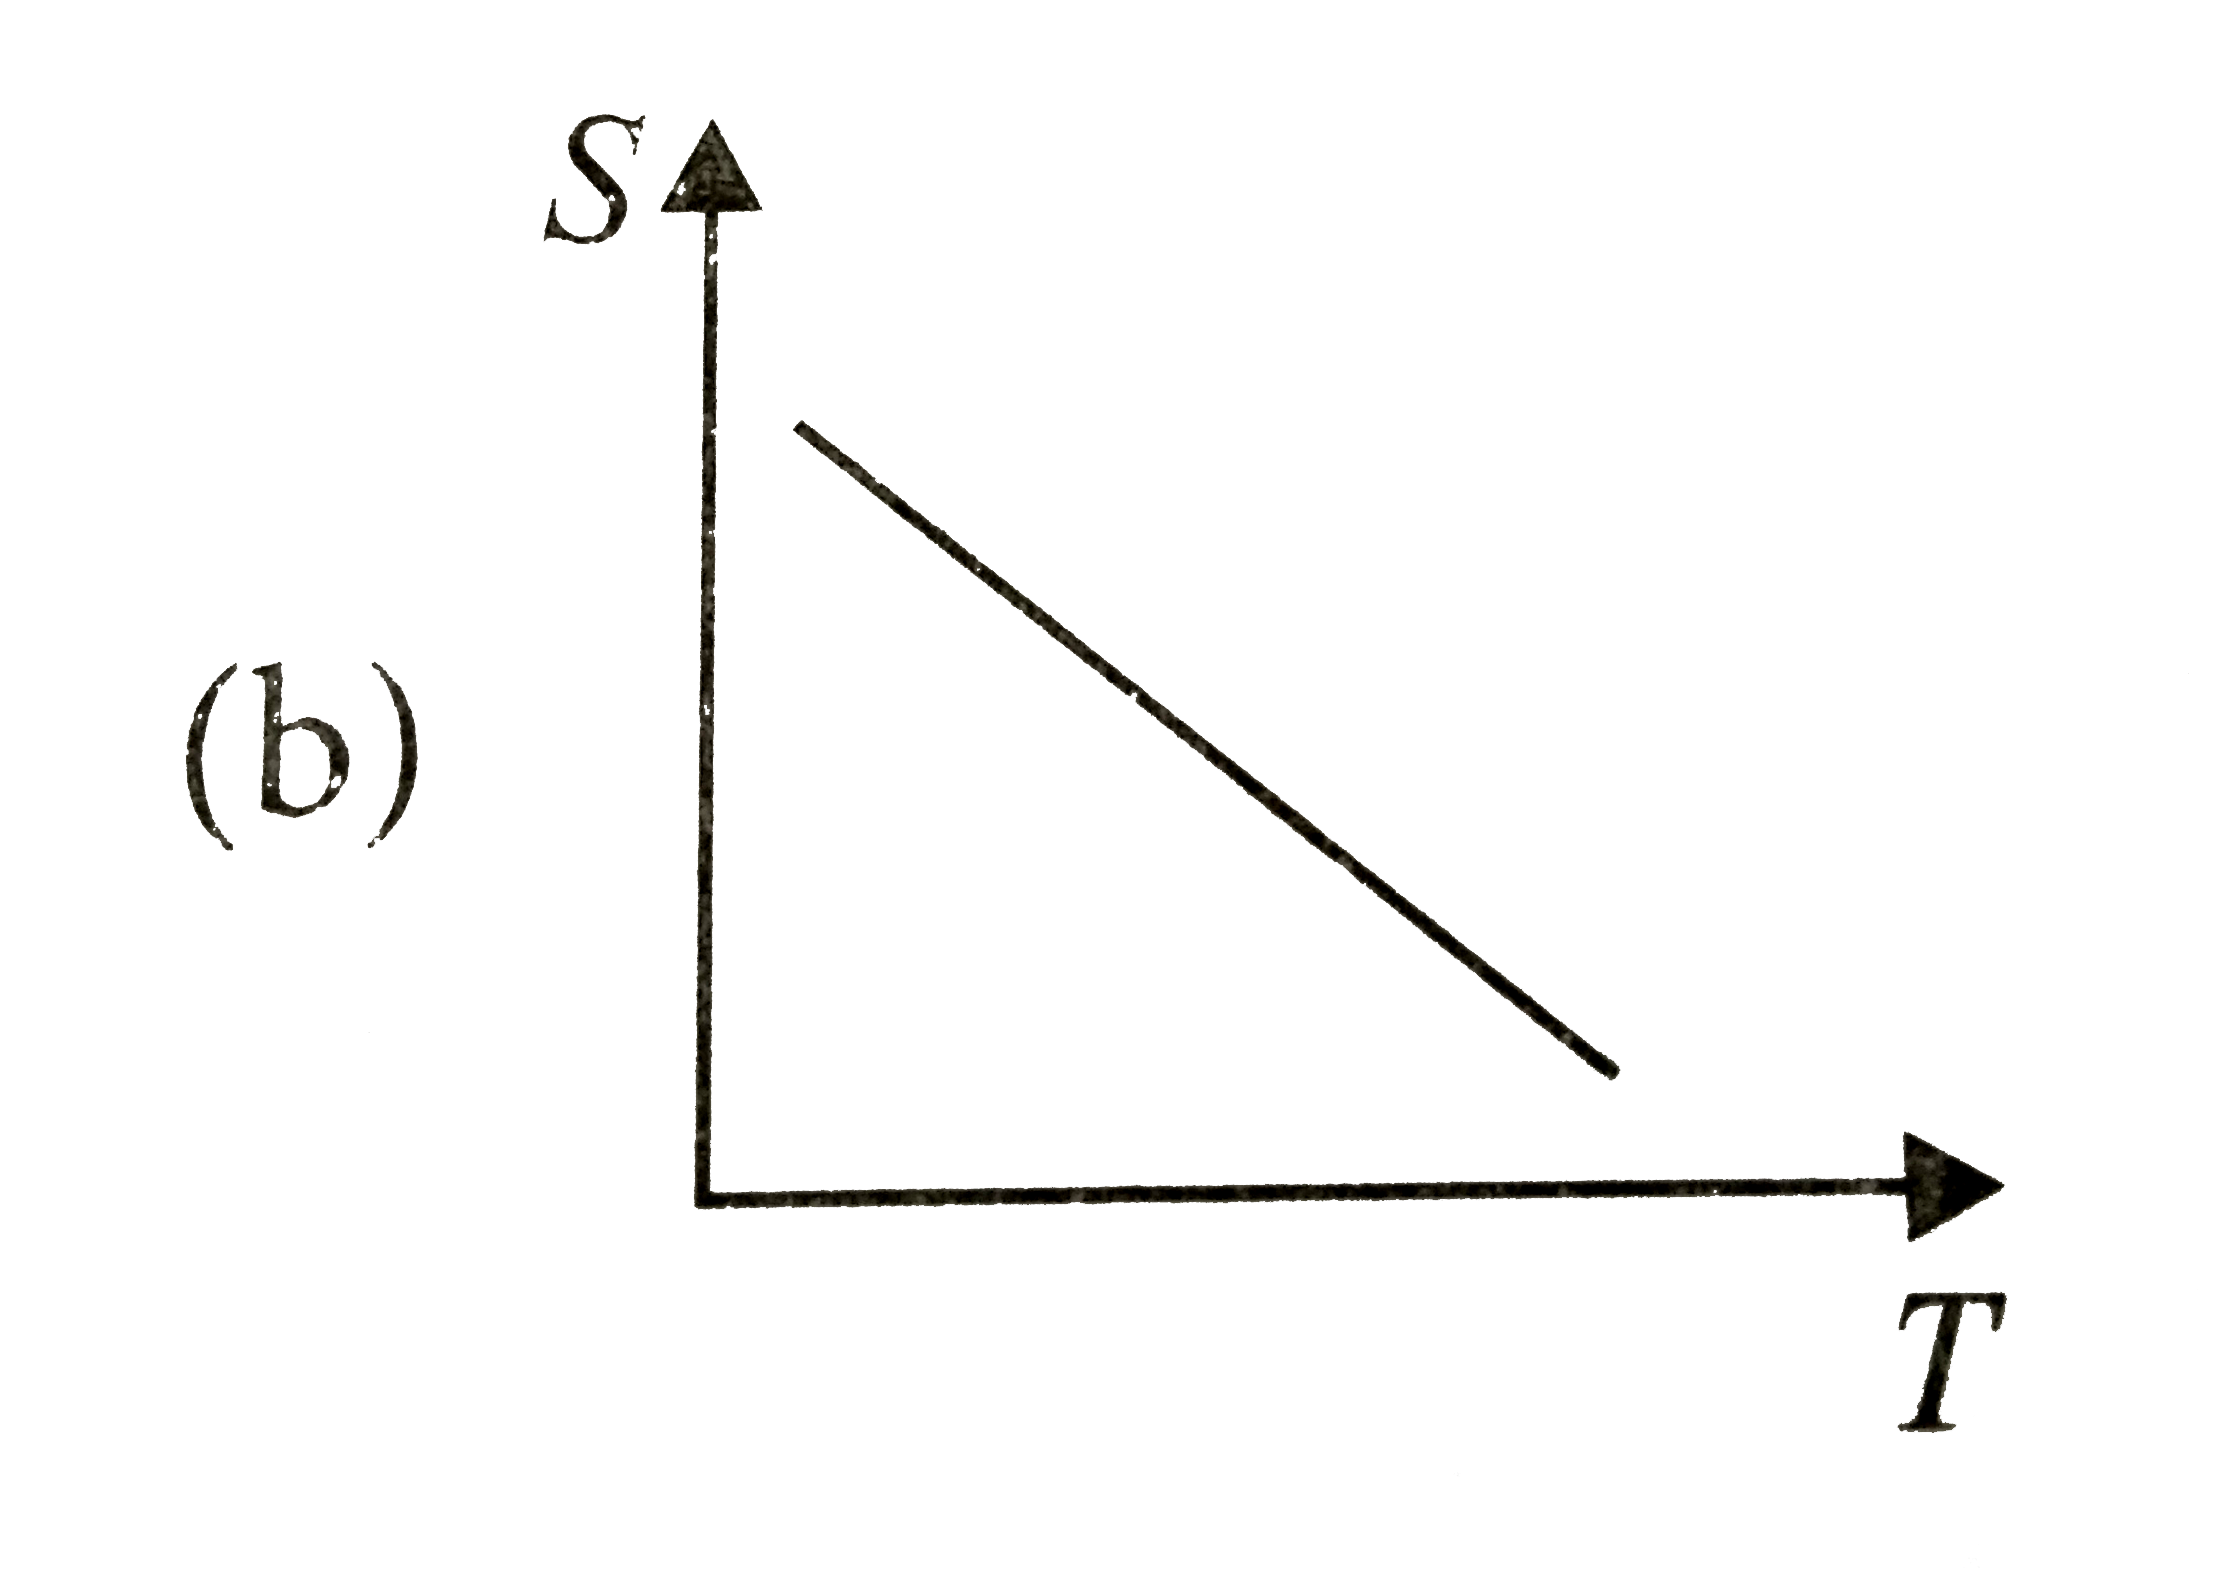
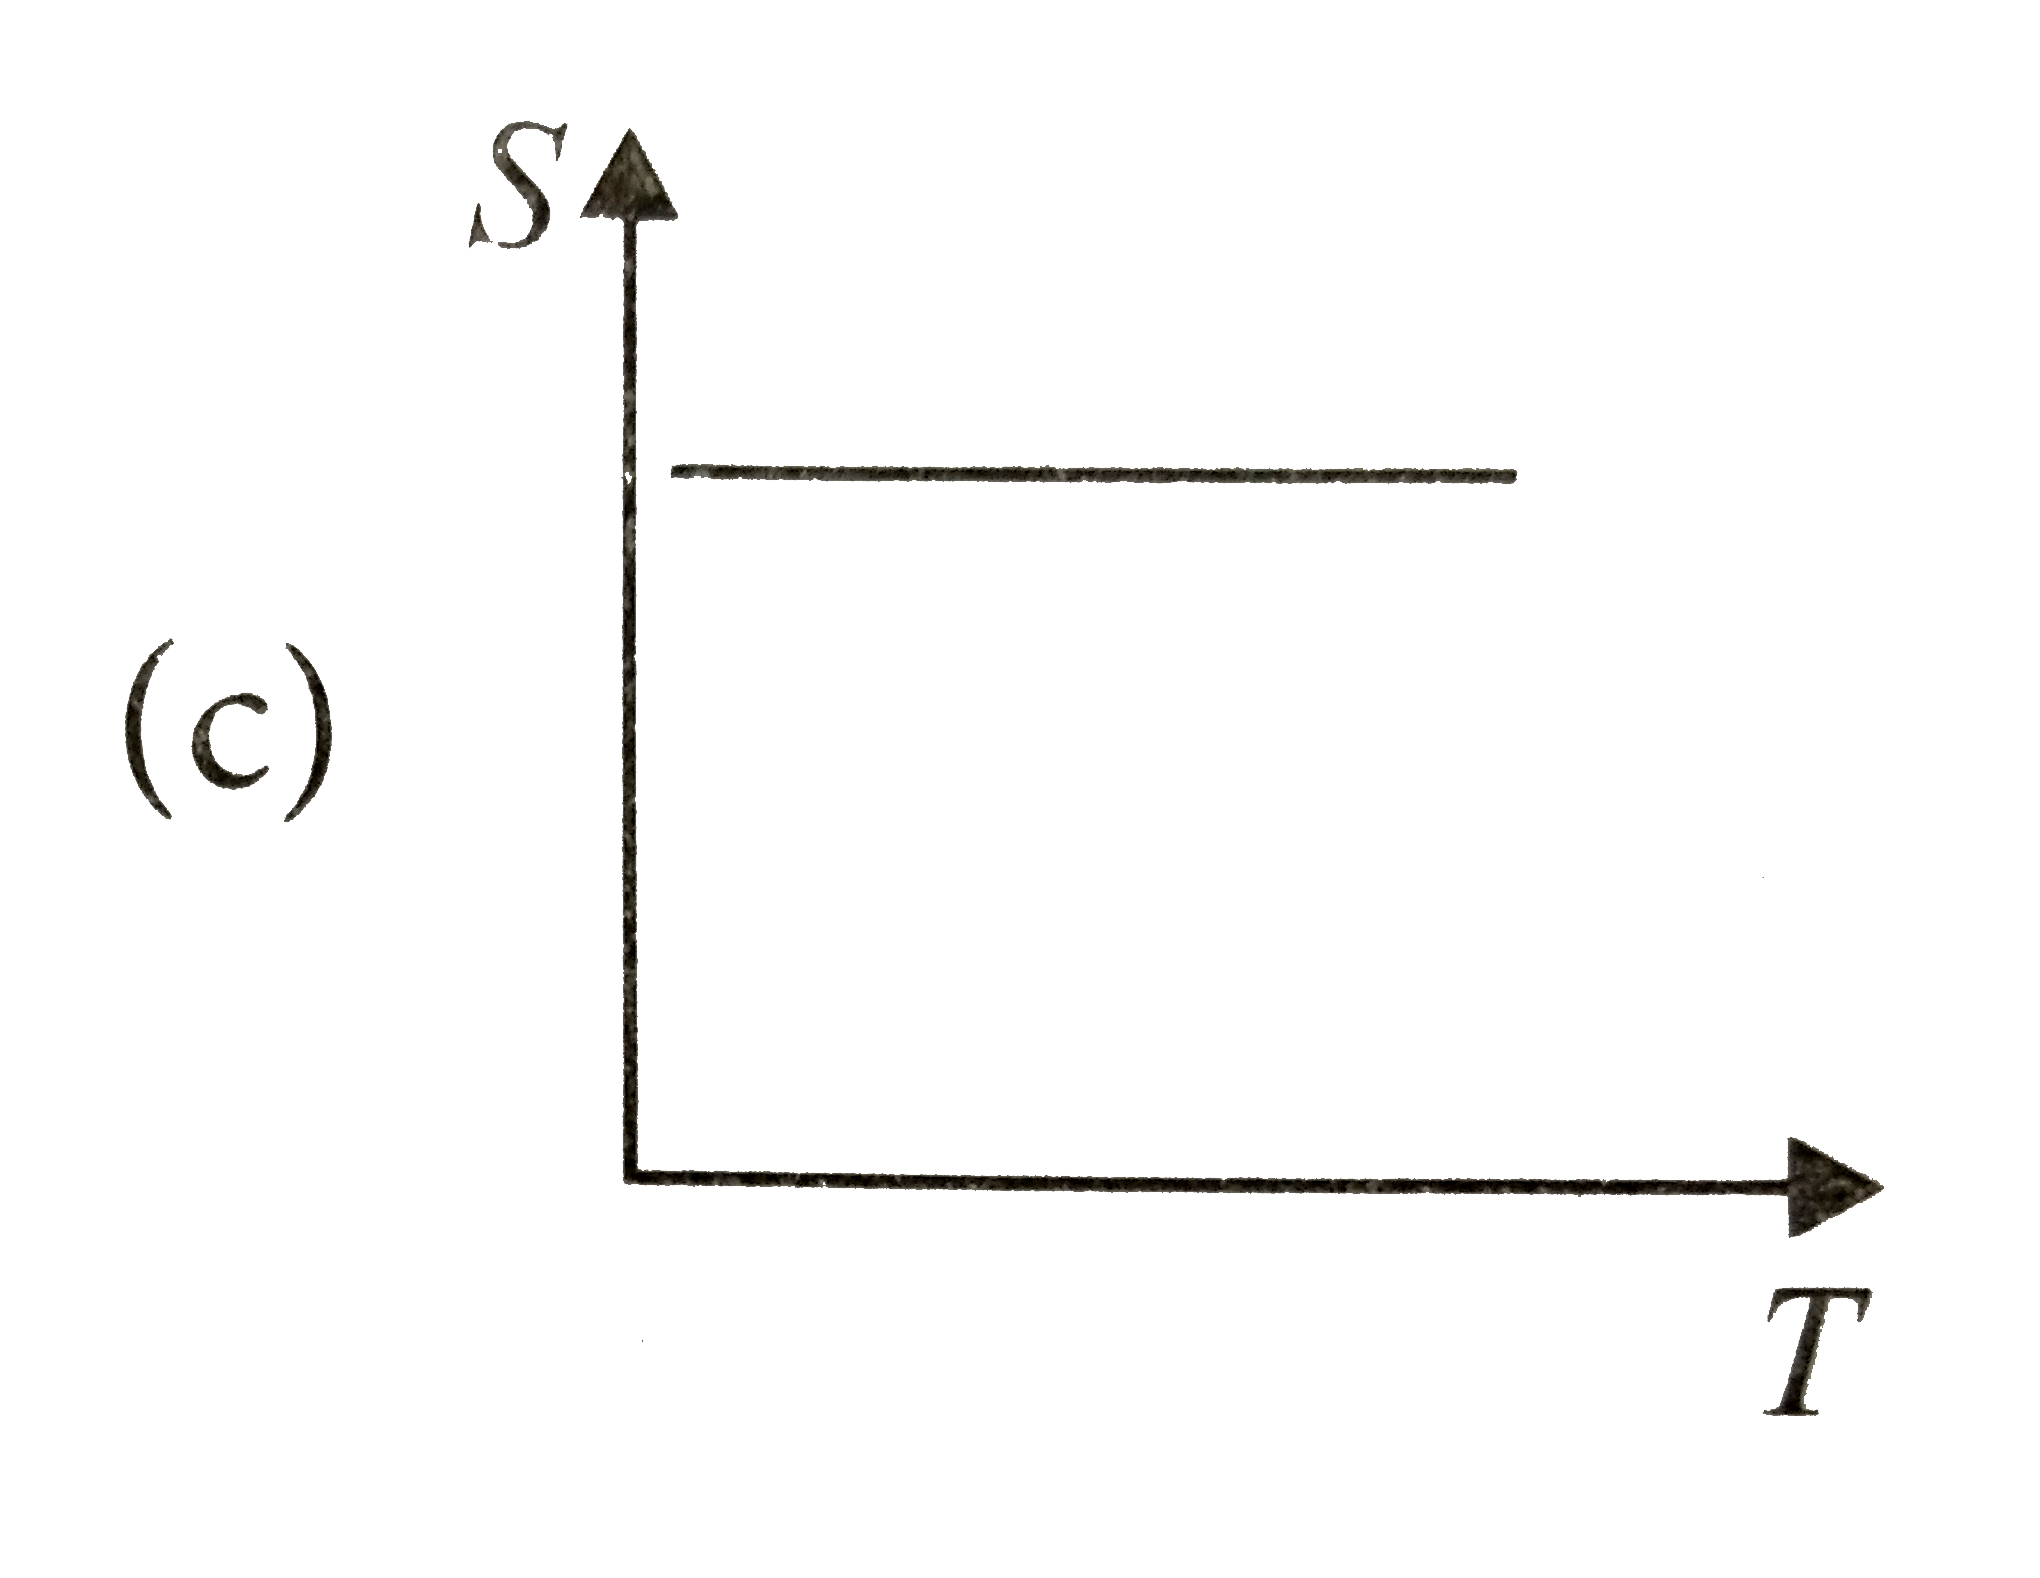
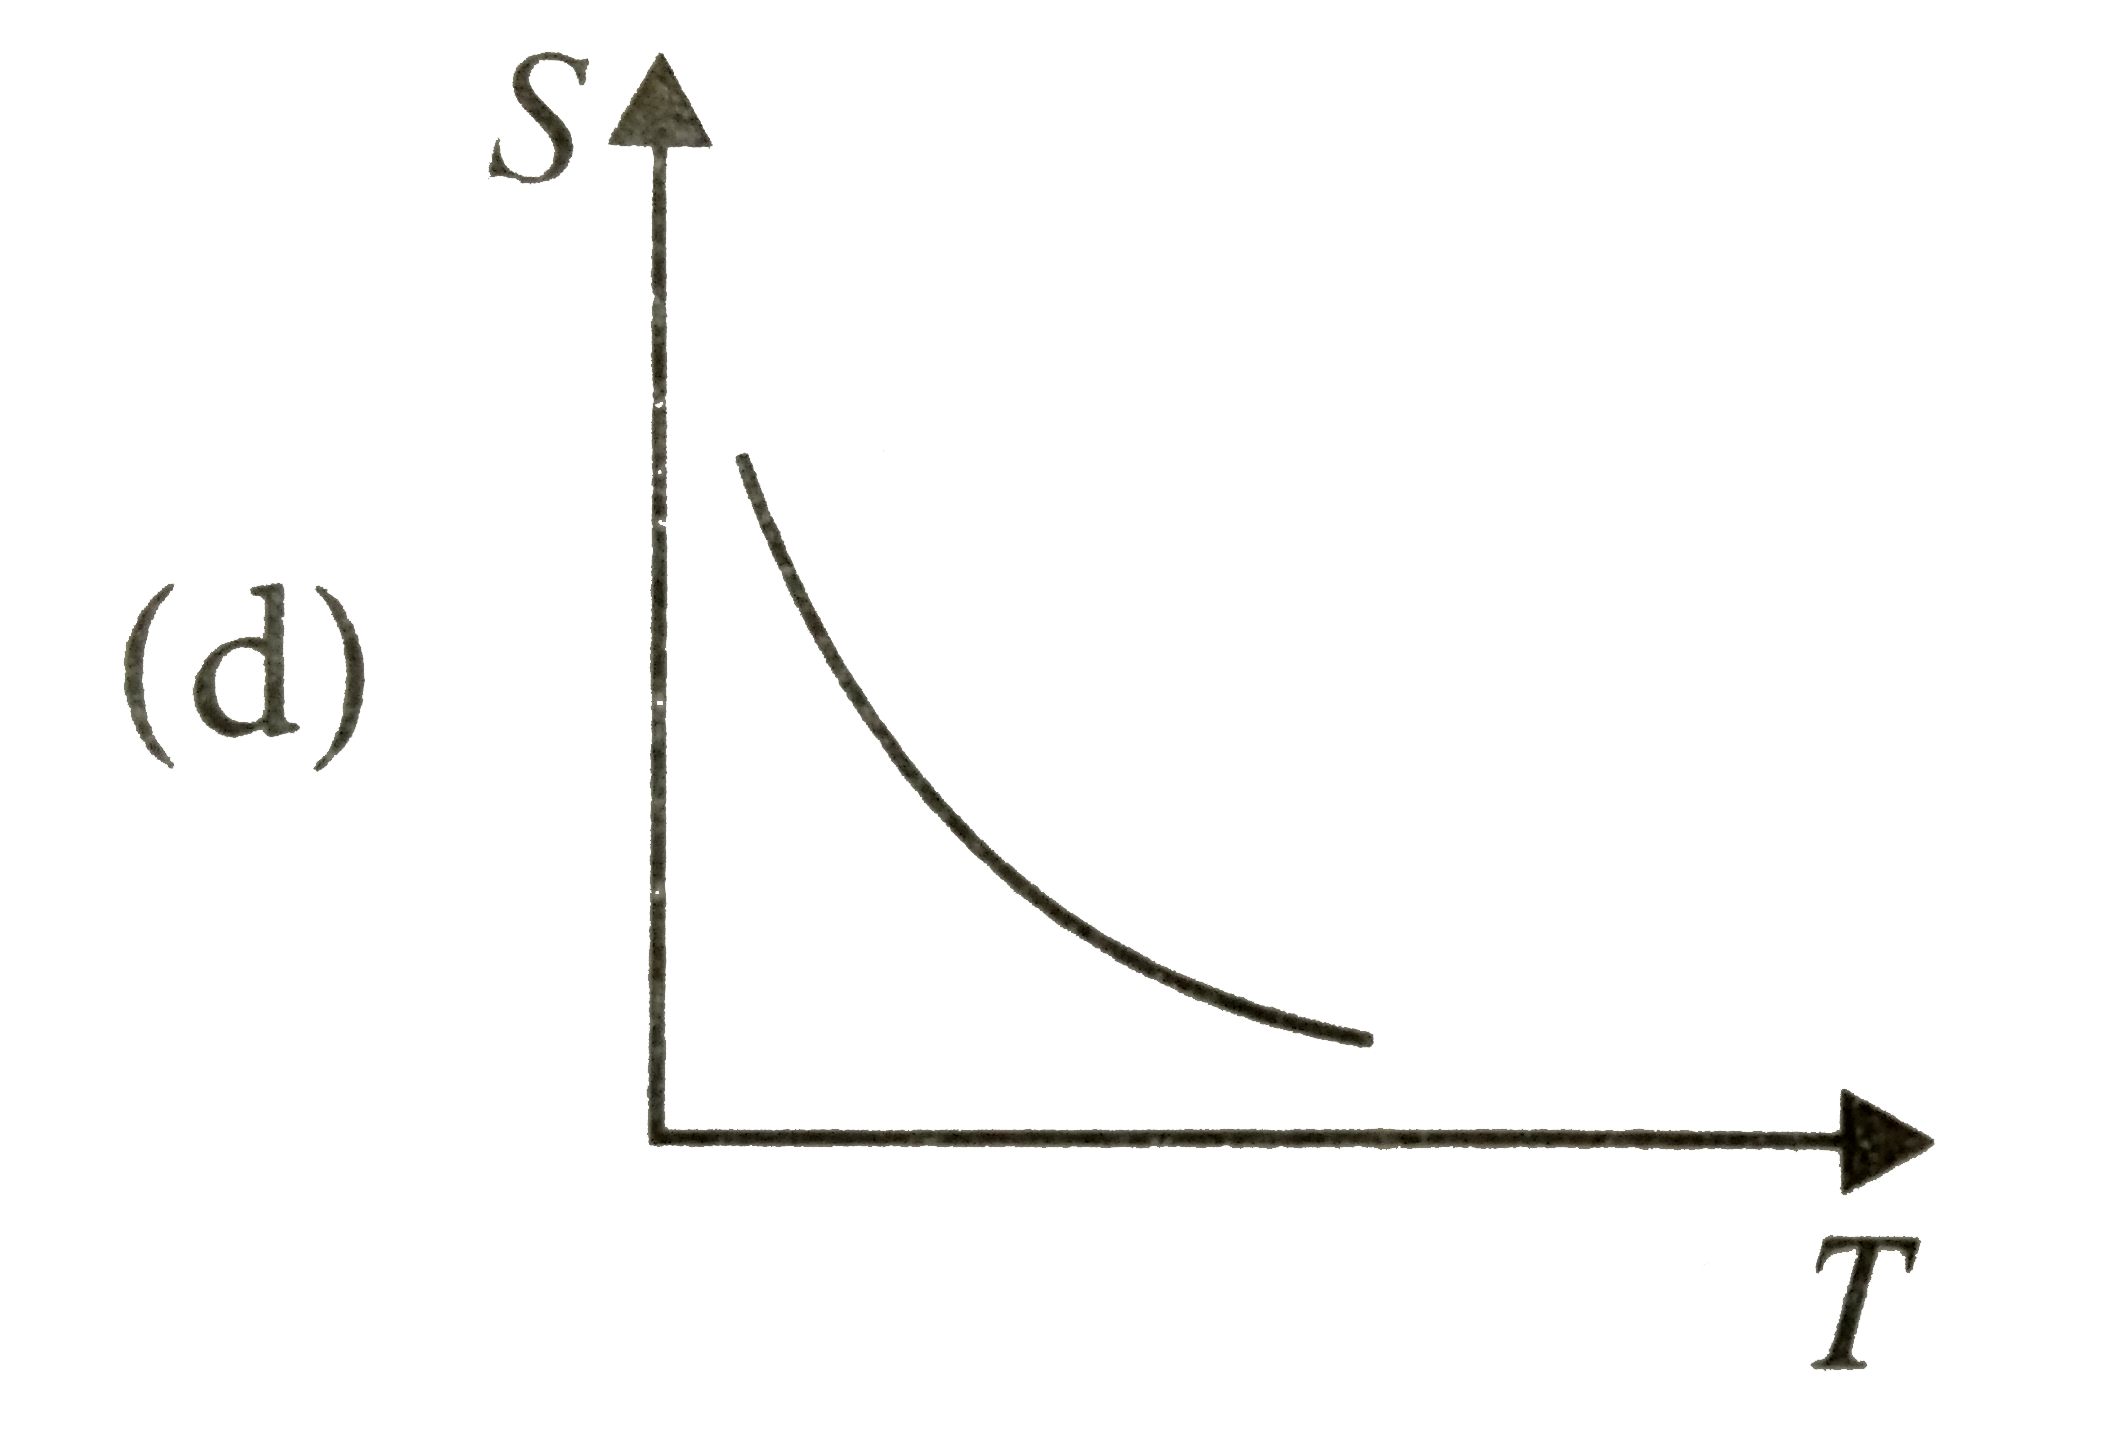
Which graph represents the variation of surface tension with temperature over small temperature ranges for water?


The correct Answer is:B
To determine which graph represents the variation of surface tension with temperature over small temperature ranges for water, we can follow these steps:
Step 1: Understand the relationship between surface tension and temperature
Surface tension is a property of liquids that decreases as the temperature increases. This means that as the temperature rises, the surface tension of water will decrease.
Step 2: Use the equation for surface tension variation
The variation of surface tension (T) with temperature (t) can be expressed with the following linear equation for small temperature differences:
T=T0(1−αt)
Where:
- T0 is the surface tension at 0 degrees Celsius,
- α is the temperature coefficient of surface tension,
- t is the temperature in degrees Celsius.
Step 3: Analyze the equation
From the equation, we can see that:
- As temperature t increases, the term (1−αt) decreases.
- This indicates that T (surface tension) decreases linearly with increasing temperature.
Step 4: Identify the graph type
Since the relationship is linear and has a negative slope (indicating that surface tension decreases with increasing temperature), the graph that represents this relationship will be a straight line that slopes downwards.
Step 5: Select the correct graph
Among the options provided:
- A negative slope graph represents the linear decrease of surface tension with temperature.
- Therefore, the correct answer is option B, which depicts a linear graph with a negative slope.
Final Answer
The graph that represents the variation of surface tension with temperature over small temperature ranges for water is option B (a linear graph with a negative slope).
---
Surface tension is a property of liquids that decreases as the temperature increases. This means that as the temperature rises, the surface tension of water will decrease.
The variation of surface tension (T) with temperature (t) can be expressed with the following linear equation for small temperature differences:
T=T0(1−αt)
Where:
- T0 is the surface tension at 0 degrees Celsius,
- α is the temperature coefficient of surface tension,
- t is the temperature in degrees Celsius.
From the equation, we can see that:
- As temperature t increases, the term (1−αt) decreases.
- This indicates that T (surface tension) decreases linearly with increasing temperature.
Since the relationship is linear and has a negative slope (indicating that surface tension decreases with increasing temperature), the graph that represents this relationship will be a straight line that slopes downwards.
Among the options provided:
- A negative slope graph represents the linear decrease of surface tension with temperature.
- Therefore, the correct answer is option B, which depicts a linear graph with a negative slope.
The graph that represents the variation of surface tension with temperature over small temperature ranges for water is option B (a linear graph with a negative slope).
Topper's Solved these Questions
- MECHANICAL PROPERTIES OF FLUIDSBOOK - NCERT FINGERTPS ENGLISHCHAPTER - MECHANICAL PROPERTIES OF FLUIDSEXERCISE - Higher Order Thinking Skills
8 Videos
- MECHANICAL PROPERTIES OF FLUIDSBOOK - NCERT FINGERTPS ENGLISHCHAPTER - MECHANICAL PROPERTIES OF FLUIDSEXERCISE - Exemplar Problems
5 Videos
- LAWS OF MOTIONBOOK - NCERT FINGERTPS ENGLISHCHAPTER - LAWS OF MOTIONEXERCISE - Assertion And Reason
15 Videos
- MECHANICAL PROPERTIES OF SOLIDSBOOK - NCERT FINGERTPS ENGLISHCHAPTER - MECHANICAL PROPERTIES OF SOLIDSEXERCISE - Assertion And Reason
15 Videos
Similar Questions
Following is the variation of physical adsorption with temperature.
View SolutionTemperature range for plant growth is
View SolutionDraw a graph to show the variation in density of water with temperature in the temperature range from 0∘C to 10∘C.
View SolutionWhich of the following curve represent variation of density of water with temperature best-
View SolutionThe value of surface tension of a liquid at critical temperature
View SolutionWhat is temperature range of the atmosphere ?
View SolutionWhich of the following graph represents the variation of resistivity (ρ) with temperature (T) for copper?
View SolutionThe graph which represents the variation of mean kinetic energy of moleules with temperature ∘C is ?
View SolutionShow on a graph, the variation of resistivity with temperature for a typical semiconductor.
View SolutionOn increasing temperature , surface tension of water
View Solution
