The graph plotted against adsorption versus pressure P at constant temperature, the Freundich equation at A, B, C respectively are (if n > 1)
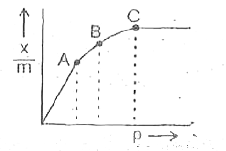
xm=kp,xm=kpyn,xm=kp0
xm=kp,xm=kpn,xm=kp1/n
xm=kp1/n,xm=kpn,xm=kp1/n
xm=kp∞,xm=kp1/n,xm=kpn
The correct Answer is:A
Step by step video & image solution for The graph plotted against adsorption versus pressure P at constant temperature, the Freundich equation at A, B, C respectively are (if n gt 1) by Chemistry experts to help you in doubts & scoring excellent marks in Class 12 exams.
Updated on:21/07/2023Topper's Solved these Questions
- SURFACE CHEMISTRY Book:AAKASH INSTITUTE ENGLISHChapter:SURFACE CHEMISTRY Exercise:Assignment Section - B (Previous year questions)
Explore 14 Videos
- SURFACE CHEMISTRY Book:AAKASH INSTITUTE ENGLISHChapter:SURFACE CHEMISTRY Exercise:Assignment Section - B (Questions asked prior to medical Ent . Exams . 2005)
Explore 10 Videos
- SURFACE CHEMISTRY Book:AAKASH INSTITUTE ENGLISHChapter:SURFACE CHEMISTRY Exercise:Exercise
Explore 20 Videos
- STRUCTURE OF ATOM Book:AAKASH INSTITUTE ENGLISHChapter:STRUCTURE OF ATOM Exercise:ASSIGNMENT ( SECTION -J) Aakash Challengers Questions
Explore 12 Videos
- TEST 1Book:AAKASH INSTITUTE ENGLISHChapter:TEST 1Exercise:EXAMPLE
Explore 134 Videos
Similar Questions
Graph between speed v of sound in air and pressure P at a constant temperature is given by
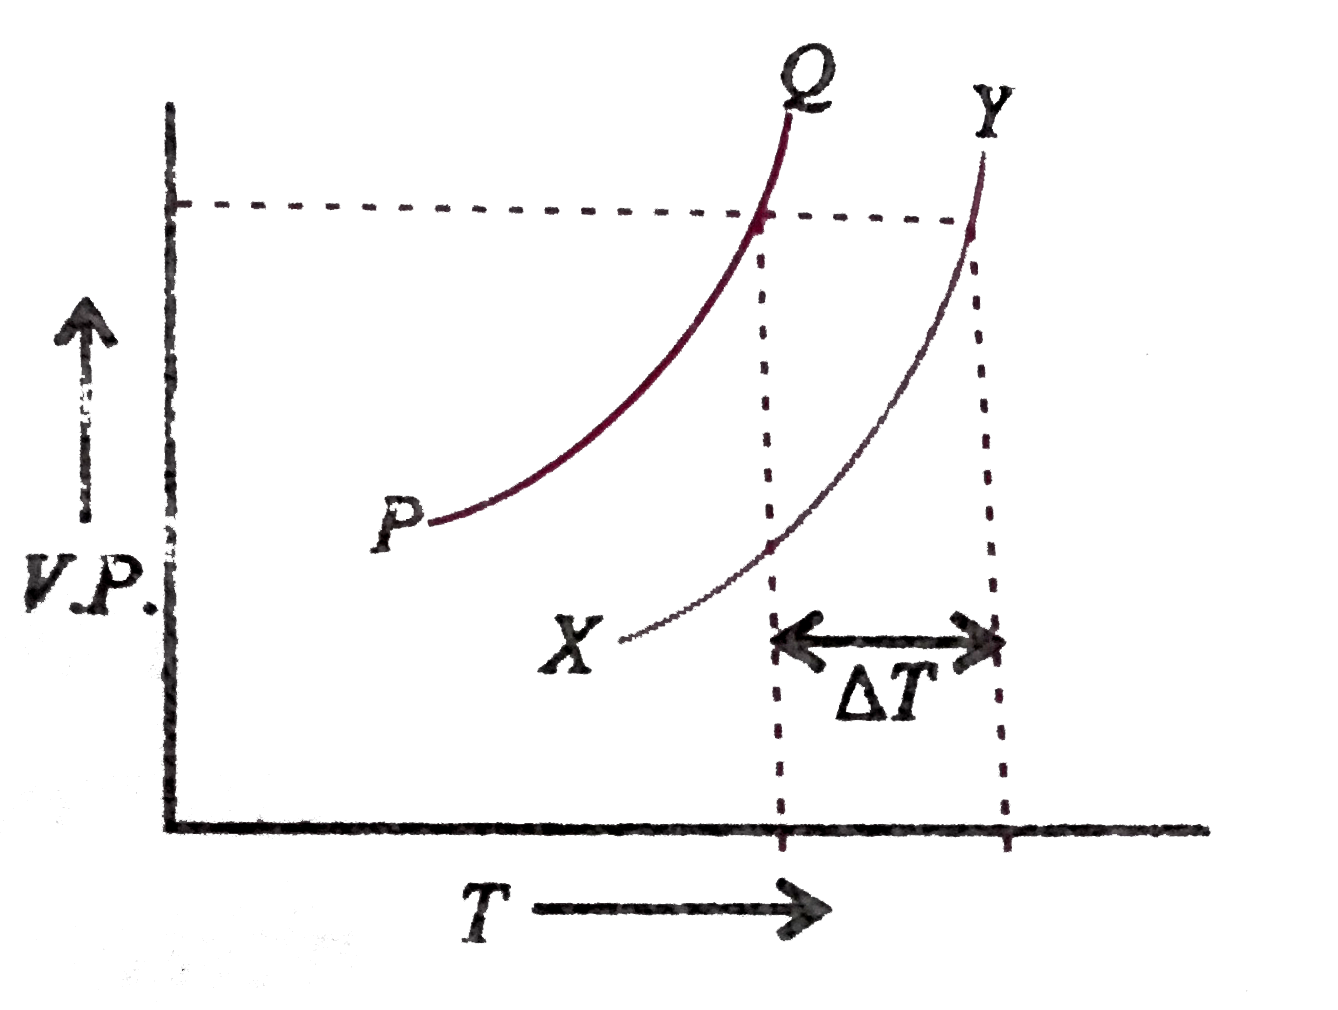
View SolutionIn the graph plotted between vapour pressure (V.P.) and temperature (T),
View SolutionThe given graph shows the vapour pressure - temperature curves for some liquids
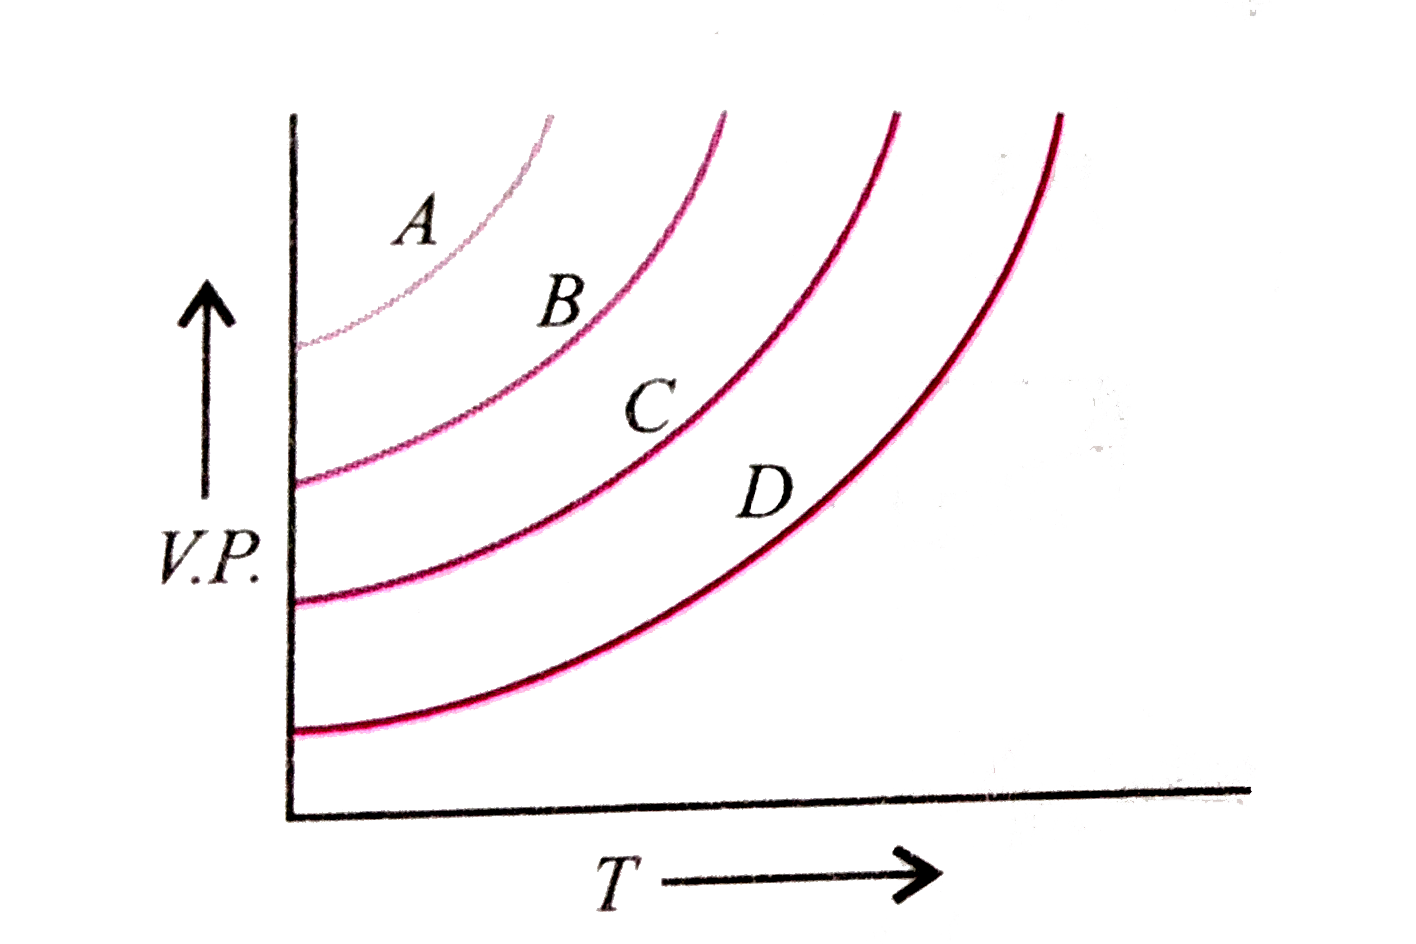
Liquids A,B, C and D respectively are
View SolutionThe graph pressure versus temperature (T) at constant volume is a straight line.(T/F)
View SolutionThe graph between PV vs P at constant temperature is linear parallel to the pressure axis.
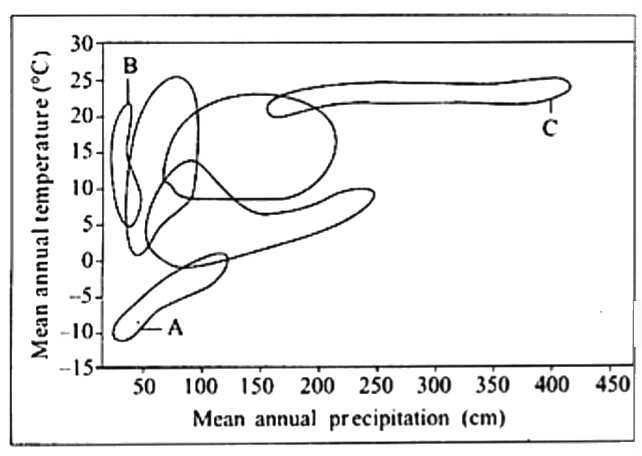
View SolutionThe graph given below is showing biome distribution with respect to annual temperature and precipitation. Identify A, B and C, respectively.
View SolutionFor a given mass of a gas what is the shape of (p) versus (1V) graph at constant temperature ?
View SolutionWhat is the shape of the curve obtained on plotting P against PV at constant temperature for an ideal gas ?
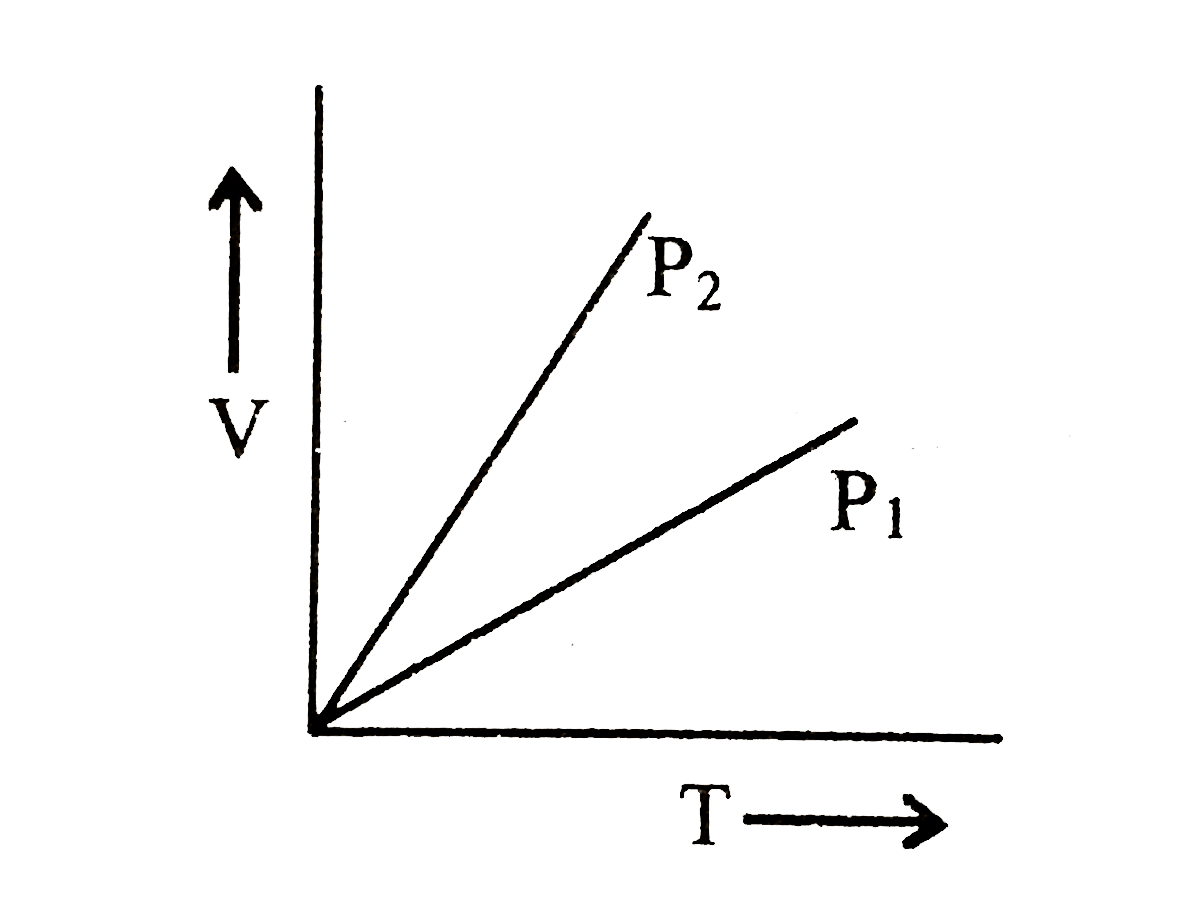
View SolutionFor V versus T curves at constant pressure P1andP2 for and ideal gas shown in figure-
View SolutionAssertion: The plot of volume (V) versus pressure (P) at constant temperature is a hyperbola in the first quadrant.
Reason: V∝1/P at constant temperature.
View Solution
