The variation in length of a substance along three principal directions, with temperature is shown in the fig . The average superficial expansivity of the substance is
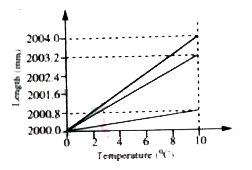
40.00×10⁻⁵/°C
26.67×10⁻⁵/°C
13.33×10⁻⁵/°C
30.93×10⁻⁵/°C
The correct Answer is:B
Topper's Solved these Questions
- THERMAL PROPERTIES OF MATTERBOOK - AAKASH SERIESCHAPTER - THERMAL PROPERTIES OF MATTEREXERCISE - ADDITIONAL PRACTICE EXERCISE (LEVEL - II) PRACTICE SHEET (ADVANCED) Straight Objective Type Questions (Expansion of Liquids :)
6 Videos
- THERMAL PROPERTIES OF MATTERBOOK - AAKASH SERIESCHAPTER - THERMAL PROPERTIES OF MATTEREXERCISE - ADDITIONAL PRACTICE EXERCISE (LEVEL - II) PRACTICE SHEET (ADVANCED) Straight Objective Type Questions (Expansion of Gases & KTG :)
9 Videos
- THERMAL PROPERTIES OF MATTERBOOK - AAKASH SERIESCHAPTER - THERMAL PROPERTIES OF MATTEREXERCISE - ADDITIONAL PRACTICE EXERCISE (LEVEL - II) PRACTICE SHEET (ADVANCED) Straight Objective Type Questions (Thermometry:)
8 Videos
- SYSTEM OF PARTICLES AND ROTATIONAL MOTIONBOOK - AAKASH SERIESCHAPTER - SYSTEM OF PARTICLES AND ROTATIONAL MOTIONEXERCISE - PRACTICE EXERCISE
99 Videos
- THERMODYNAMICSBOOK - AAKASH SERIESCHAPTER - THERMODYNAMICSEXERCISE - EXERCISE - 3
33 Videos
Similar Questions
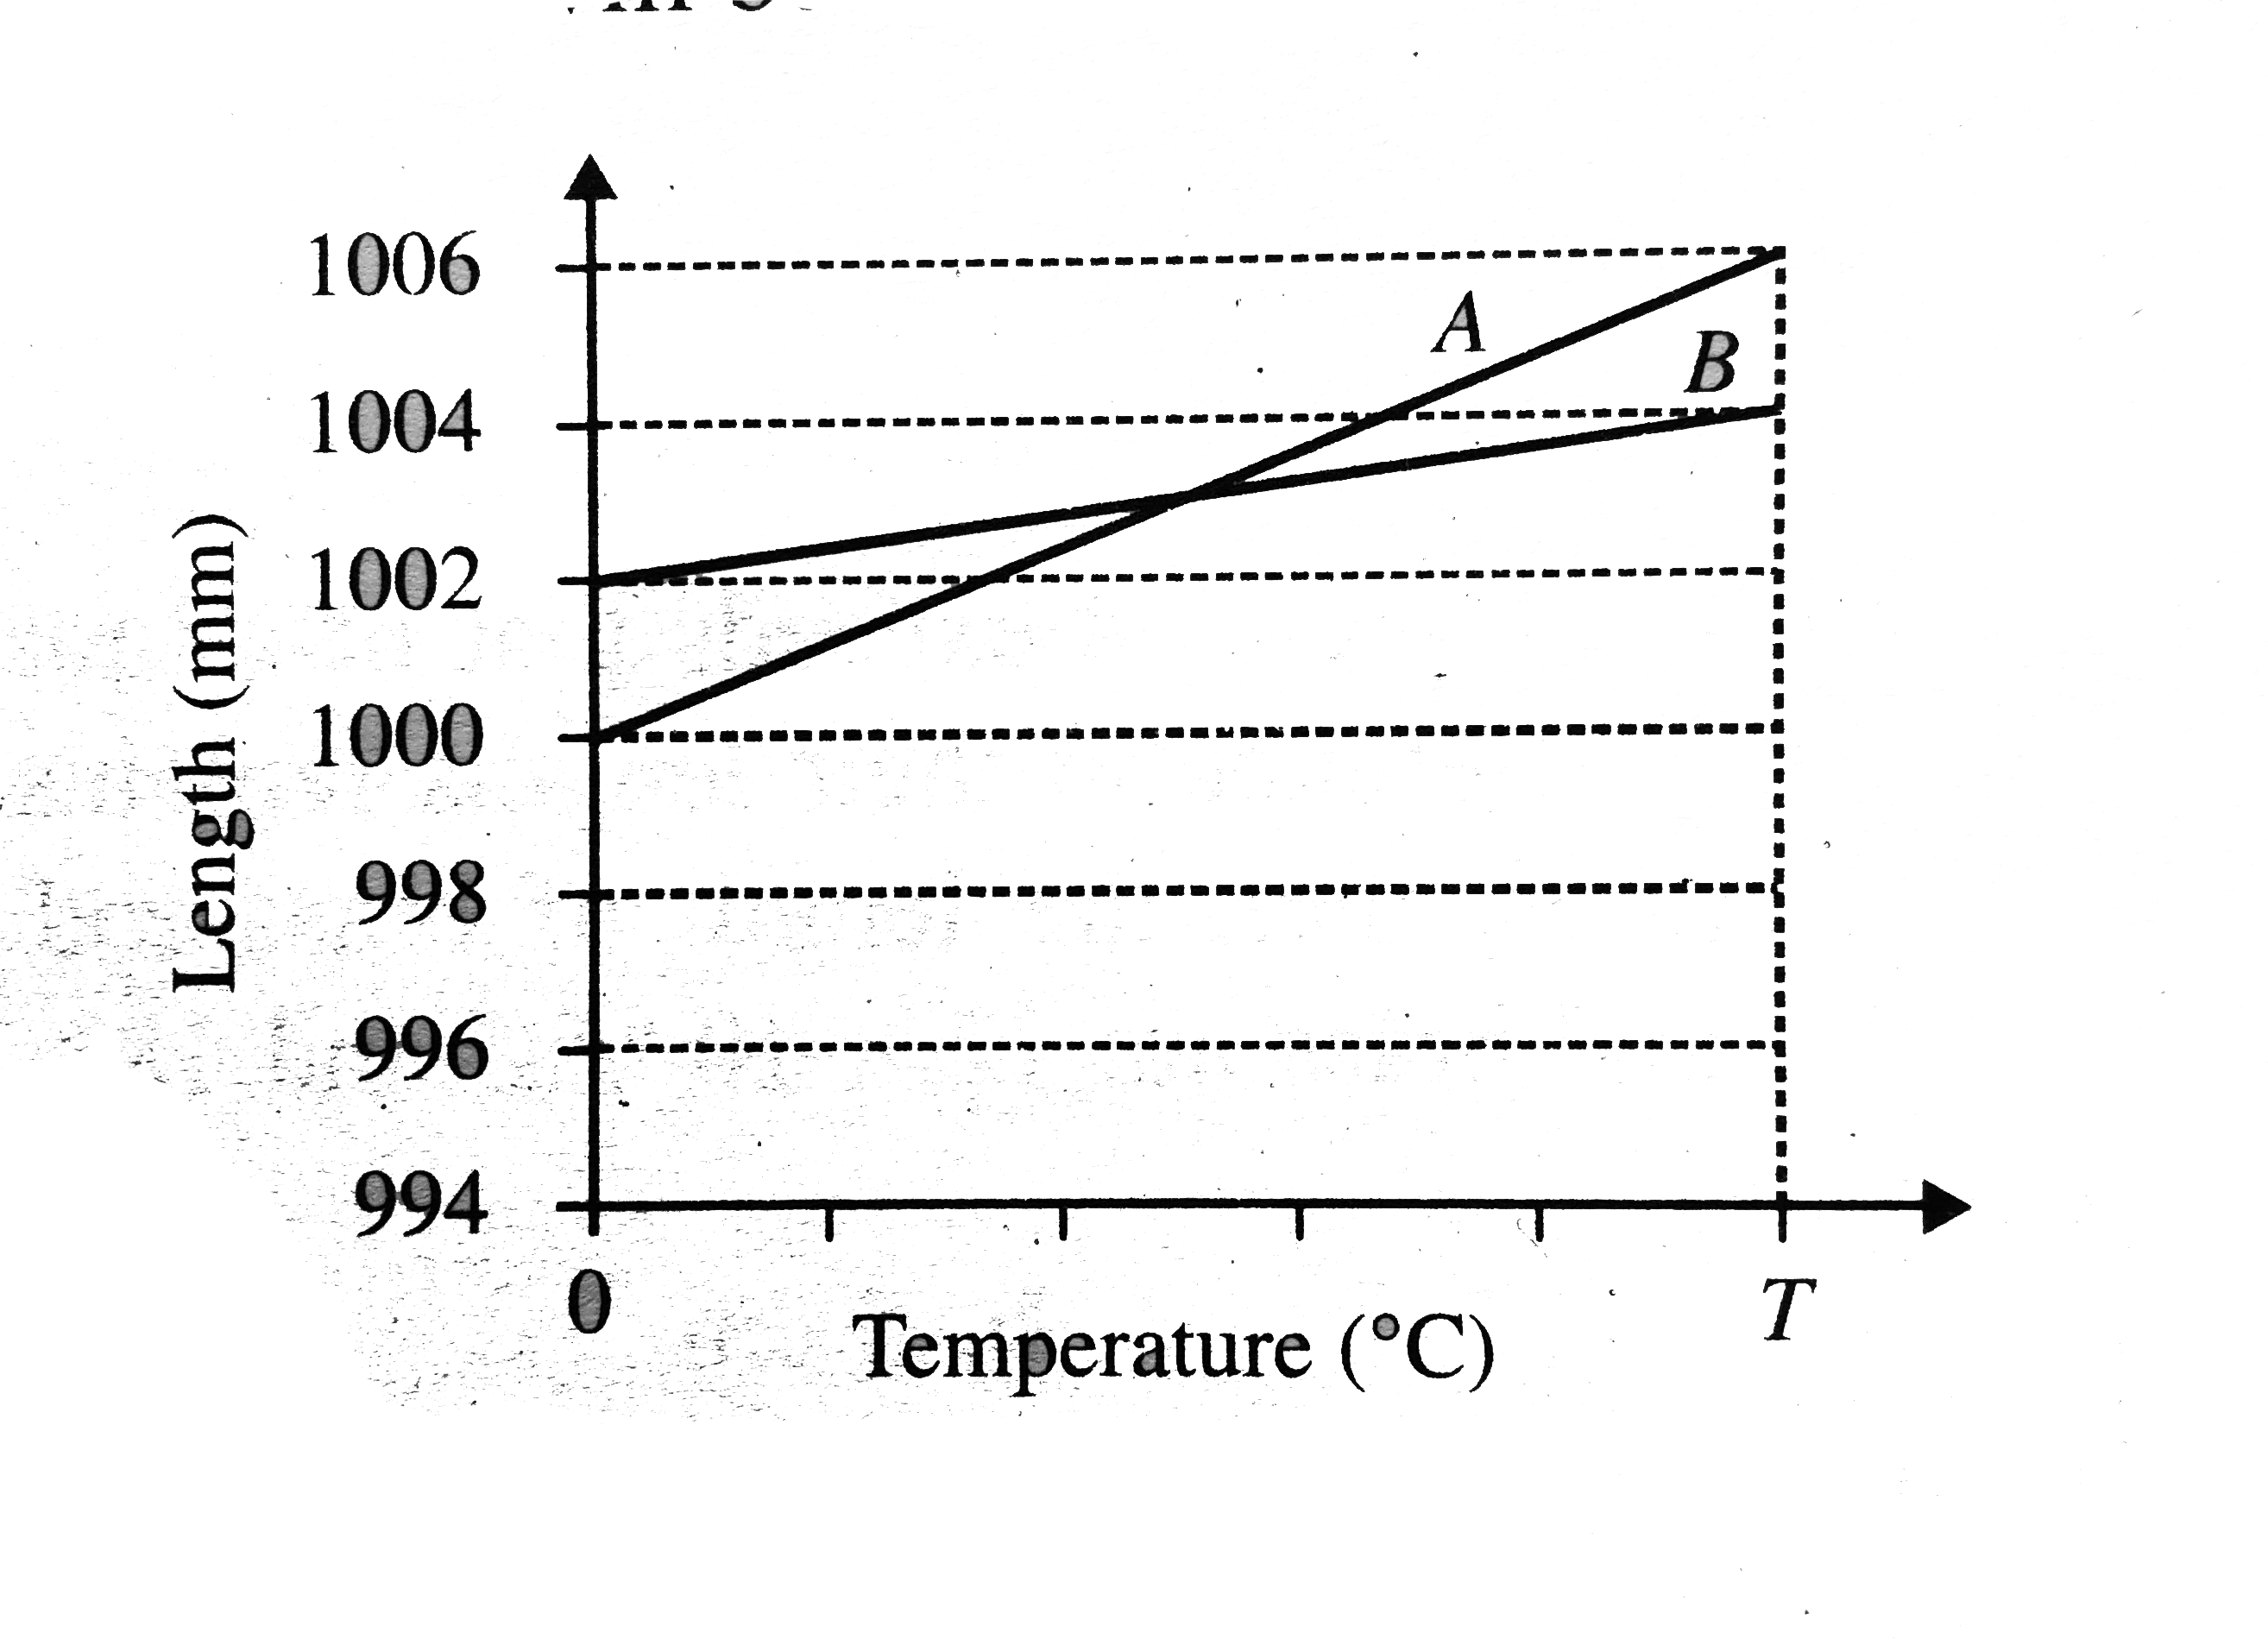
The variation of length of two metal rods A and B with change in temperature is shown in Fig. the coefficient of linear expansion αA for the metal A and the temperature T will be
View Solution
The variation of length of two metal rods A and B with change in temperature is shown in Fig. the coefficient of linear expansion αA for the metal A and the temperature T will be? ( alpha_(A)=3x10^(-6)/ C )
View Solution
Knowledge Check

The variation of length of two metal rods A and B with change in temperature is shown in Fig. the coefficient of linear expansion αA for the metal A and the temperature T will beAαA=3×10⁻⁶/∘C,500∘CBαA=3×10−6/∘C,222.22∘CCαA=27×10−6/∘C,500∘CDαA=27×10−6/∘C,222.22∘C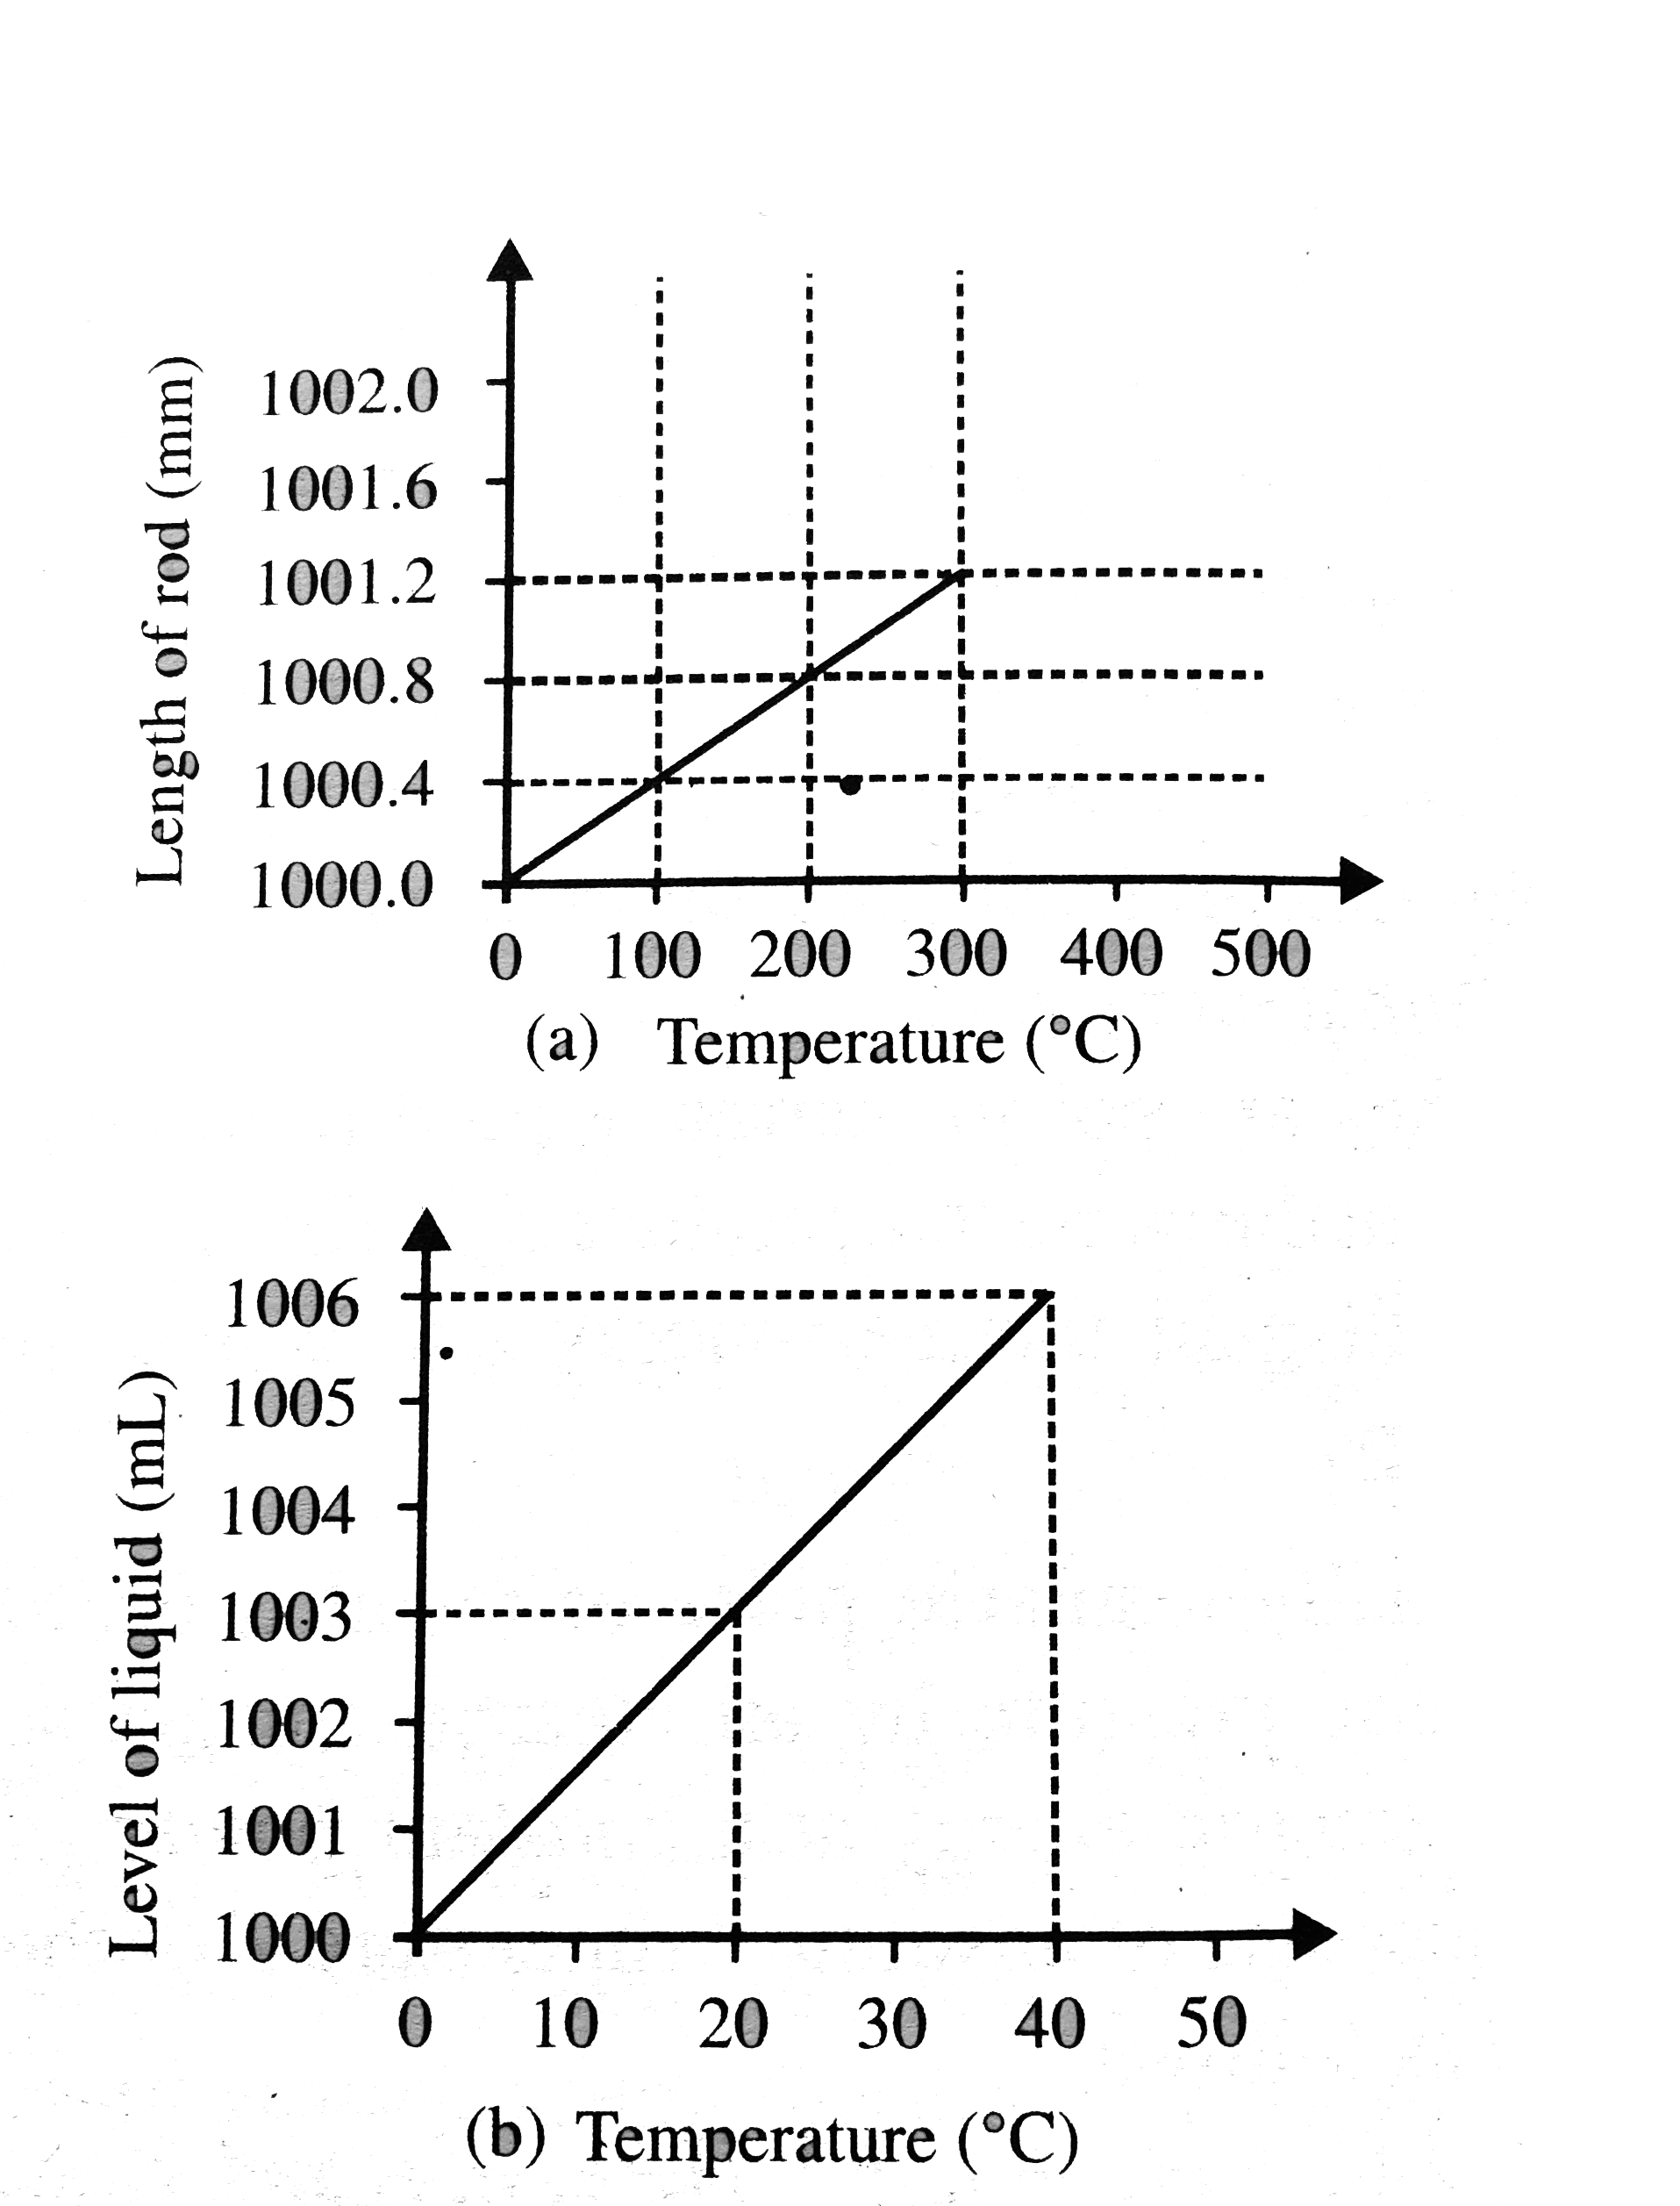
The graph of elongation of rod of a substance A with temperature rise is shown if Fig. A liquid B contained in a cylindrical cessel made up of substance A, graduated in millilitres at 0∘C is heated gradually. The readings of the liquid level in the vessel corresponding to different temperatures are shown in the figure. the real volume expansivity of liquid isA2.7×10−5/∘CB15.4×10−5/∘CC16.2×10−5/∘CD151.2×10−5/∘CThe variation of magnetic susceptibility (χ) with temperature for dimagnetic substance is represented by
A B
B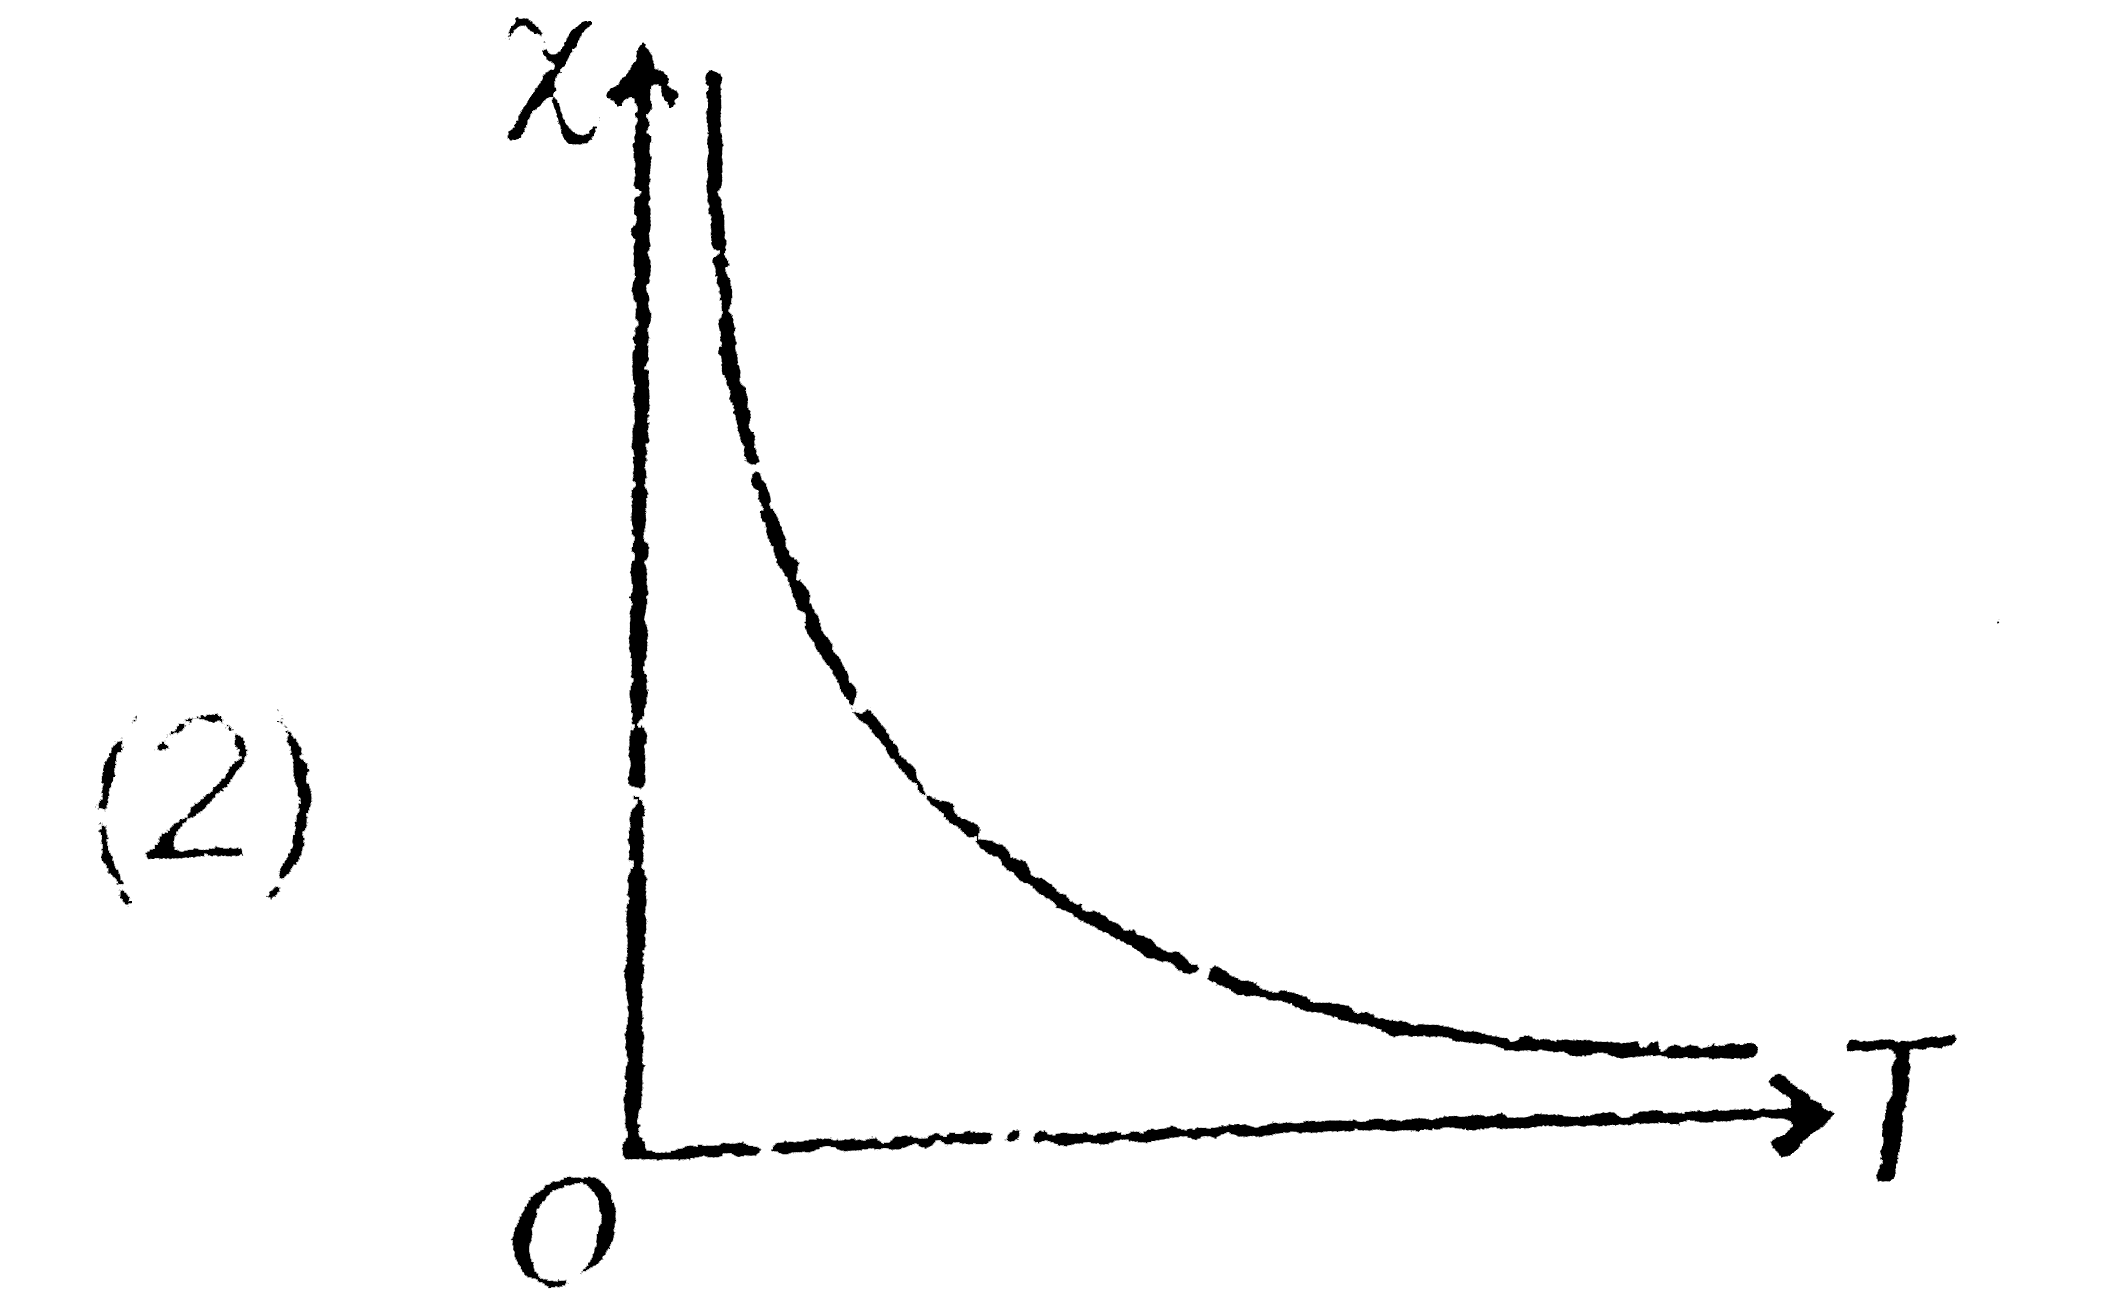 C
C D
D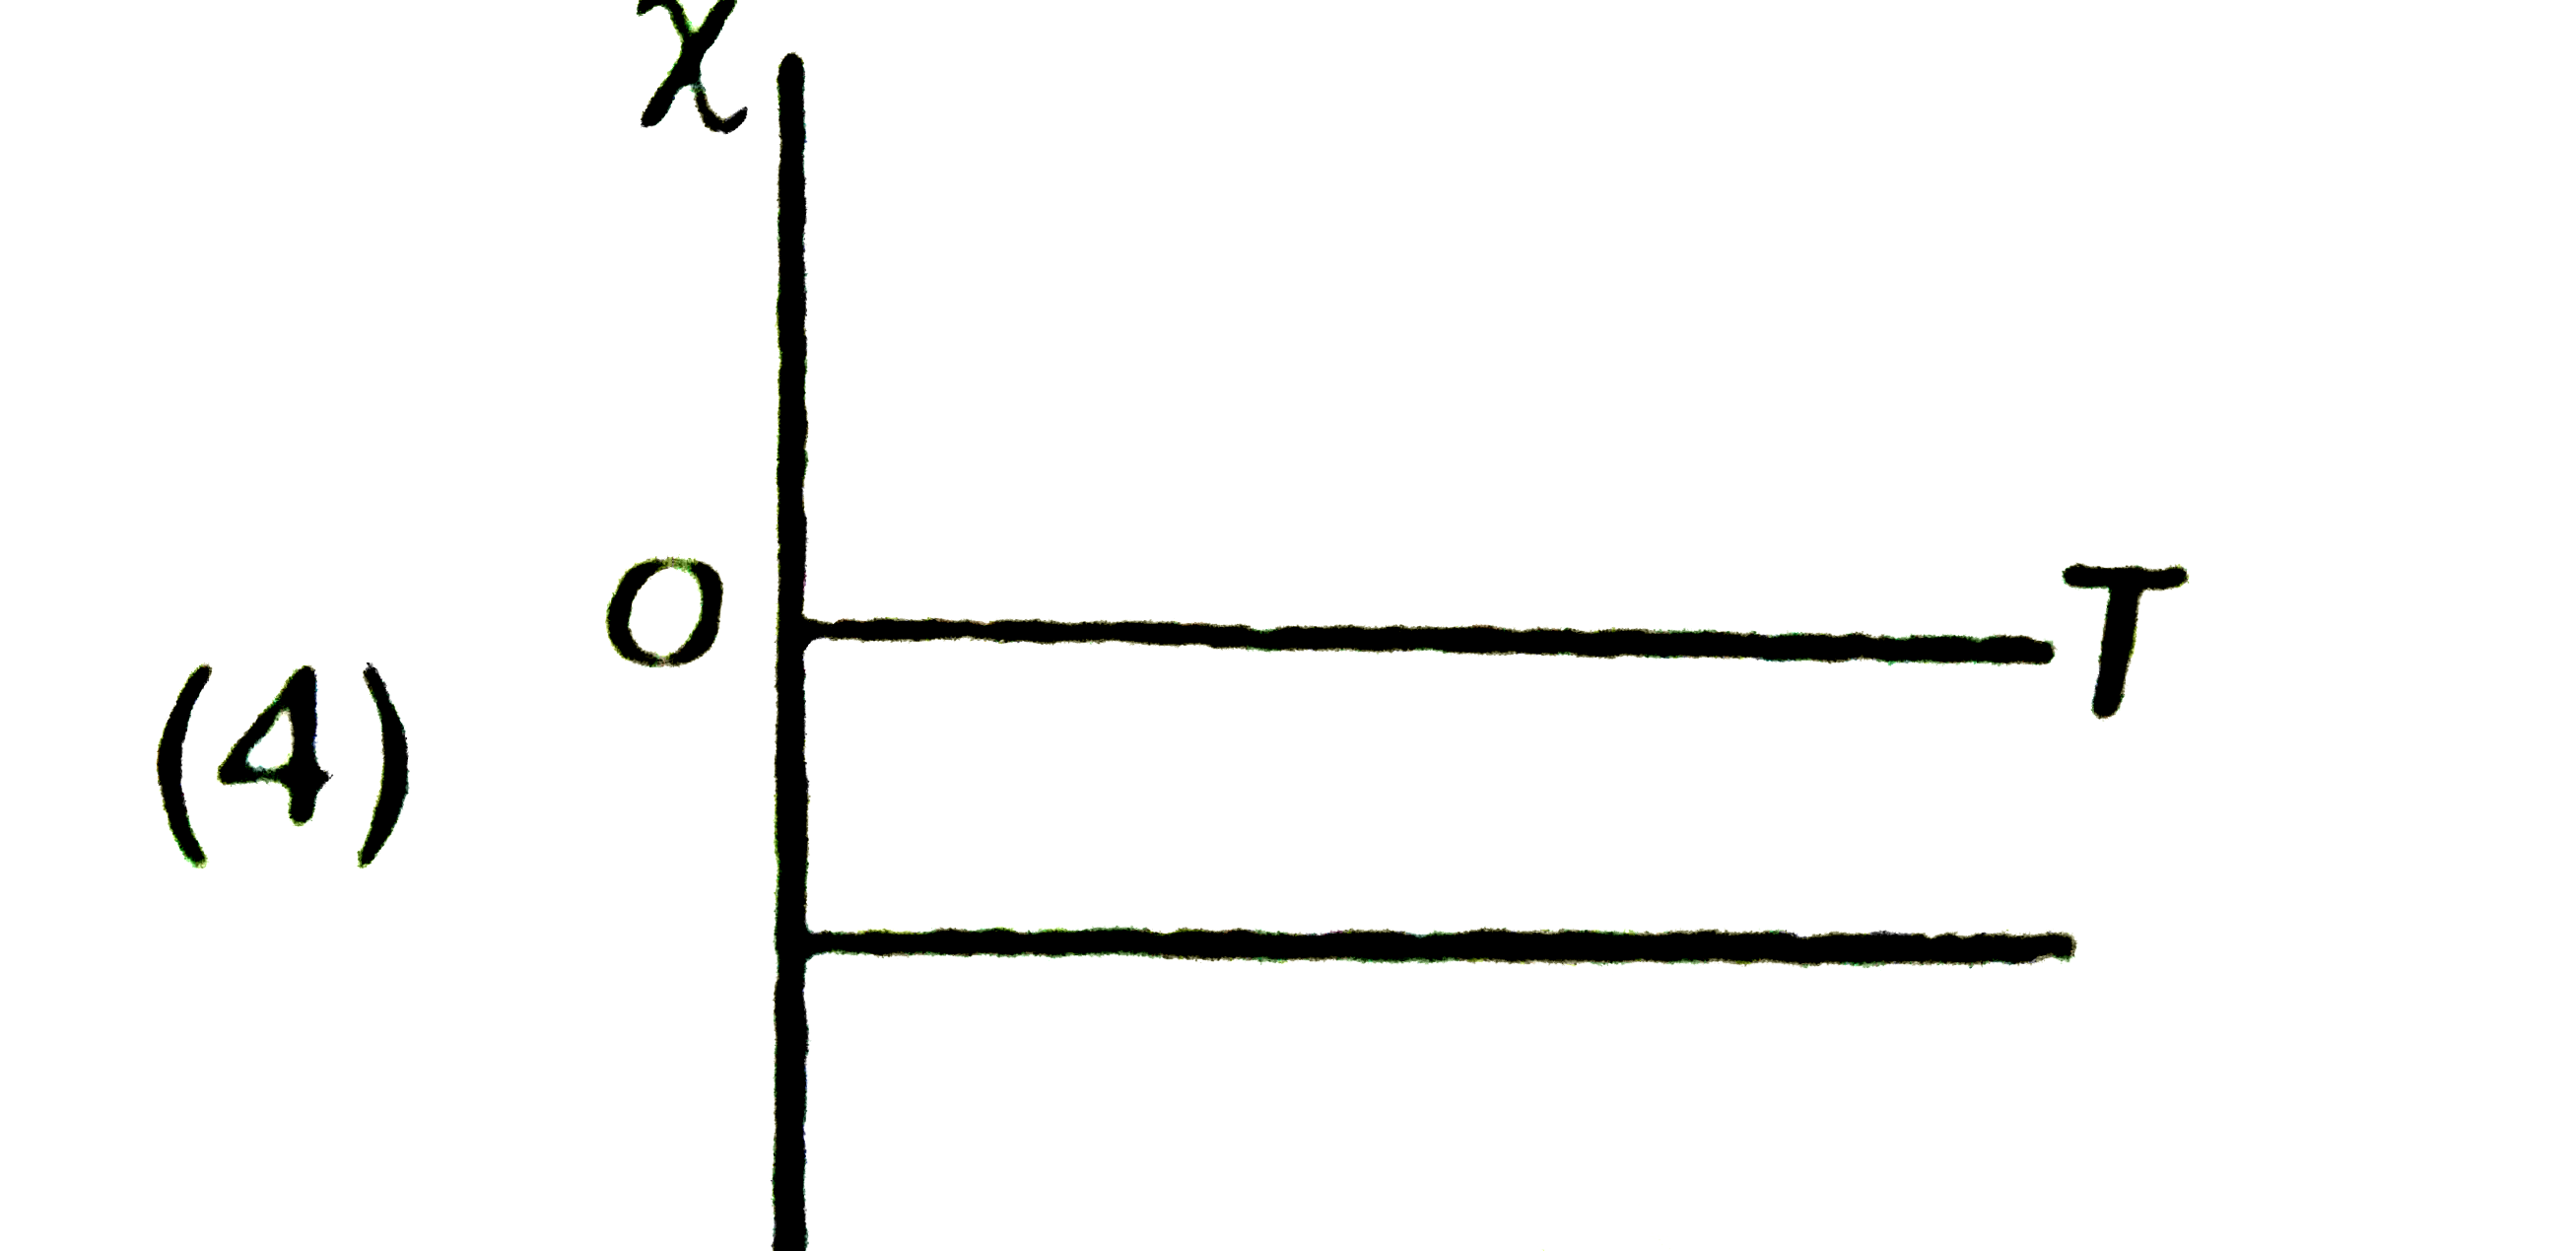
If temperature of a substance increases the average kinetic energy of molecus of the substance _______.
View Solution
The graph of elongation of rod of a substance A with temperature rise is shown if Fig. A liquid B contained in a cylindrical cessel made up of substance A, graduated in millilitres at 0∘C is heated gradually. The readings of the liquid level in the vessel corresponding to different temperatures are shown in the figure. the real volume expansivity of liquid is
View Solution
The graph of elongation of rod of a substance A with temperature rise is shown if Fig. A liquid B contained in a cylindrical cessel made up of substance A, graduated in millilitres at 0∘C is heated gradually. The readings of the liquid level in the vessel corresponding to different temperatures are shown in the figure. the real volume expansivity of liquid is
View SolutionThe variation of magnetic susceptibility (χ) with temperature for dimagnetic substance is represented by
View SolutionA substance initially in solid state at 0∘C is heated. The graph showing the variation in temperature with the amount of heat supplied is shown in Fig. 11.7. If the specific heat capacity of the solid substance is 500 J kg−1^∘C−1, use graph to find : (i) the mass of the substance, and (ii) the specific latent heat of fusion of the substance in the liquid state.
View Solution
