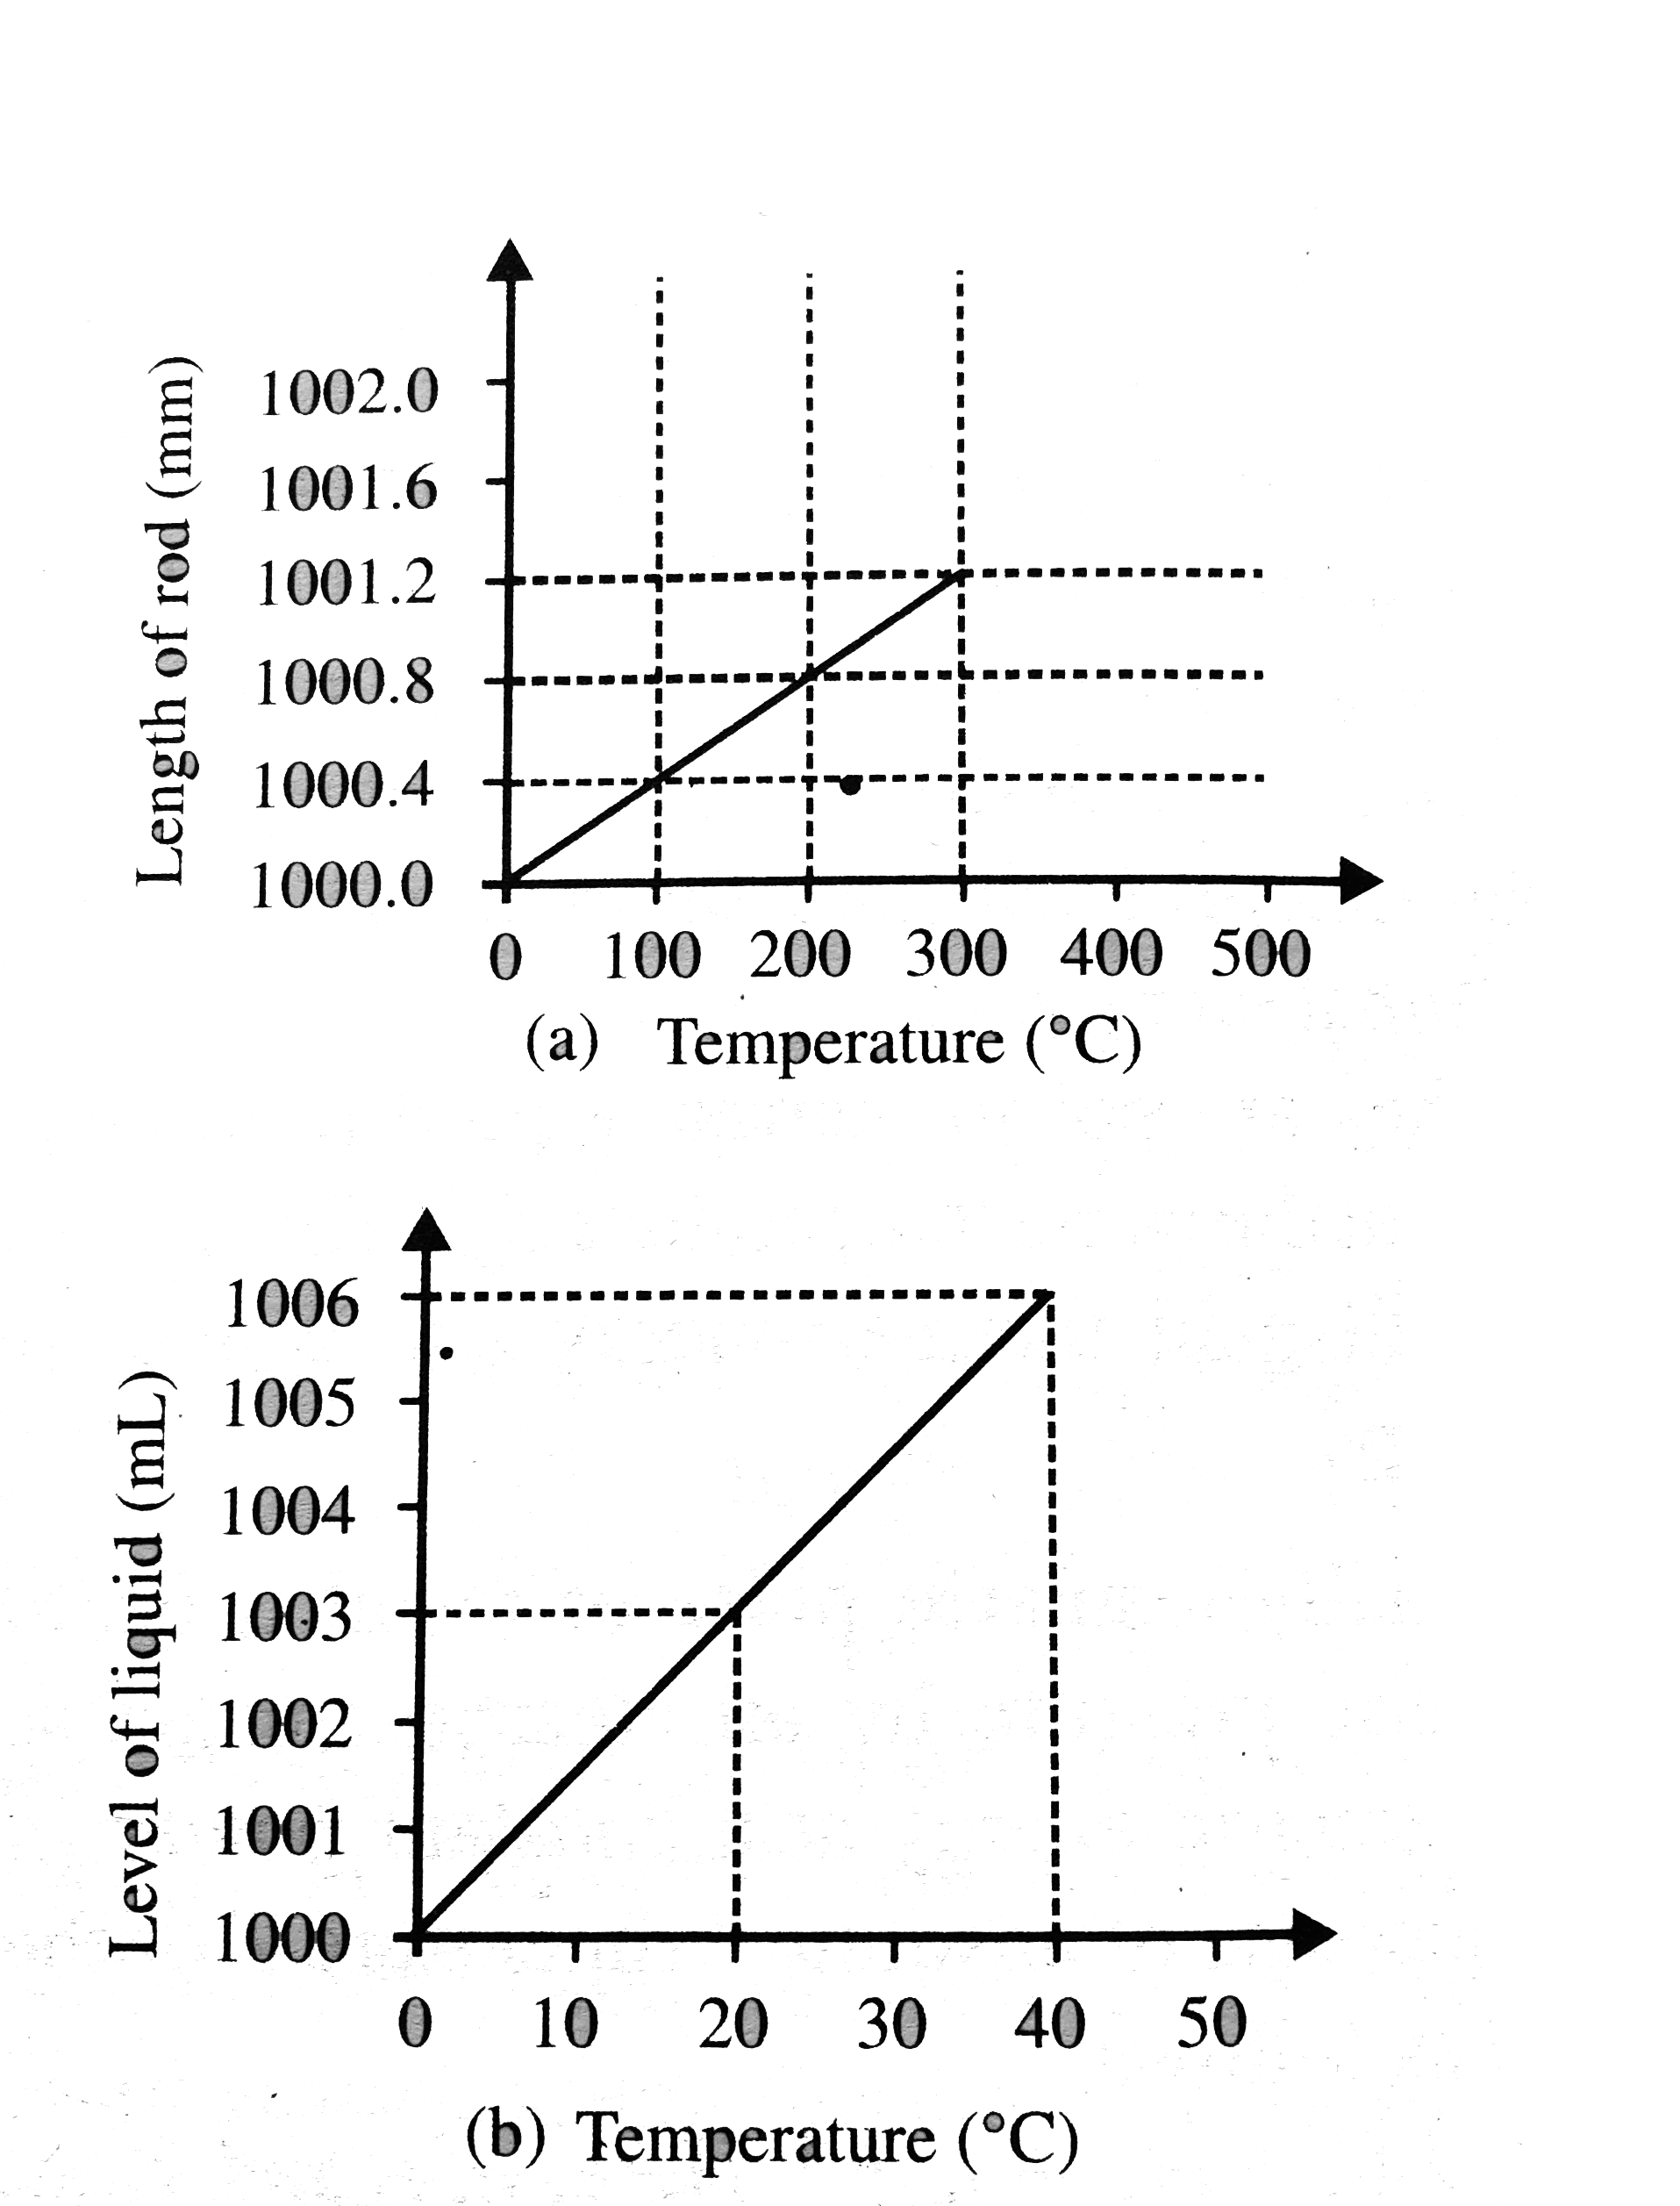
The graph of elongation of rod of a substance A with temperature rise is shown if Fig. A liquid B contained in a cylindrical cessel made up of substance A, graduated in millilitres at is heated gradually. The readings of the liquid level in the vessel corresponding to different temperatures are shown in the figure. the real volume expansivity of liquid is
The correct Answer is:C
Step by step video & image solution for The graph of elongation of rod of a substance A with temperature rise is shown if Fig. A liquid B contained in a cylindrical cessel made up of substance A, graduated in millilitres at 0^@C is heated gradually. The readings of the liquid level in the vessel corresponding to different temperatures are shown in the figure. the real volume expansivity of liquid is by Physics experts to help you in doubts & scoring excellent marks in Class 12 exams.
Updated on:21/07/2023Similar Questions
The variation of vapour pressure of different liquids with temperature is shown in figure
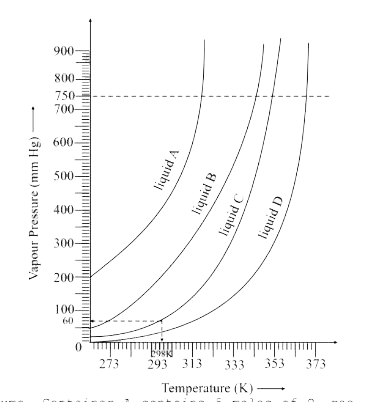
Calculate graphically boiling points of liquids A and B.
View SolutionThe variation of vapour pressure of different liquids with temperature is shown in figure
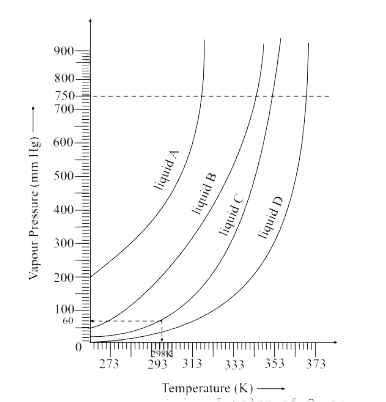
If we take liquid C in a closed vessel and heat it continuously. At what temperature will it boil?
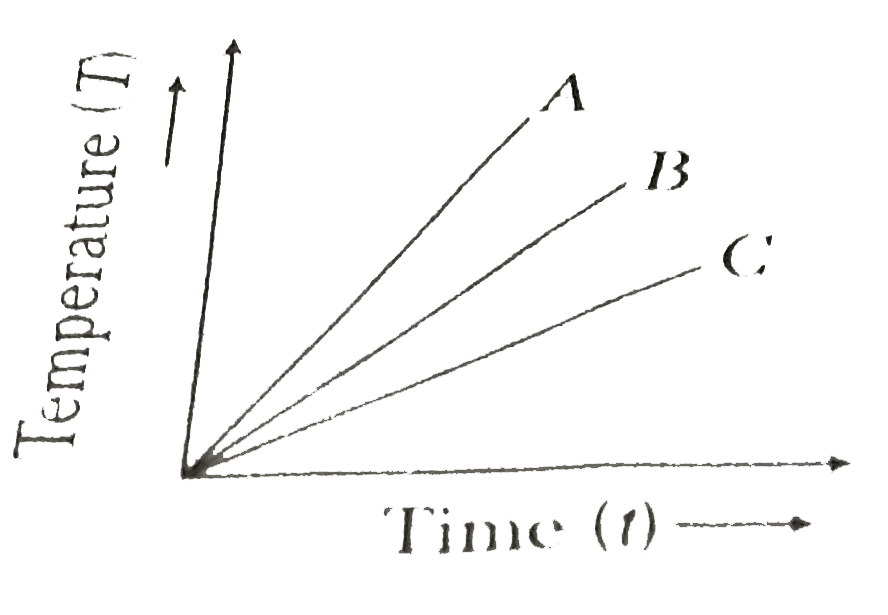
View SolutionThe temperatures versus time graph is shown in figure. Which of the substance A,B and C has the lowest heat capacity if heat is supplied to all of them at equal rates.
View Solution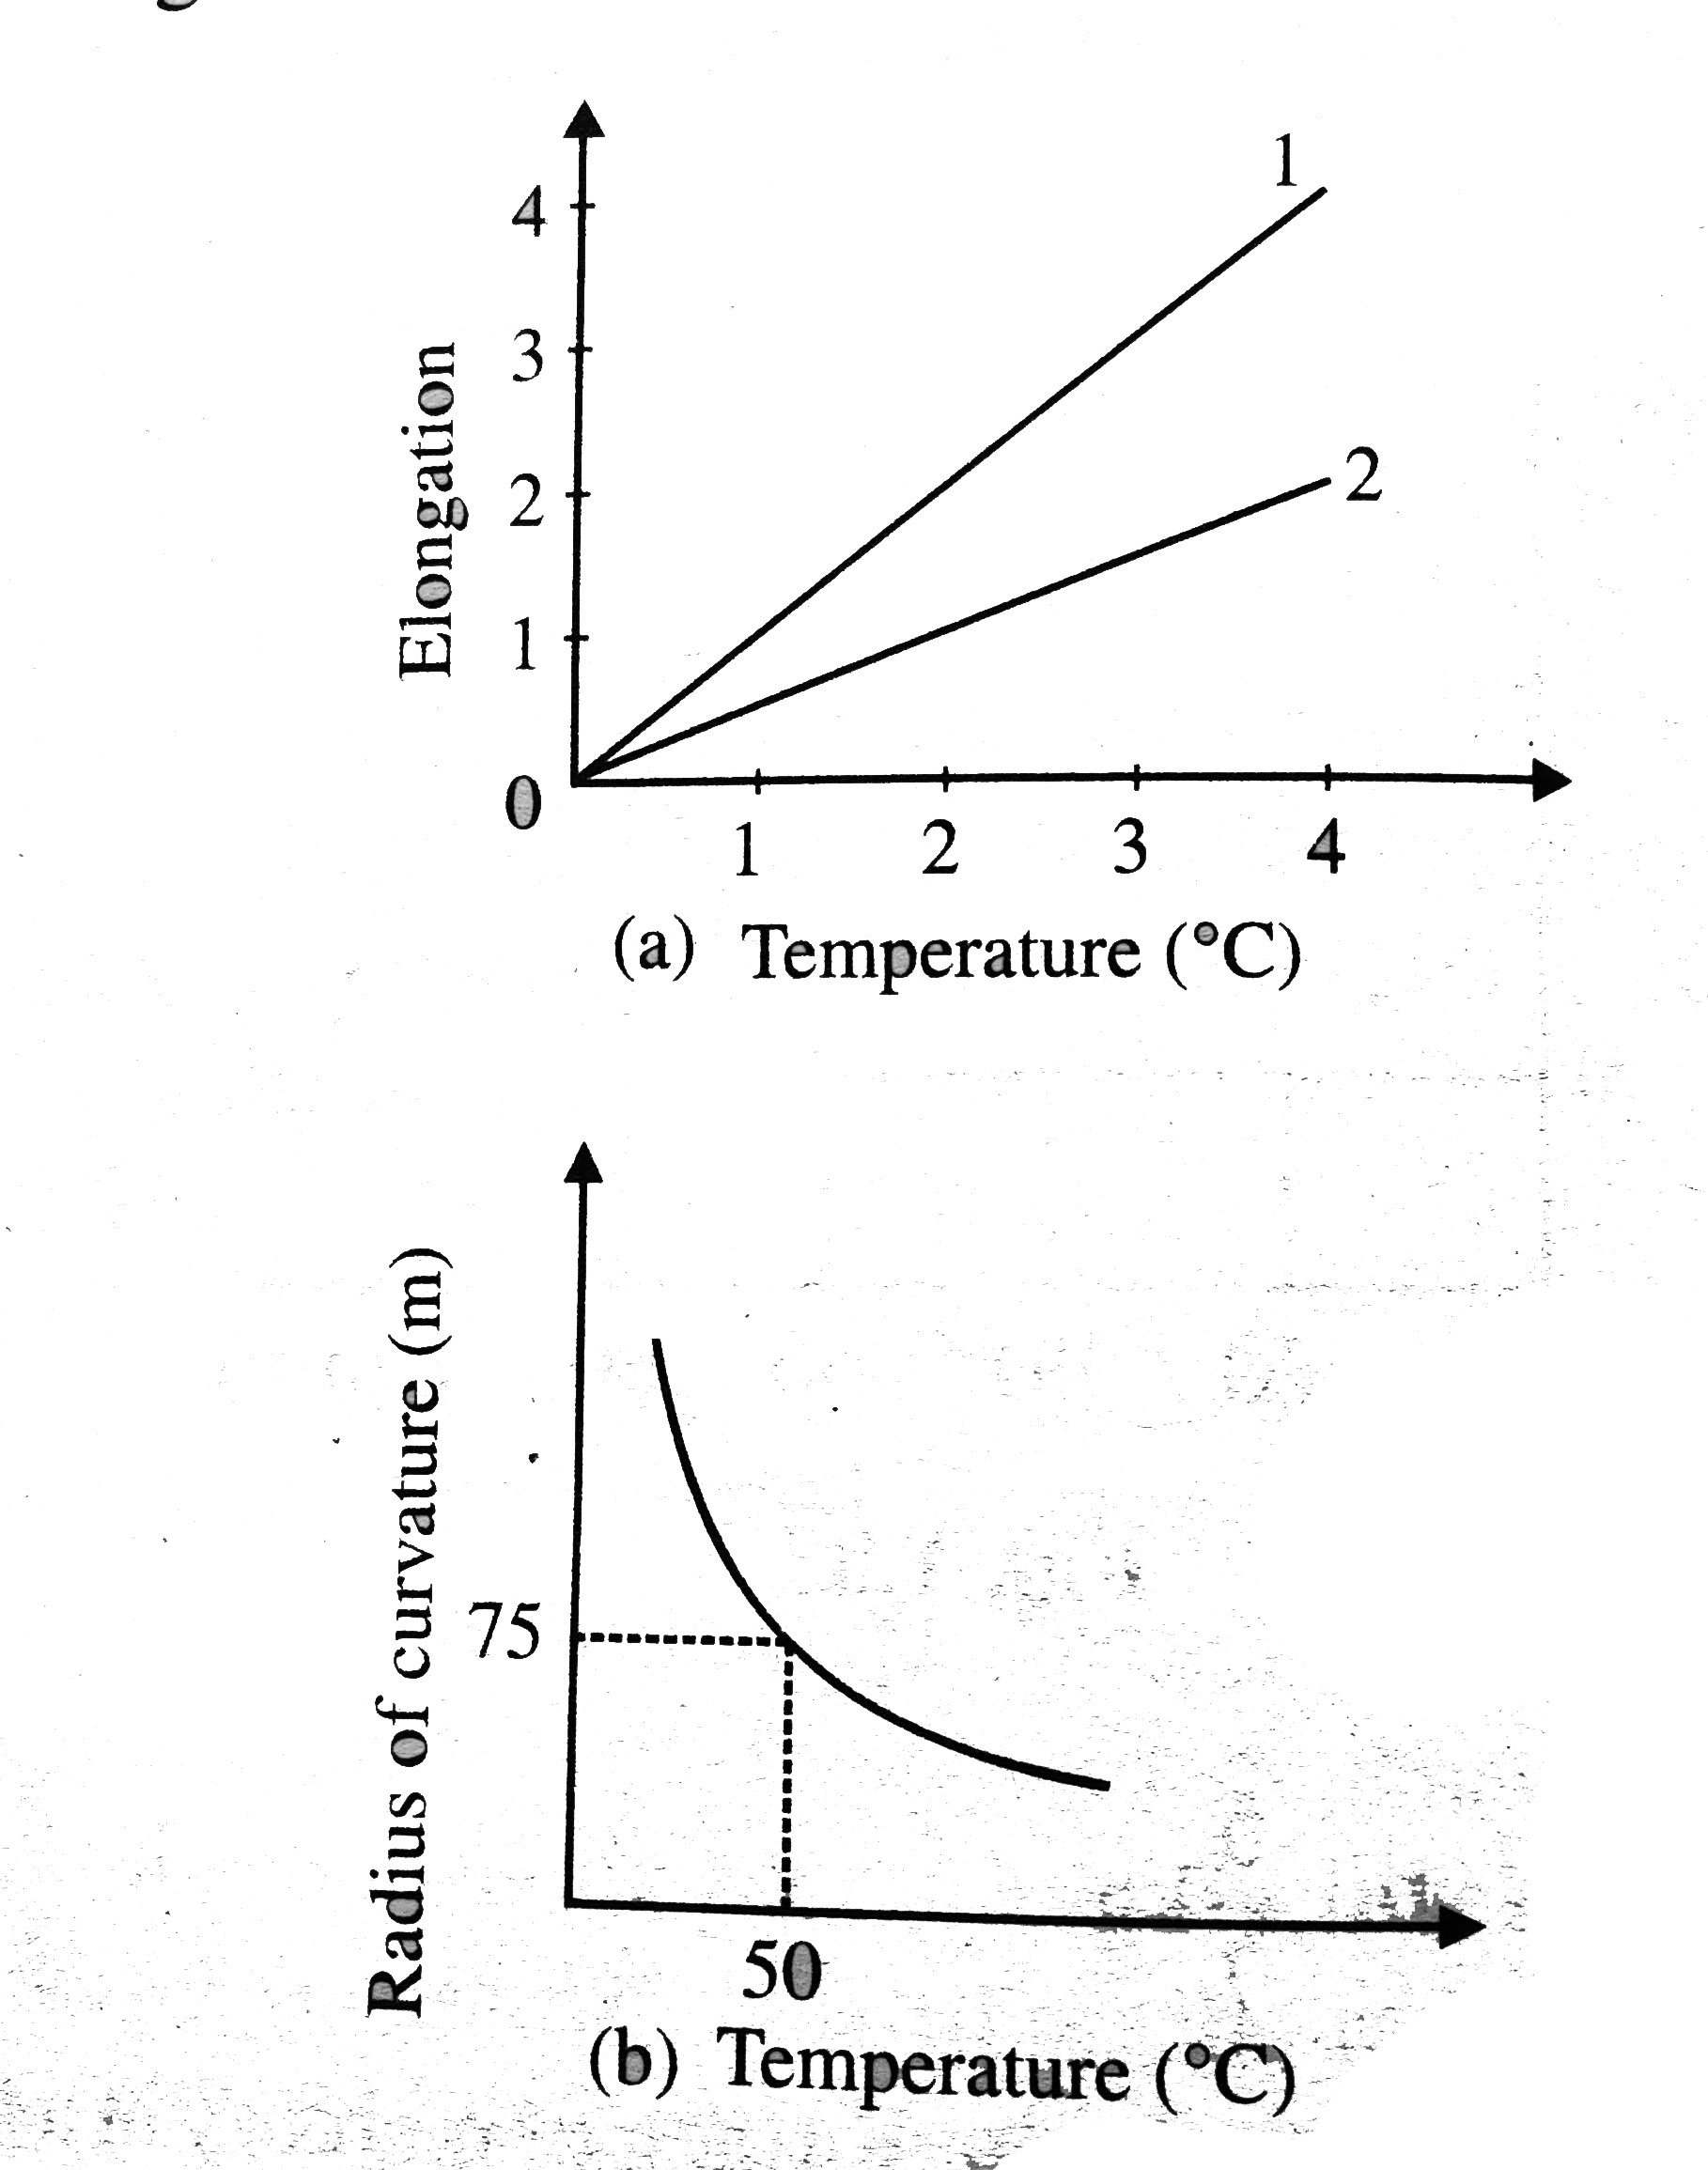
Figure. Shows the graphs of elongation versus temperature for two different metals. If these metals are employed to form a straight bimetallic strip of thickness 6 cm and heated, it bends in the form of an arc, the radius of cuvature chaging with temperature approximately as shown in the figure. The linear expansivities of the two metals are
View SolutionA fluid having a thermal coefficient of volume expansion γ is filled in a cylindrical vessel up to a height h0. The coefficient of linear thermal expansion of the material of the vessel is α . If the fluid is heated with the vessel , then find the level of liquid when temperature increases by Δθ.
View Solution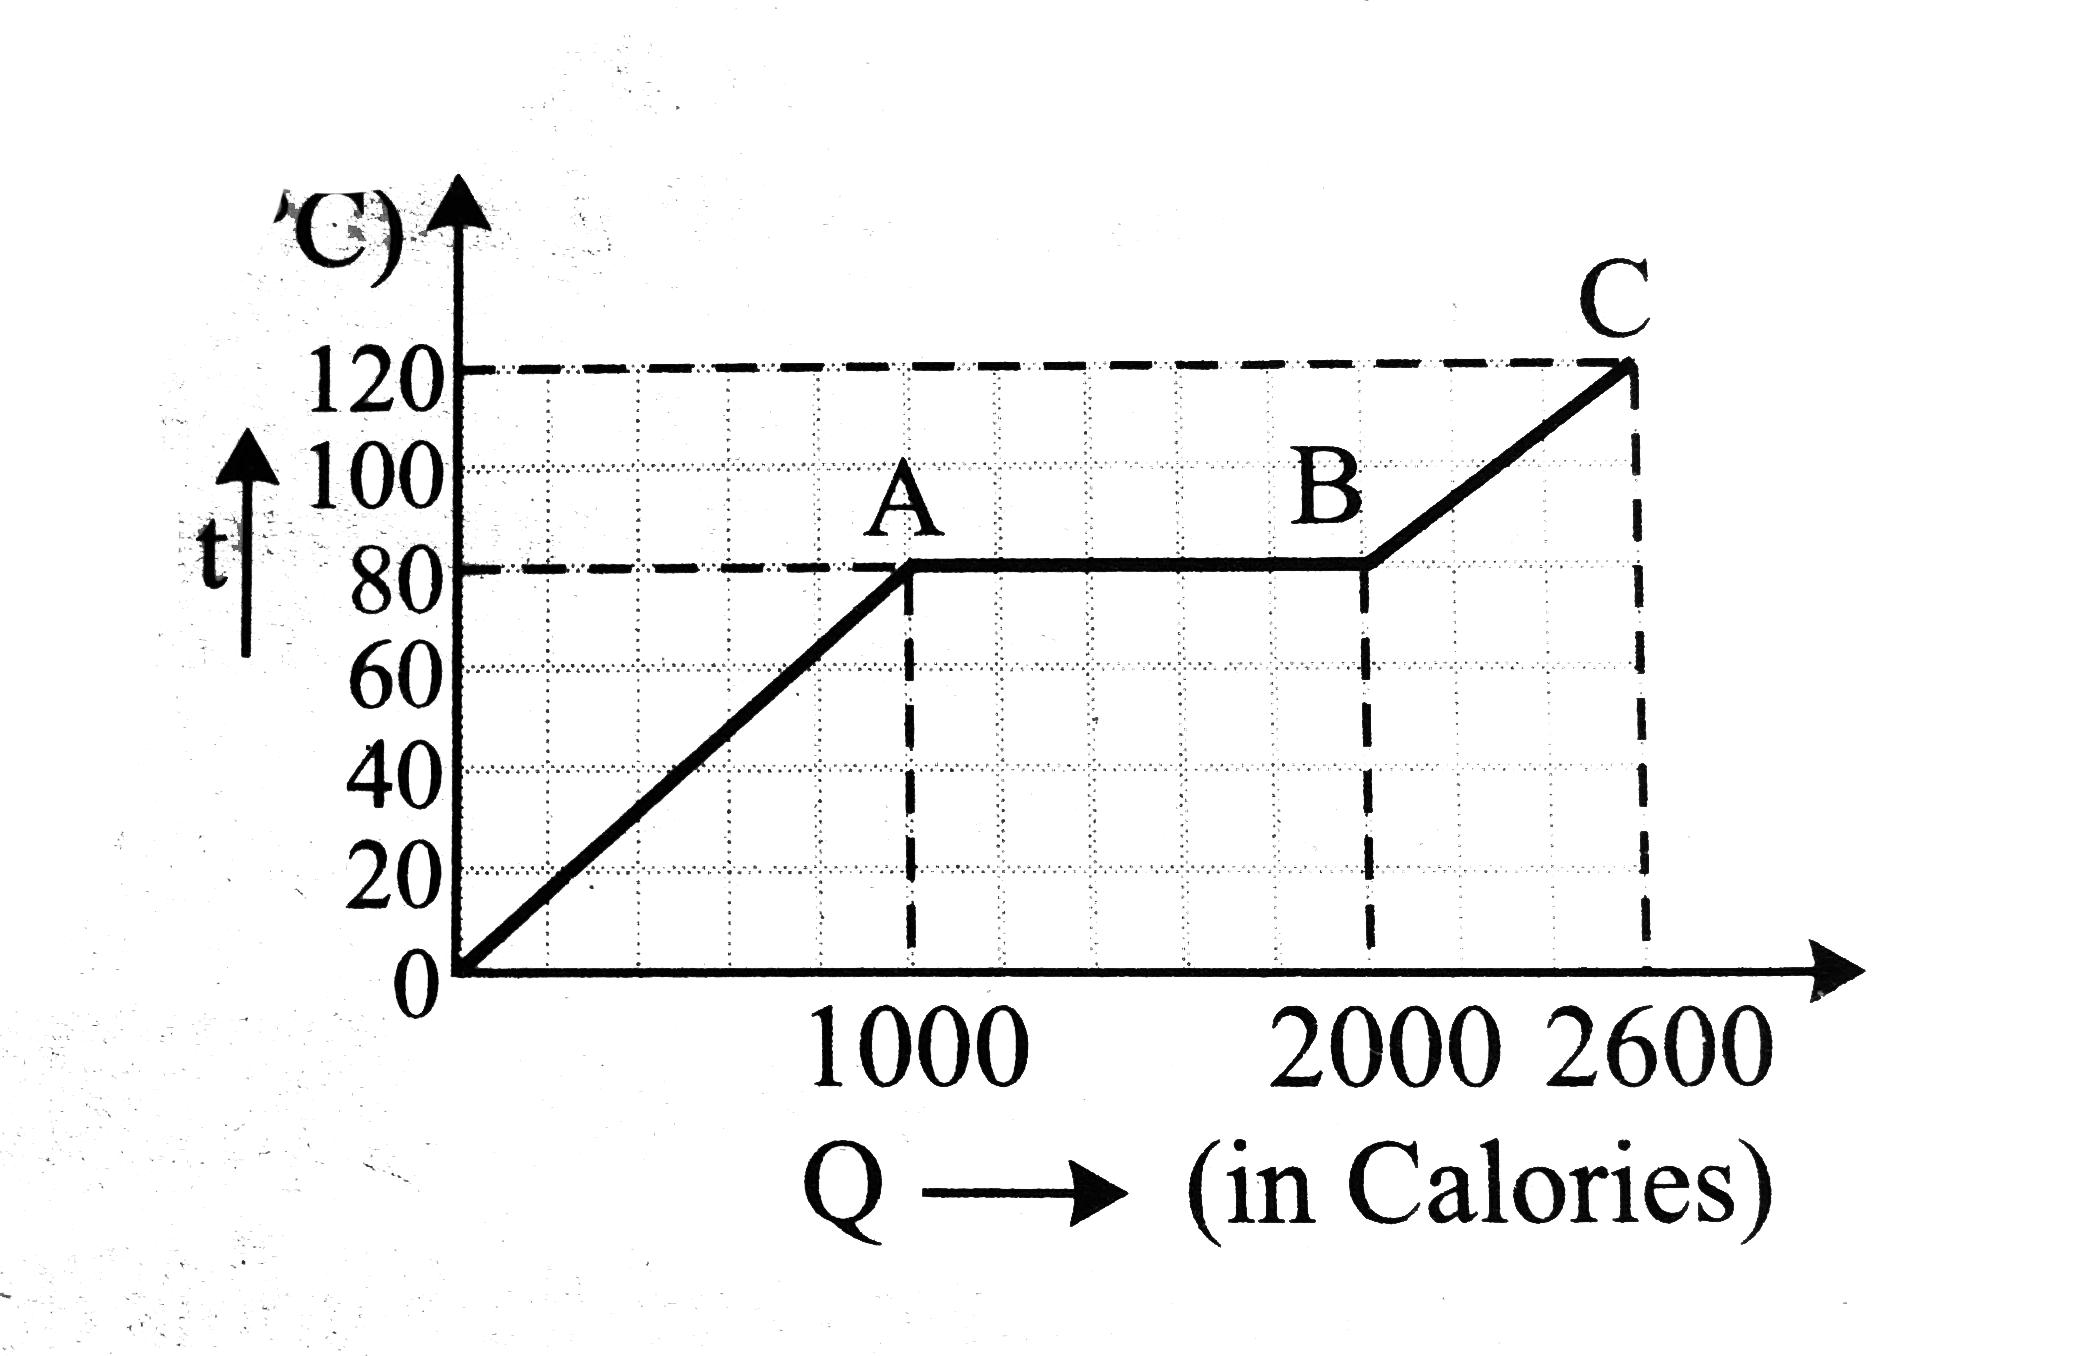
A substance is in the solid form at 0∘C. The amount of heat added to this substance and its temperature are plotted in the following graph. If the relative specific heat capacity of the solid substance is 0.5, find from the graph (i) the mass of the substance, (ii) the specific latent heat of the melting process and (ii) the specific heat of the substance in the liquid state.
Specific heat capacity of water =1000cal/kg/K
View SolutionFigure shown two adiabatic vessels, each containing a mass m of water at different temperature. The ends of a metal rod of length L, area of cross section A and thermal conductivity K, are inserted in the water as shown in the figure. Find the time taken for the difference between the temperature in the vessels to become half of the original value. The specific heat capacity of water is s. Neglect the heat capacity of the rod and the container and any loss of heat to the atmosphere.

View SolutionA cylindrical vessel containing a liquid is closed by a smooth piston of mass m as shown in the figure. The area of cross section of the piston is A. If the atmospheric pressure is P0, find the pressure of the liquid just below the piston.
 ,
,
View SolutionA substance initially in solid state at 0∘C is heated. The graph showing the variation in temperature with the amount of heat supplied is shown in Fig. 11.7. If the specific heat capacity of the solid substance is 500 J kg−1^∘C−1, use graph to find : (i) the mass of the substance, and (ii) the specific latent heat of fusion of the substance in the liquid state.
View Solution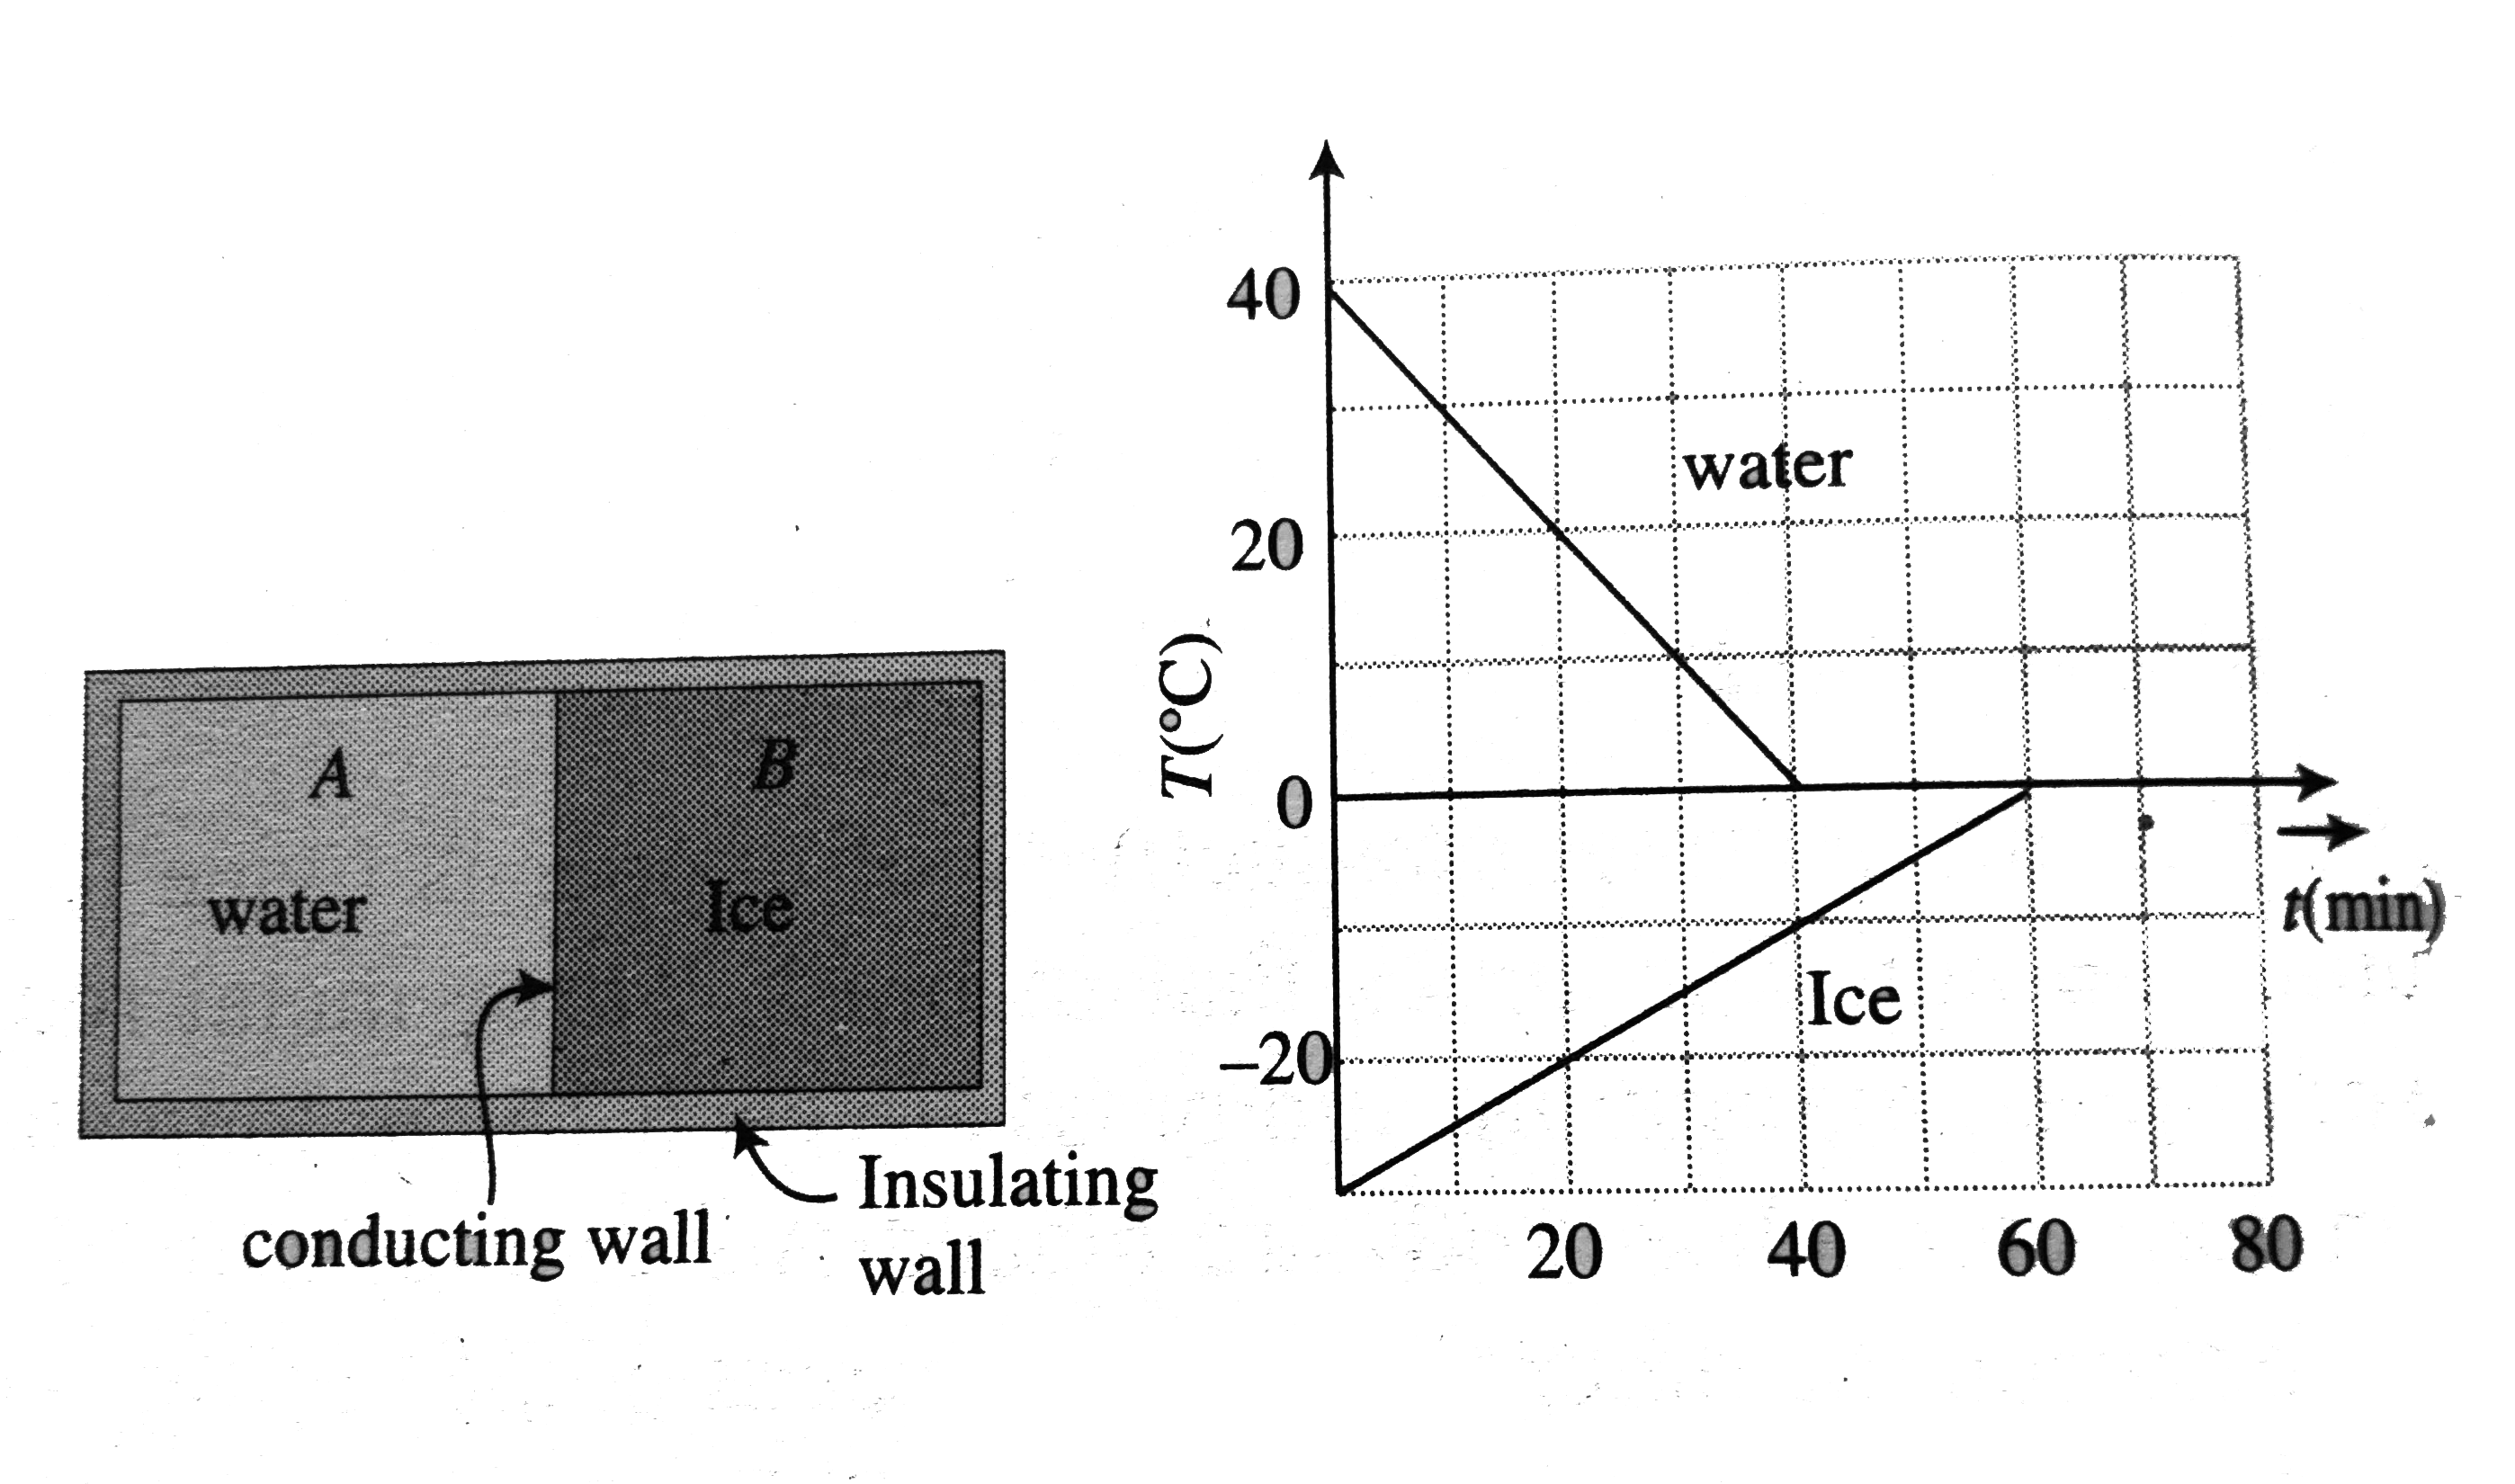
A 0.60 kg sample of water and a sample of ice are placed in two compartmetnts A and B separated by a conducting wall, in a thermally insulated container. The rate of heat transfer from the water to the ice through the conducting wall is constant P, until thermal equilibrium is reached. The temperature T of the liquid water and the ice are given in graph as functions of time t. Temperature of the compartments remain homogeneous during whole heat transfer process. Given specific heat of ice =2100J/kg−K, specific heat of water =4200J/kg−K, and latent heat of fusion of ice =3.3×10⁵J/kg.
Initial mass of the ice in the container equal to
View Solution
