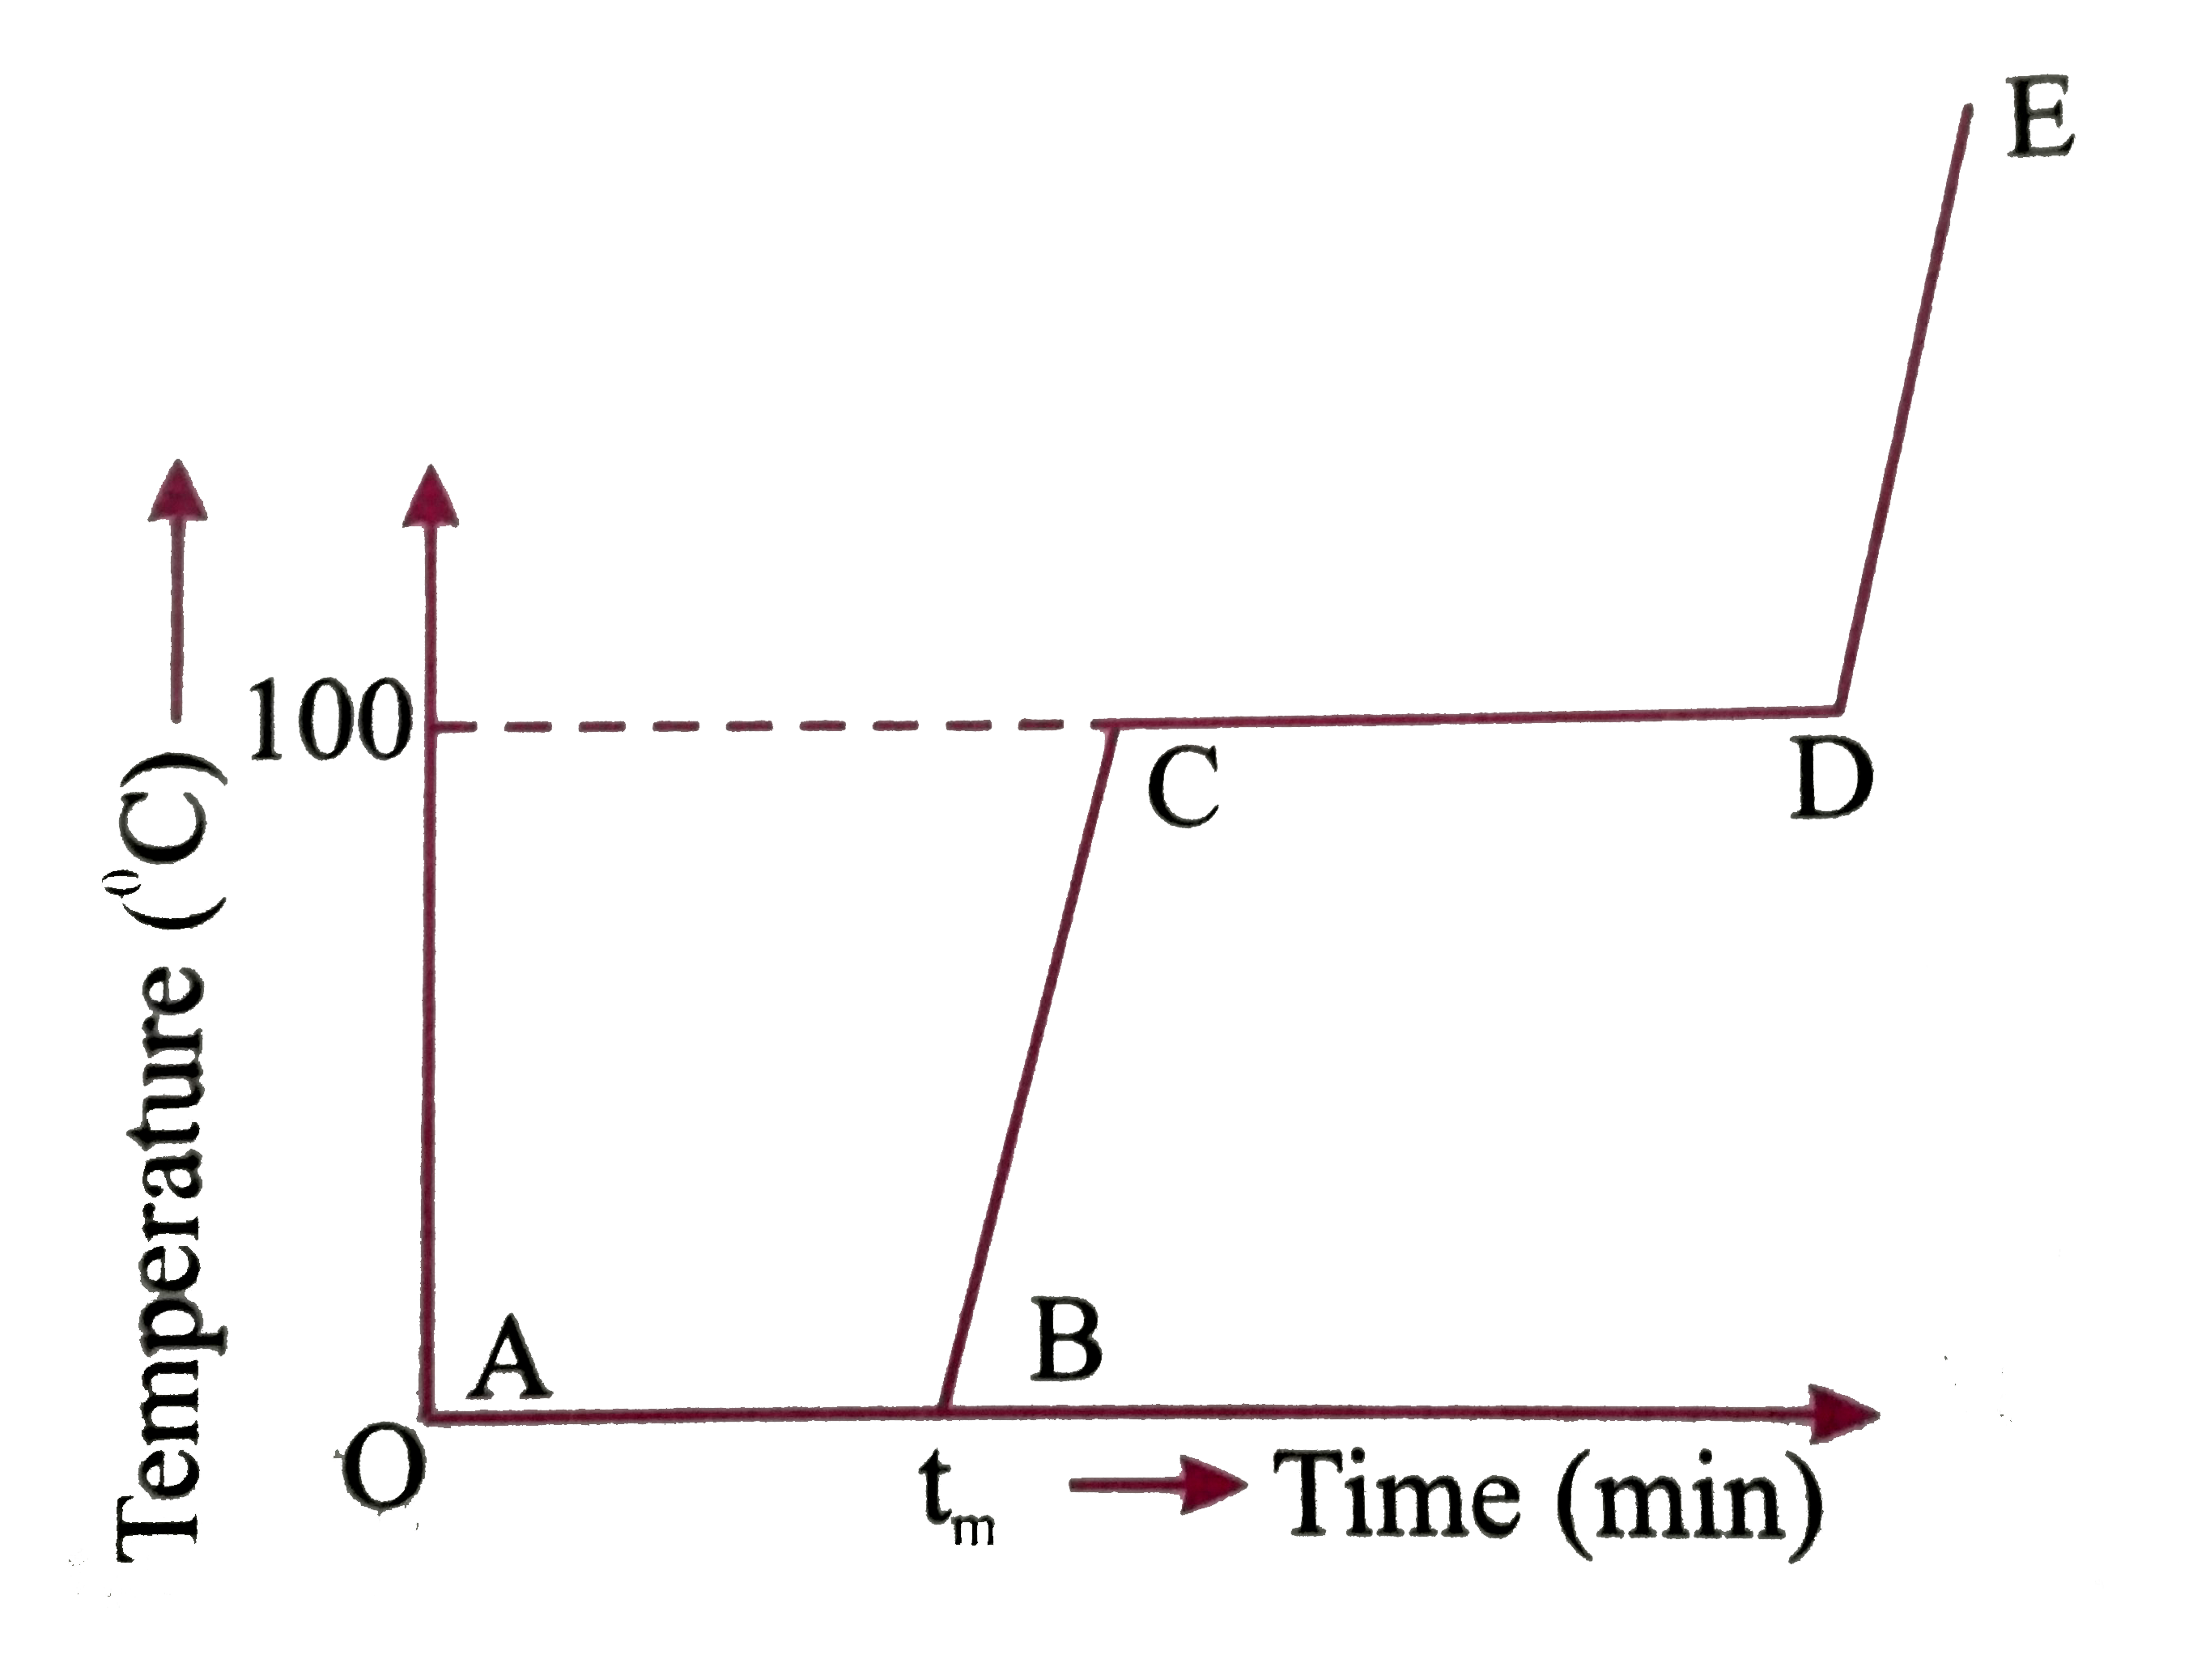
For the following temperature-time graph, in which region the state of material changes 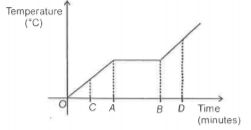
A
OC
B
AB
C
BO
D
CA
Video Solution
Text Solution
The correct Answer is:B
|
Answer
Step by step video, text & image solution for For the following temperature-time graph, in which region the state of material changes by Physics experts to help you in doubts & scoring excellent marks in Class 12 exams.
Updated on:21/07/2023Topper's Solved these Questions
Similar Questions
Knowledge Check
Which of the following speed-time graphs is not possible:
A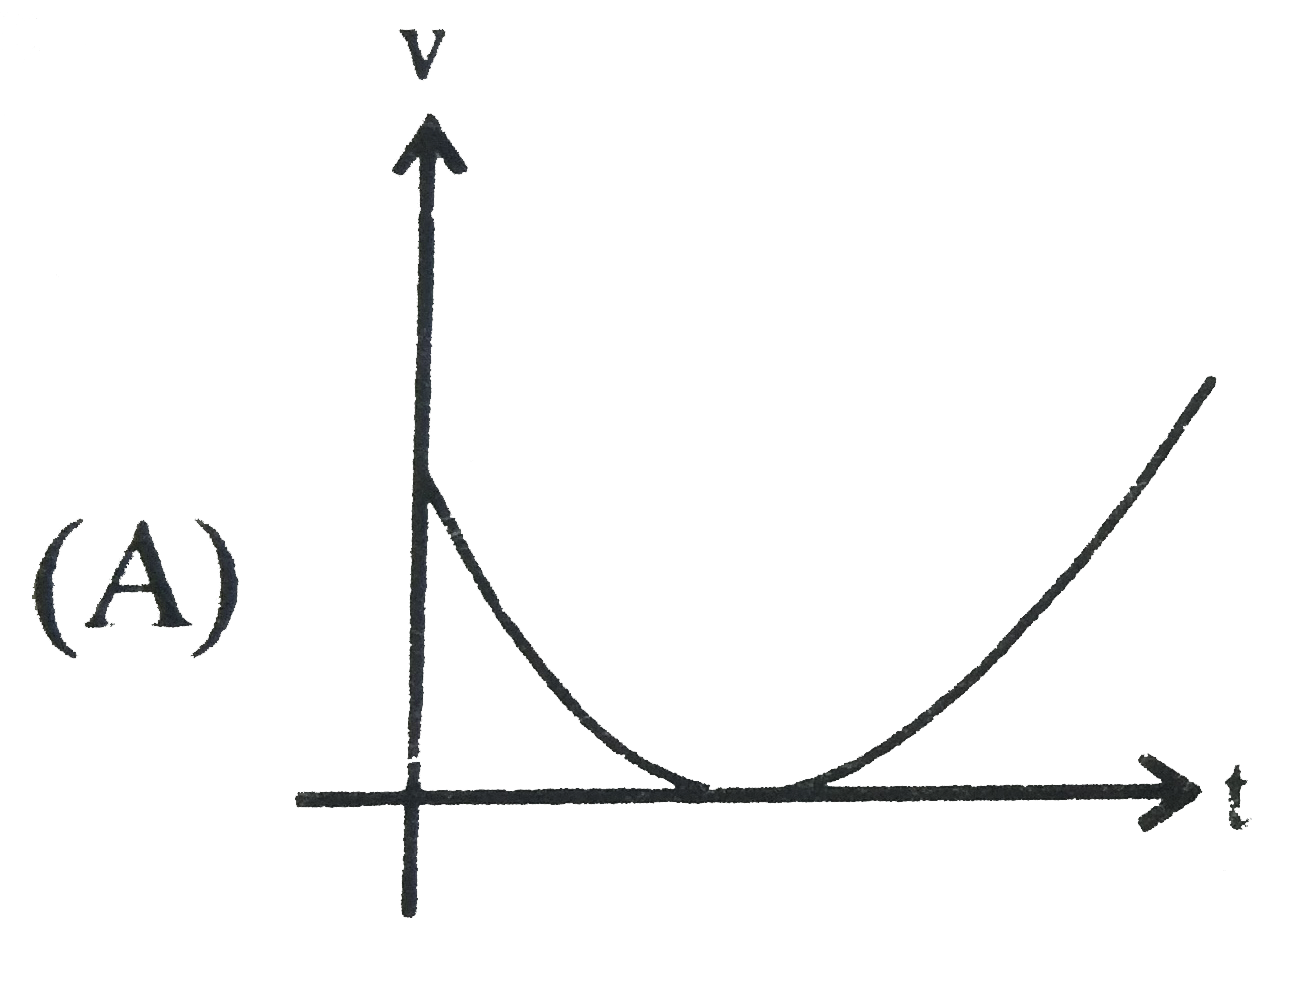 B
B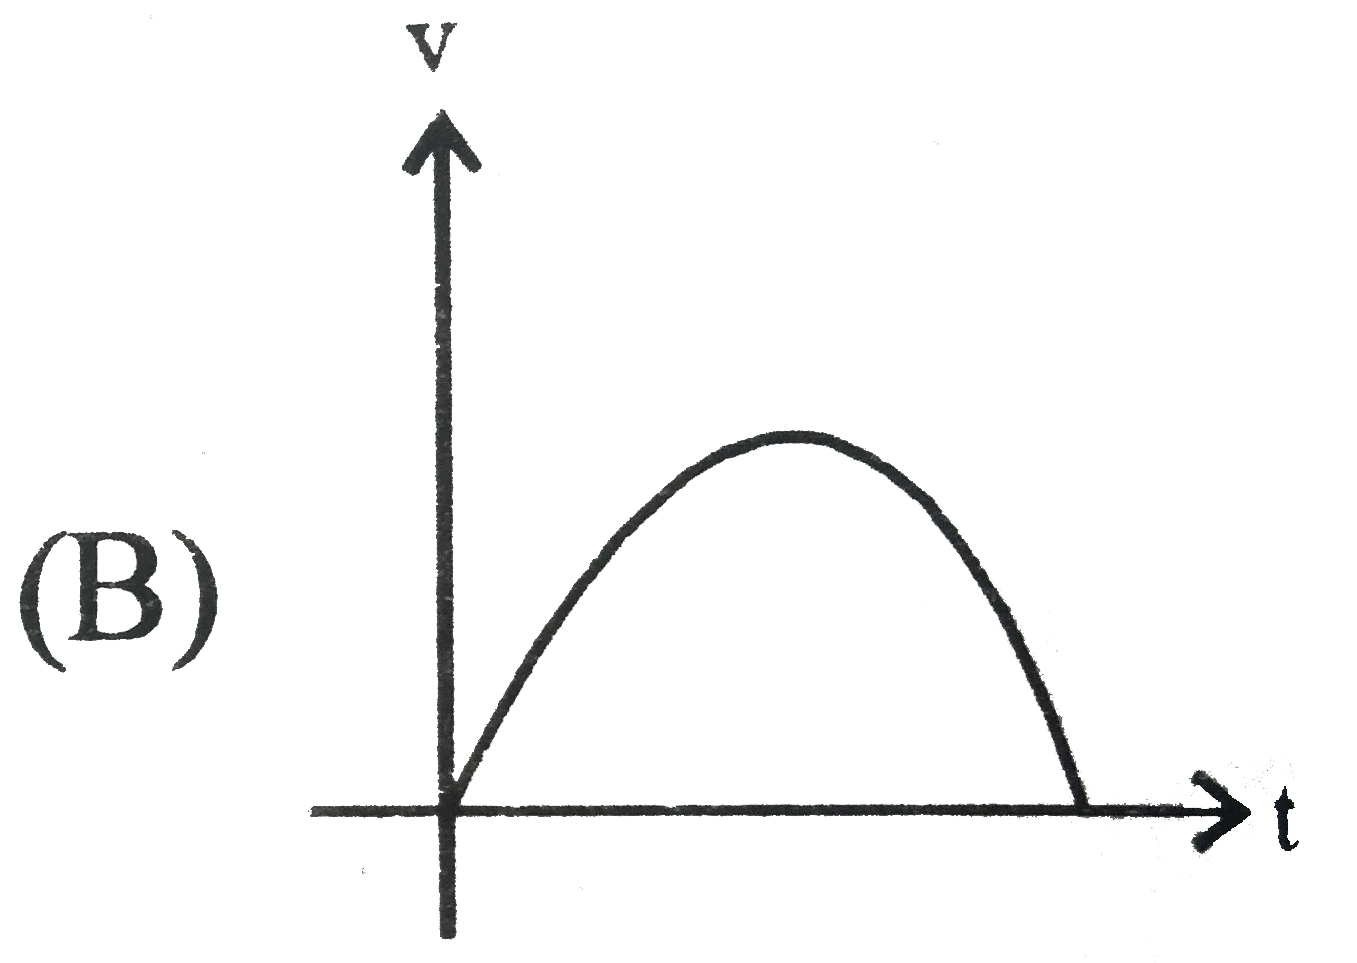 C
C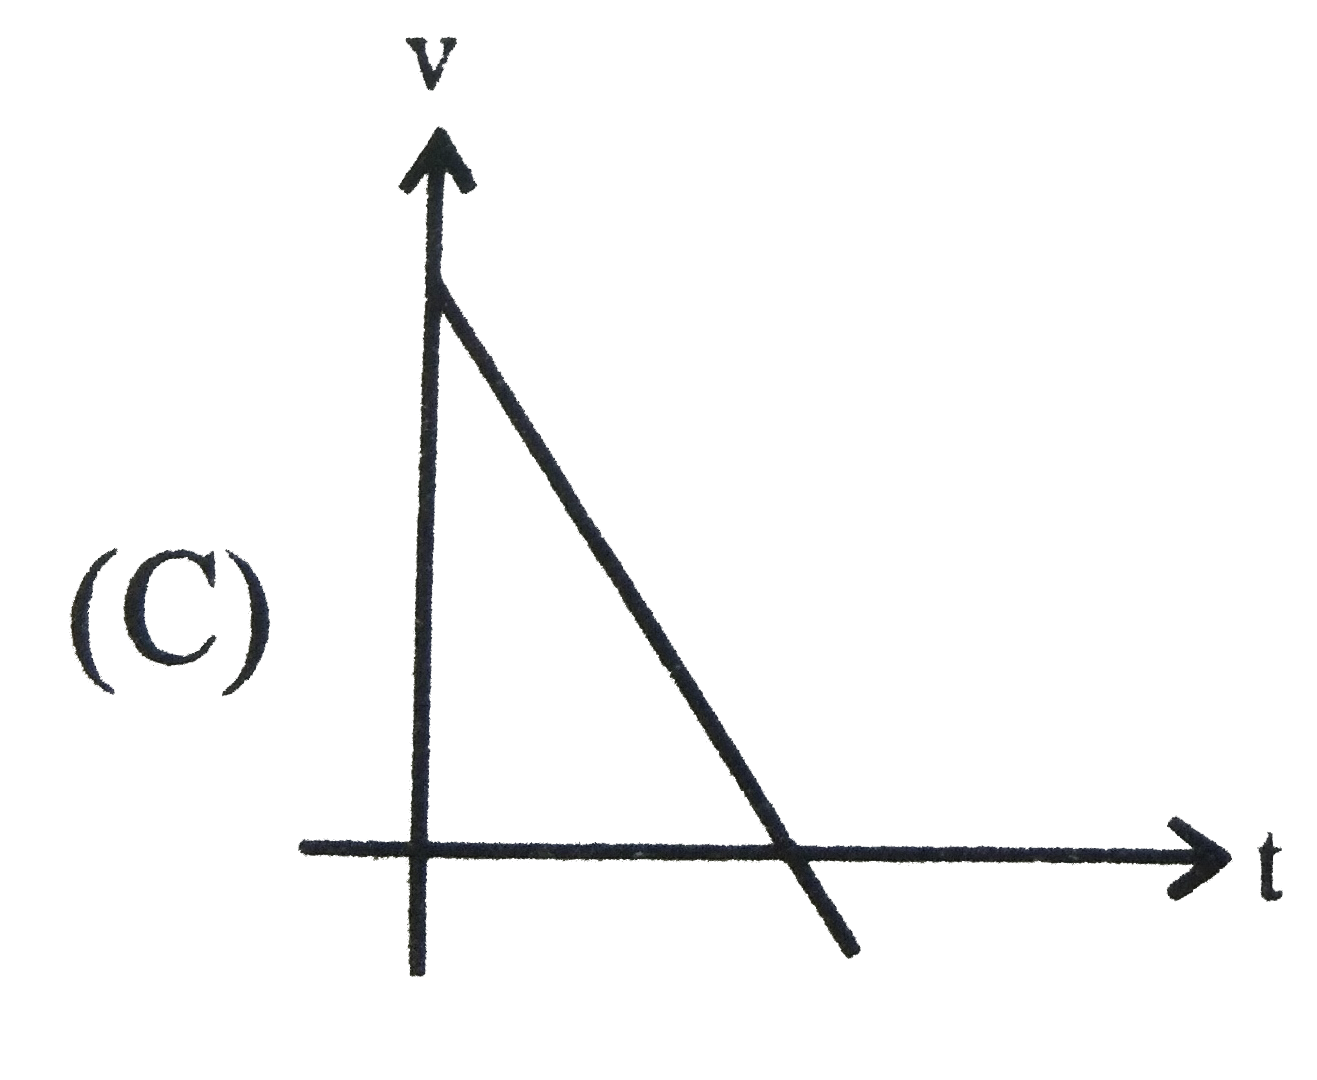 D
D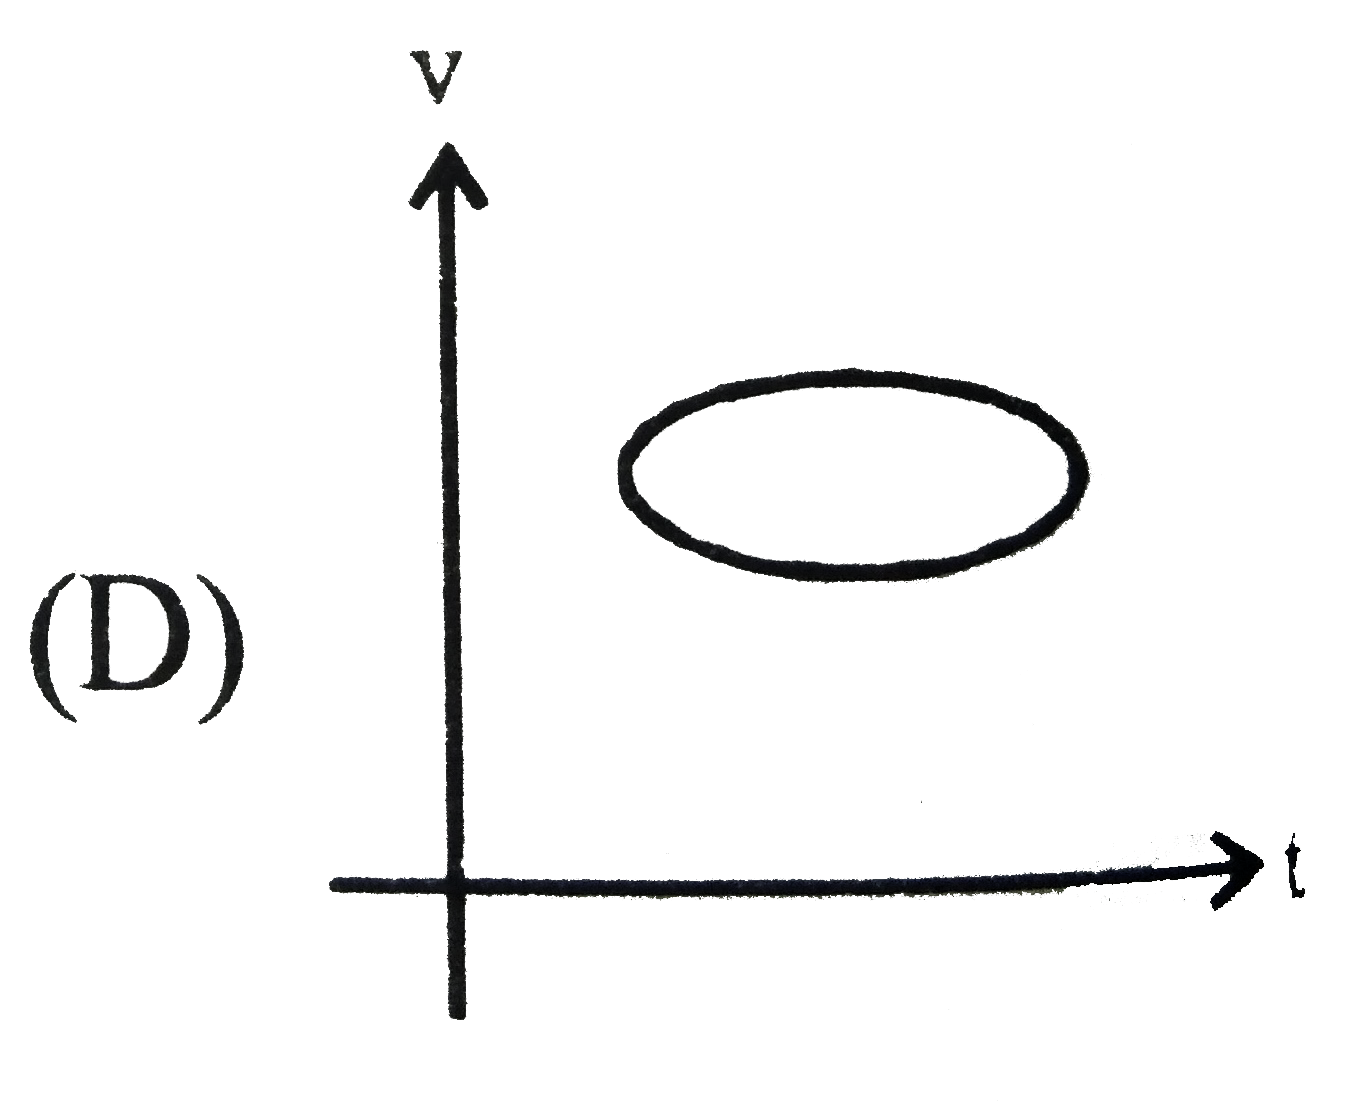
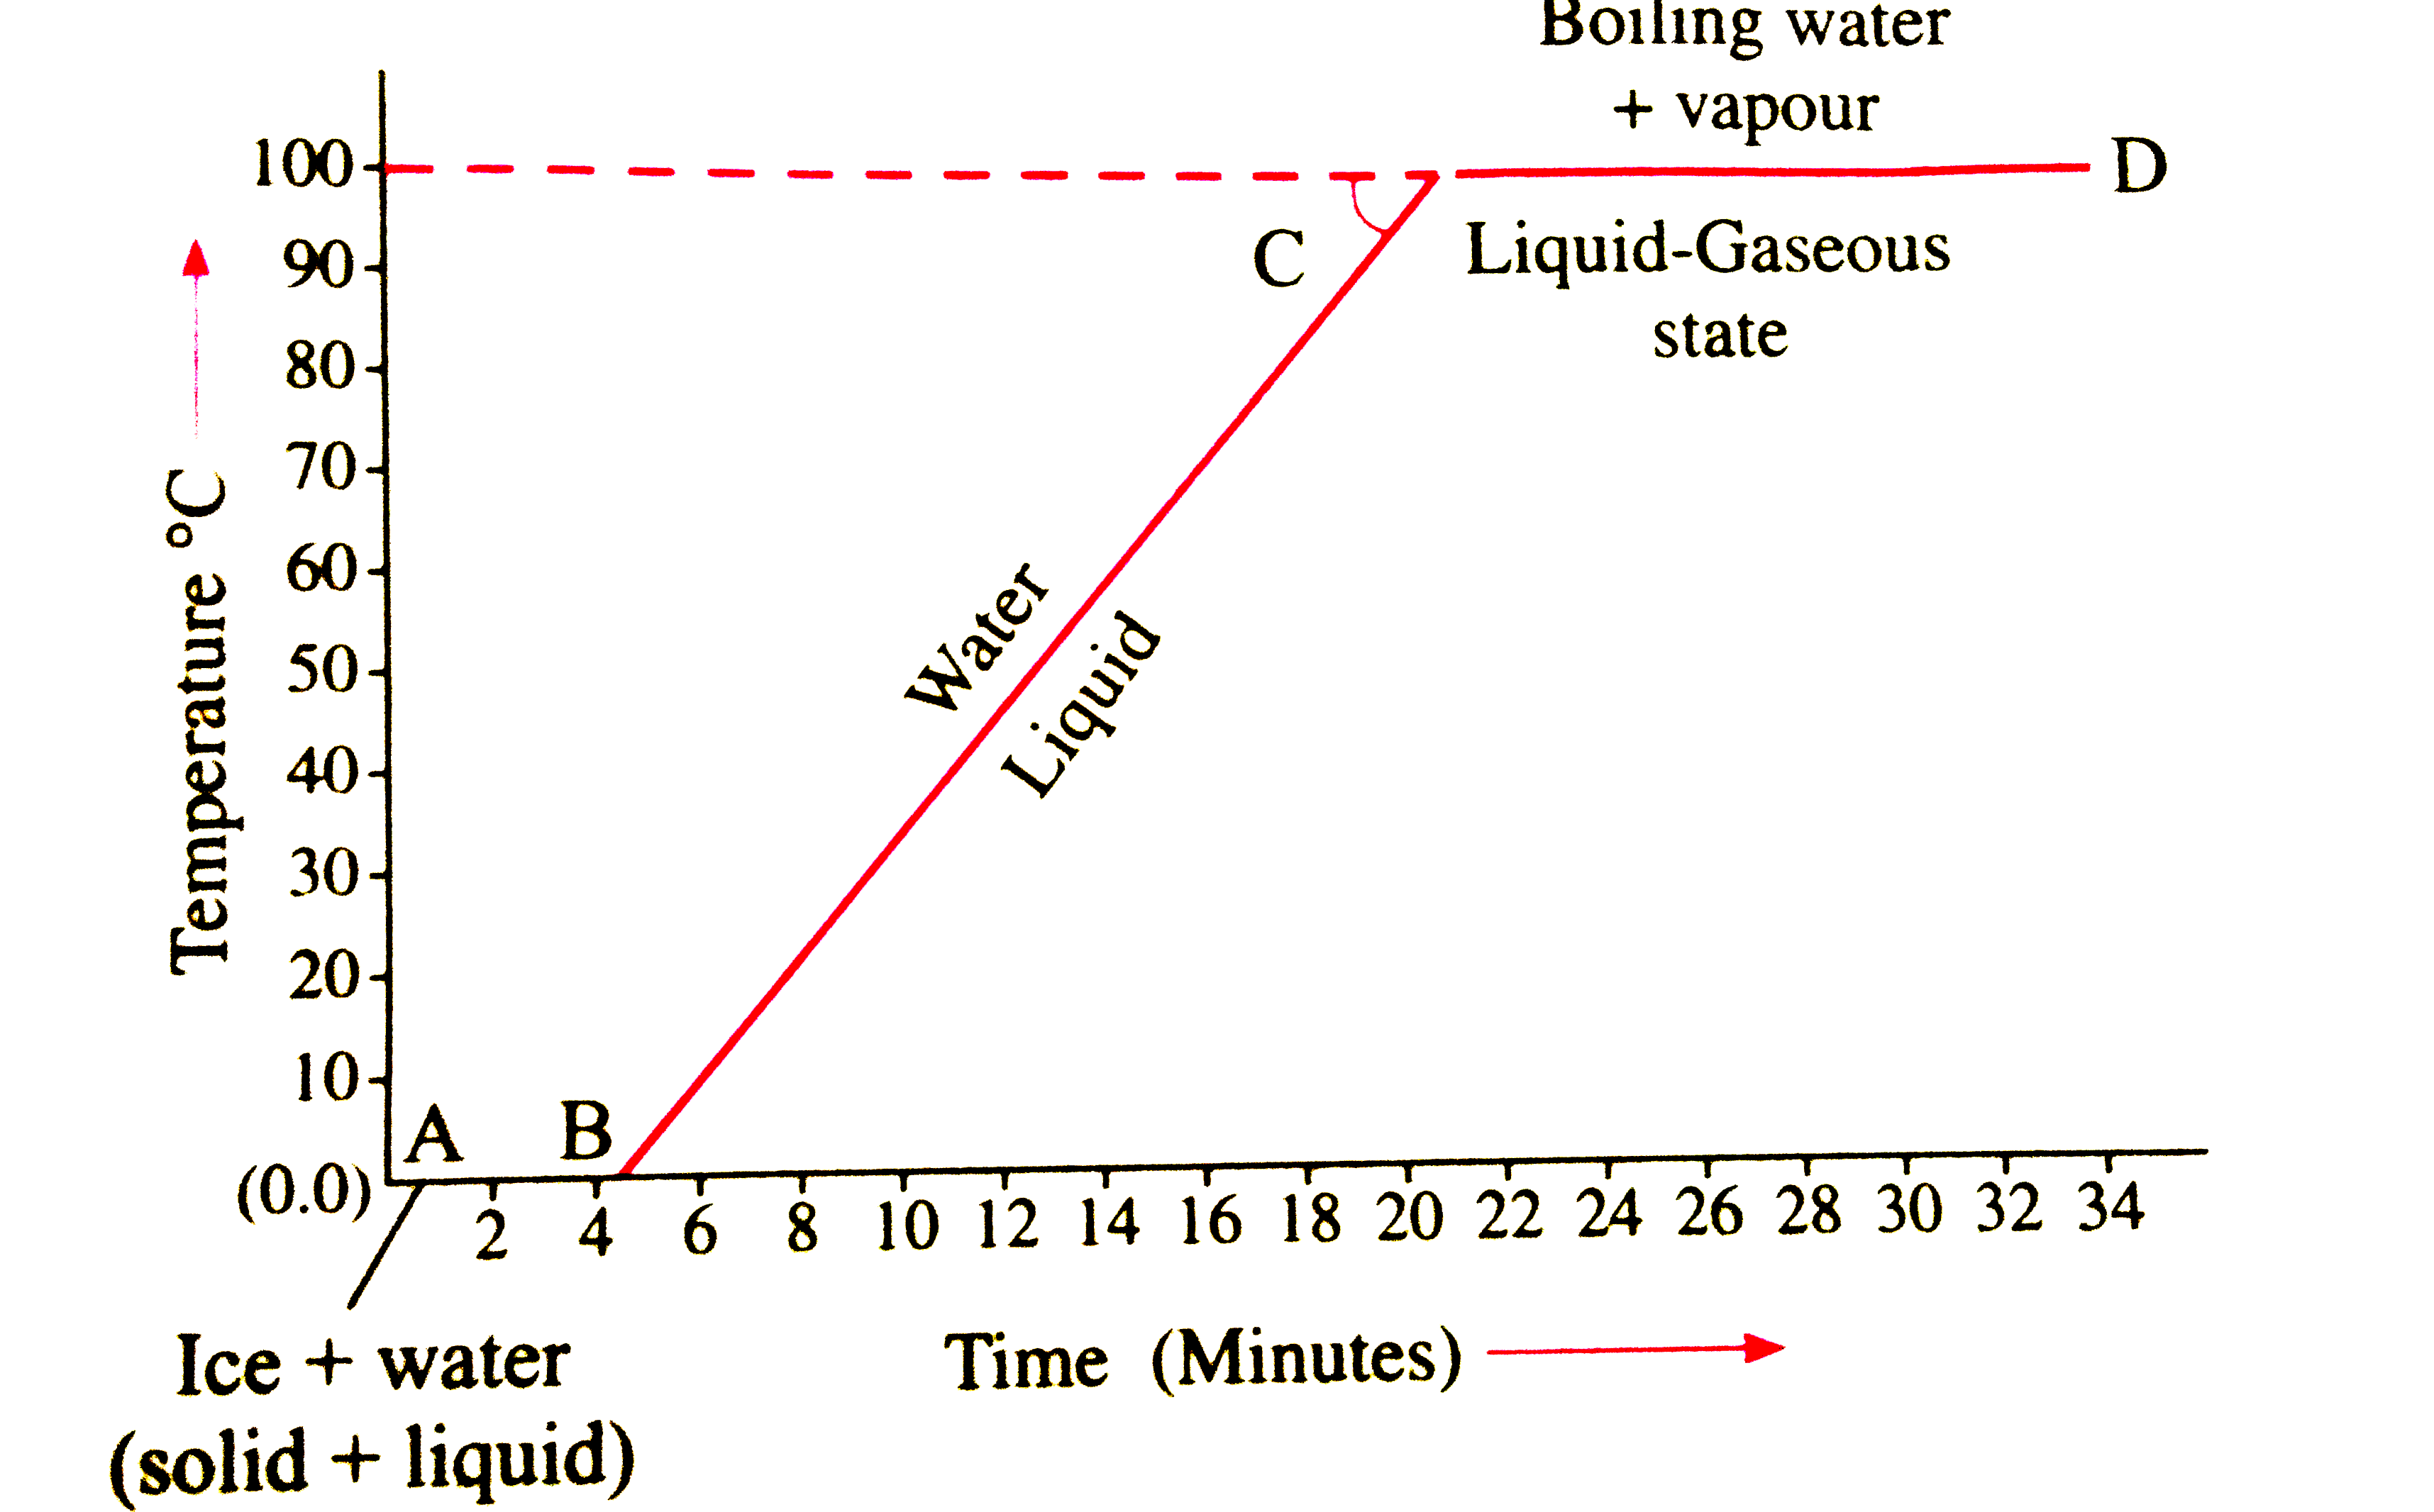
Refer to the plot of temperature versus time showing the changes in the state of ice on heating (not to scale).
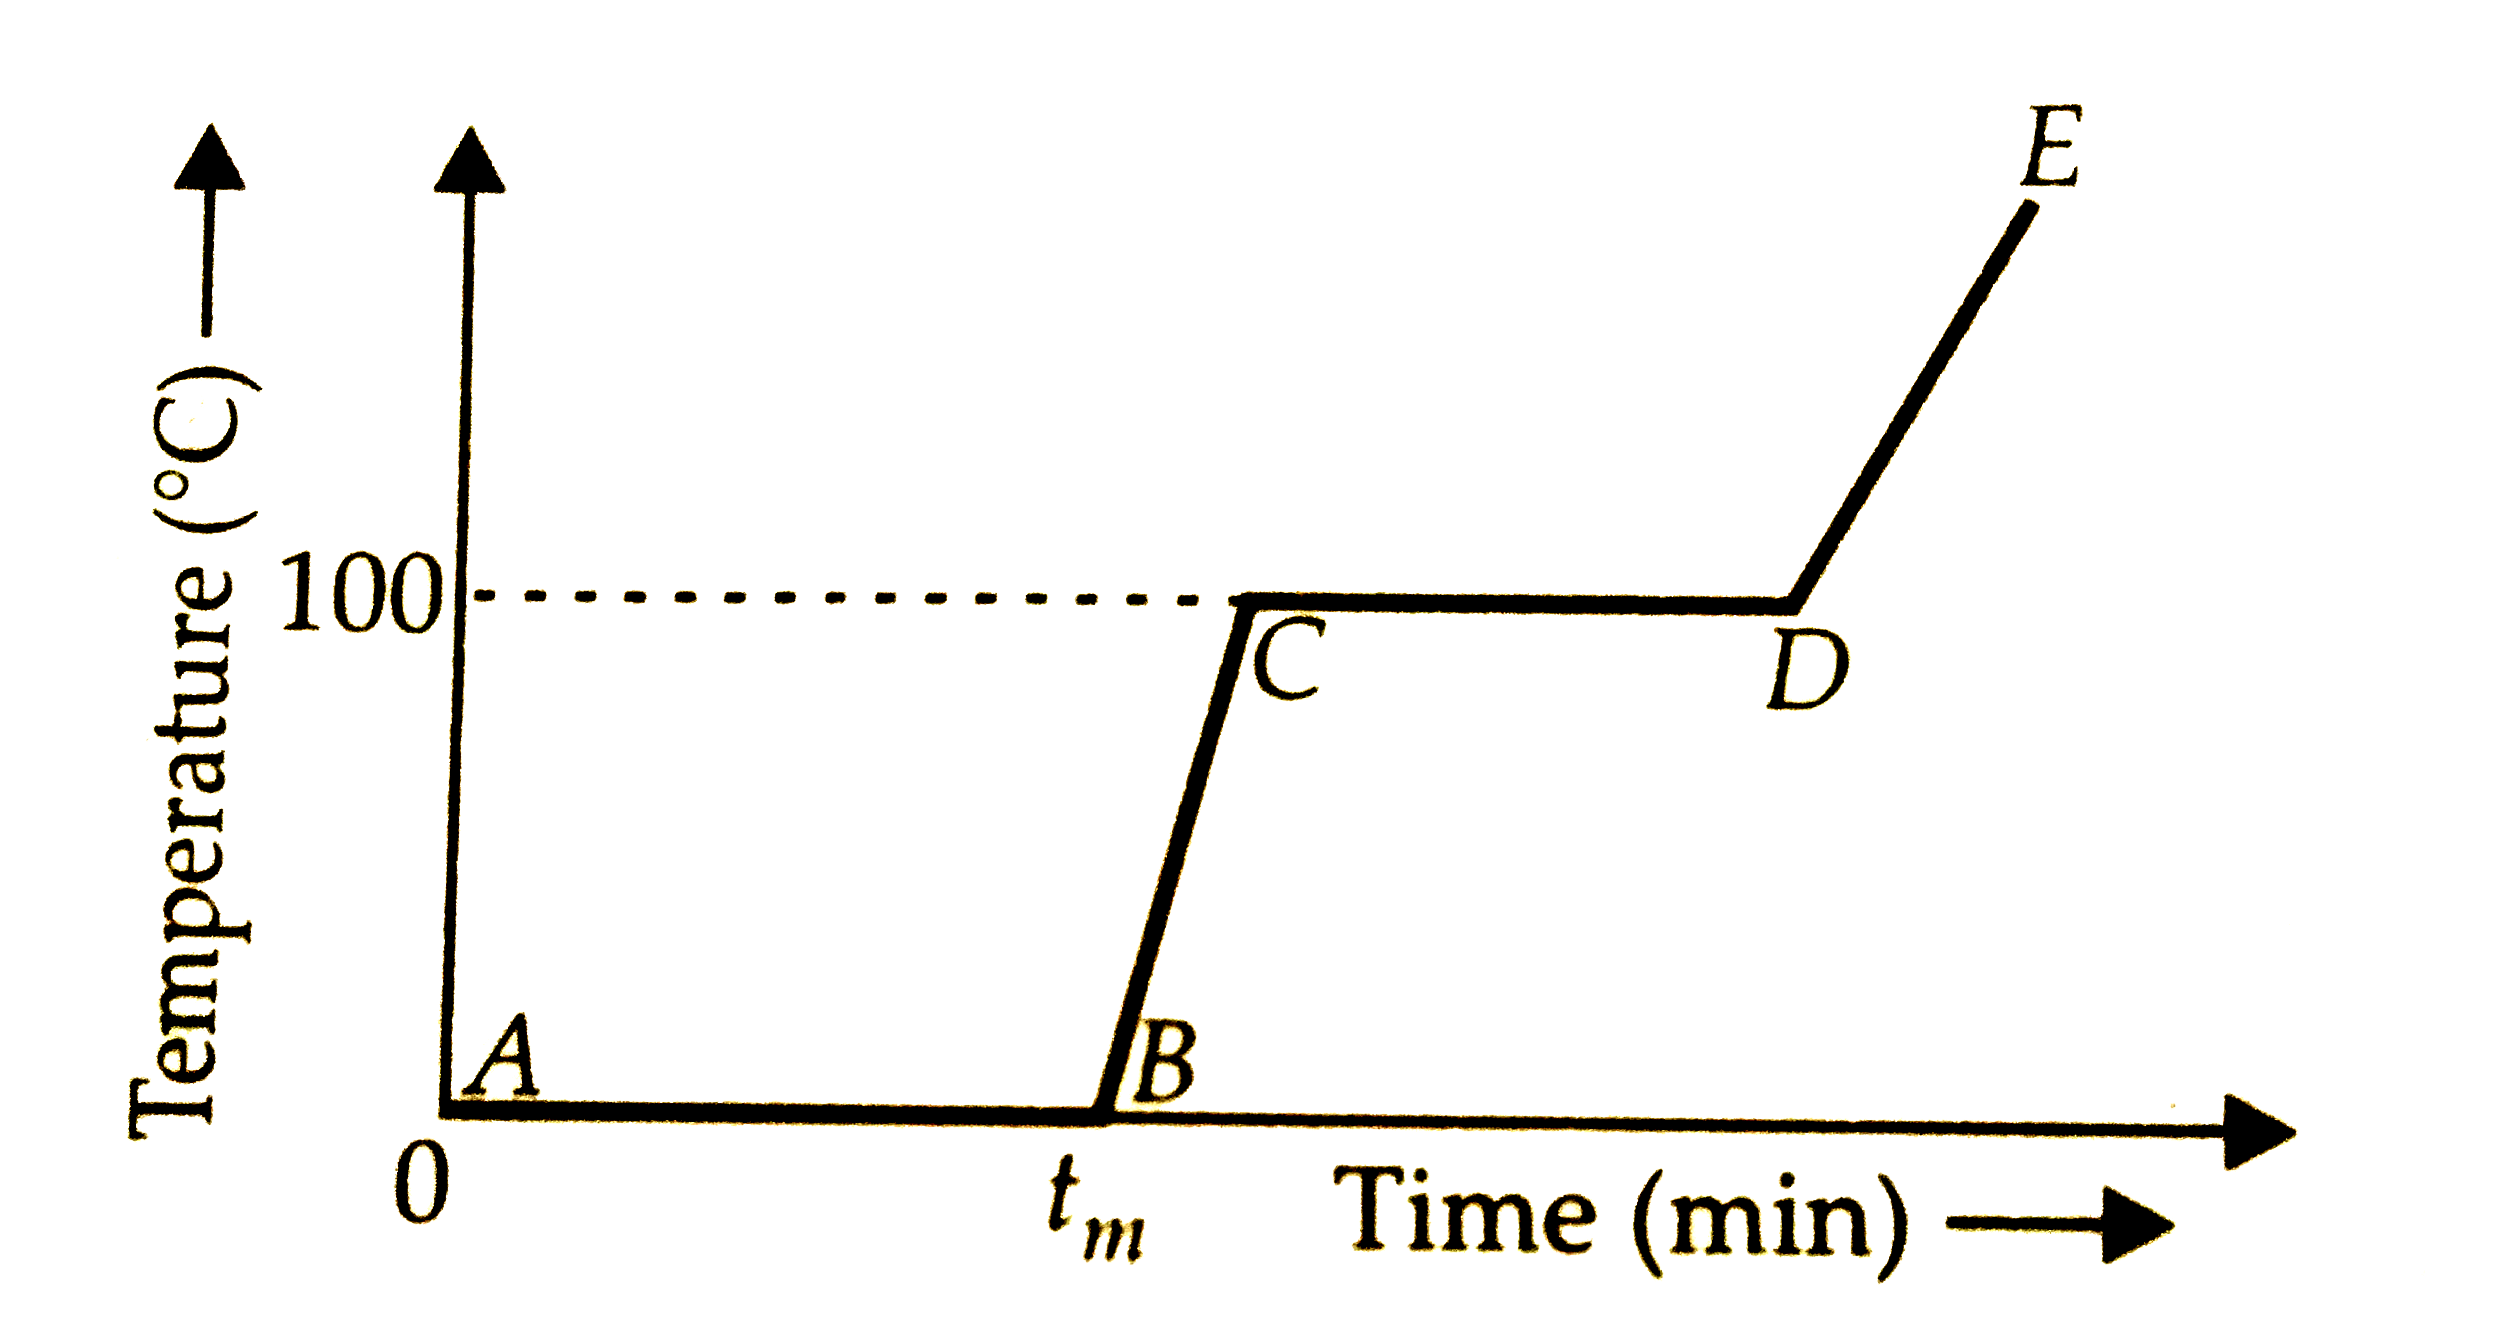
Which of the following is correct ?AAB represents ice and water are not in the thermal equilibriumBAt B water starts boiling.CAt C all the water gets converted into steam.DCD represents water and steam in equilibrium at boiling point.Refer to the plot of temperature versus time, showing the changes in the state of ice on heating (not to scale).
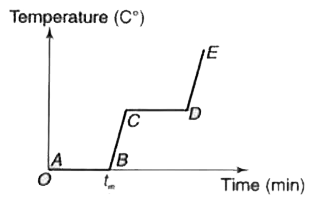
which of the following is correct ?AThe region AB represents steam and water in thermal equilibriumBAt B water starts boilingCAt C all the water gets converted into steamDC and D represent water and steam in equilibrium at boiling point
Which of the following speed time graph exists in the nature?
View SolutionGive the usual name for the following :
Heat required to change the state of a substance without changing the temperature
View SolutionRefer to the plot of temperature versus time (figure) showing the changes in the state if ice on heating (not to scale). Which of the following is correct ?
 .
.
View SolutionWhich of the following distance-time graphs is not possible?
View SolutionWhich of the following distance time graphs is possible ?
View Solution

