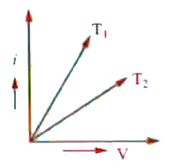
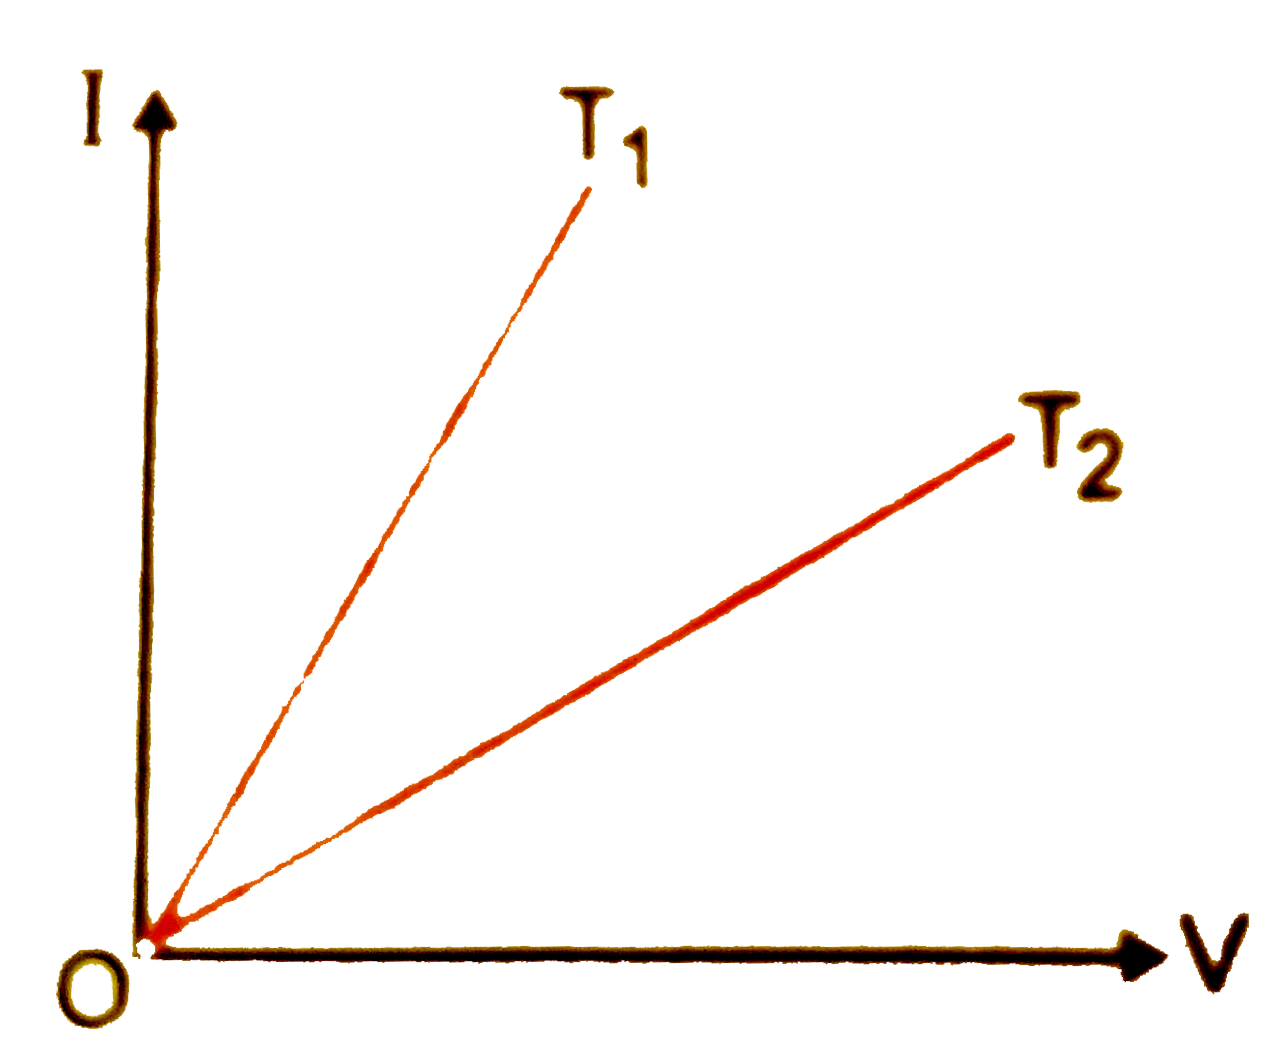
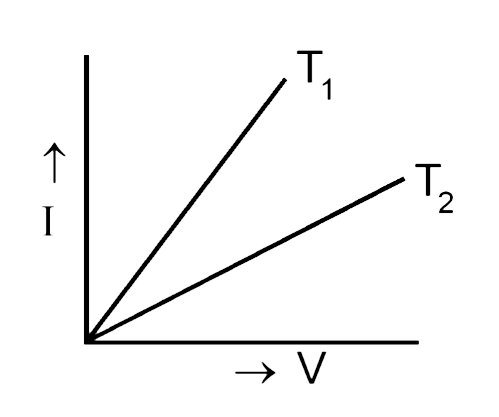
V−i graph for a metal wire at temperature is as shown in figure
 Solution in Telugu
T1=T2
T1<T2
T1>T2
No relation
The correct Answer is:B
Step by step video, text & image solution for V-i graph for a metal wire at temperature is as shown in figure by Physics experts to help you in doubts & scoring excellent marks in Class 12 exams.
Topper's Solved these Questions
- BOOK - AAKASH SERIESCHAPTER - CURRENT ELECTRICITYEXERCISE - EXERCISE - III73videos
CURRENT ELECTRICITY
- BOOK - AAKASH SERIESCHAPTER - CURRENT ELECTRICITYEXERCISE - EXERCISE - IB44videos
CURRENT ELECTRICITY
- BOOK - AAKASH SERIESCHAPTER - CURRENT ELECTRICITYEXERCISE - PROBLEMS (LEVEL-II)26videos
CURRENT ELECTRICITY
- BOOK - AAKASH SERIESCHAPTER - DUAL NATURE OF RADIATION AND MATTEREXERCISE - PRACTICE EXERCISEX44videos
DUAL NATURE OF RADIATION AND MATTER
Similar Questions
In a hydrogen tube it is observed that through a given cross-section 3.13×10¹⁵ electrons persec. moving from right to left and 3.12×10¹⁵ protons per sec are moving from left to right. The electric current in the discharge tube and its direction is
01:13View Solution(A): Most of good conductors of heat are also good conductors of electricity and vice versa.
(R): Mainly electrons are responsible for these conductions.04:21View SolutionA battery of emf 10 V and internal resistance 3Ω is connected to a resistor. If the current in the circuit is 0.5 A, what is the resistance of the resistor? What is the terminal voltage of the battery when the circuit is closed?
01:41View SolutionTwo separate monochromatic light beams A and B of the same intensity are falling normally on a unit area of a metallic surface. Their wave lengths are λA and λB, respectively. Assuming that all the incident light is used in ejecting the photoelectrons the ratio of the photoelectrons from the beam A to that from B is :
02:42View SolutionV- I graph for a metallic wire at two different temperature T1 and T2 is shown in figure. Which of the two temperature is higher and why?
 05:38View Solution
V-I graphs for a material is shown in the figure. The graphs are drawn at two different temperatures.
View SolutionThe current (I) and voltage (V) graphs for a given metallic wire at two different temperature (T1) and (T2) are shown in fig. It is concluded that
 02:30View Solution
I-V graph for a metallic wire at two different temperatures T1 & T2 as shown in figure. Which of the two temperature is lower. Why ?
02:15View SolutionThe V – I graph for a wire of copper of length L and cross -section area A is shown in the figure below . The slope of the graph will be
01:47View SolutionI-V graph for a given metallic wire at two temperatures T_1 and T_2 is as shown in Fig. Which of the two temperatures is lower and why?
01:38View SolutionI-V graph for a metallie wire at two different tempearture, T1andT2 is as shown in the figure. Which of the two temperatures is lower and why ?
 View Solution
V-I graph for a mettalic wire at two different temperatures T1 and T2 is as shown in figure. WHich of the temperatures T1 and T2 is higher and why.
 View Solution
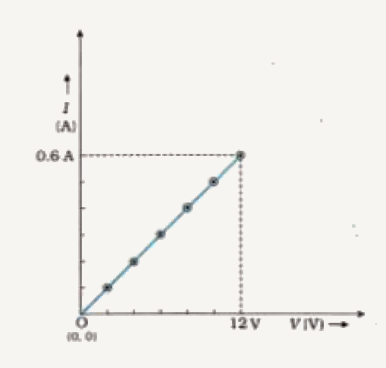
I - V graph for a resistance Wire is shown in the figure given below:

What will be resistance of this wire?03:09View SolutionThe current (I) and voltage (V) graphs for a given metallic wire at two different temperature (T_(1)) and (T_(2)) are shown in fig. It is concluded that
03:19View SolutionThe voltage-current (V-I) graph of a metallic conductor at two different temperature T_(1) and T_(2) is shown in figure. At which temperature is the resistance higher?
02:15View Solution

