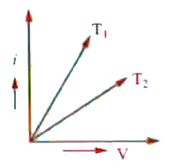
I-V graph for a metallic wire at two different temperatures T1 & T2 as shown in figure. Which of the two temperature is lower. Why ?Solution in Tamil

For the same potential V0
Resistor at T1,R1=V0I1
Resistor at T2,R2=V0I2
I1>I2 (from the graph) ∴R1<R2
Since resistor of a metal increases with temperature
∴T1<T2
Similar Questions
I-V graph for a metallie wire at two different tempearture, T1andT2 is as shown in the figure. Which of the two temperatures is lower and why ?
 02:30View Solution
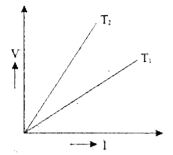
V-I graph for a mettalic wire at two different temperatures T1 and T2 is as shown in figure. WHich of the temperatures T1 and T2 is higher and why.
 02:15View Solution
V−i graph for a metal wire at temperature is as shown in figure
 02:48View Solution
The current - voltage graphs for a given metallic wire at two different temperatures T_1 and T_2 are shown in the figure. The temperature T_2 is greater than T_1 .
01:29View SolutionThe voltage-current (V-I) graph of a metallic conductor at two different temperature T_(1) and T_(2) is shown in figure. At which temperature is the resistance higher?
View SolutionV-I graph for the metallic wires X and Y at constant temperature are as shown in figure: Assuming that the two wires have same length and same diameter, explain as to which of the two wires has higher resistivity and why?
View SolutionV-I graph for a mettalic wire at two different temperatures T1 and T2 is as shown in figure. WHich of the temperatures T1 and T2 is higher and why.
 02:15View Solution
The voltage-current (V-I) graph of a metallic conductor at two different temperature T1 and T2 is shown below. At which, temperature is the resistance higher ?
 View Solution

