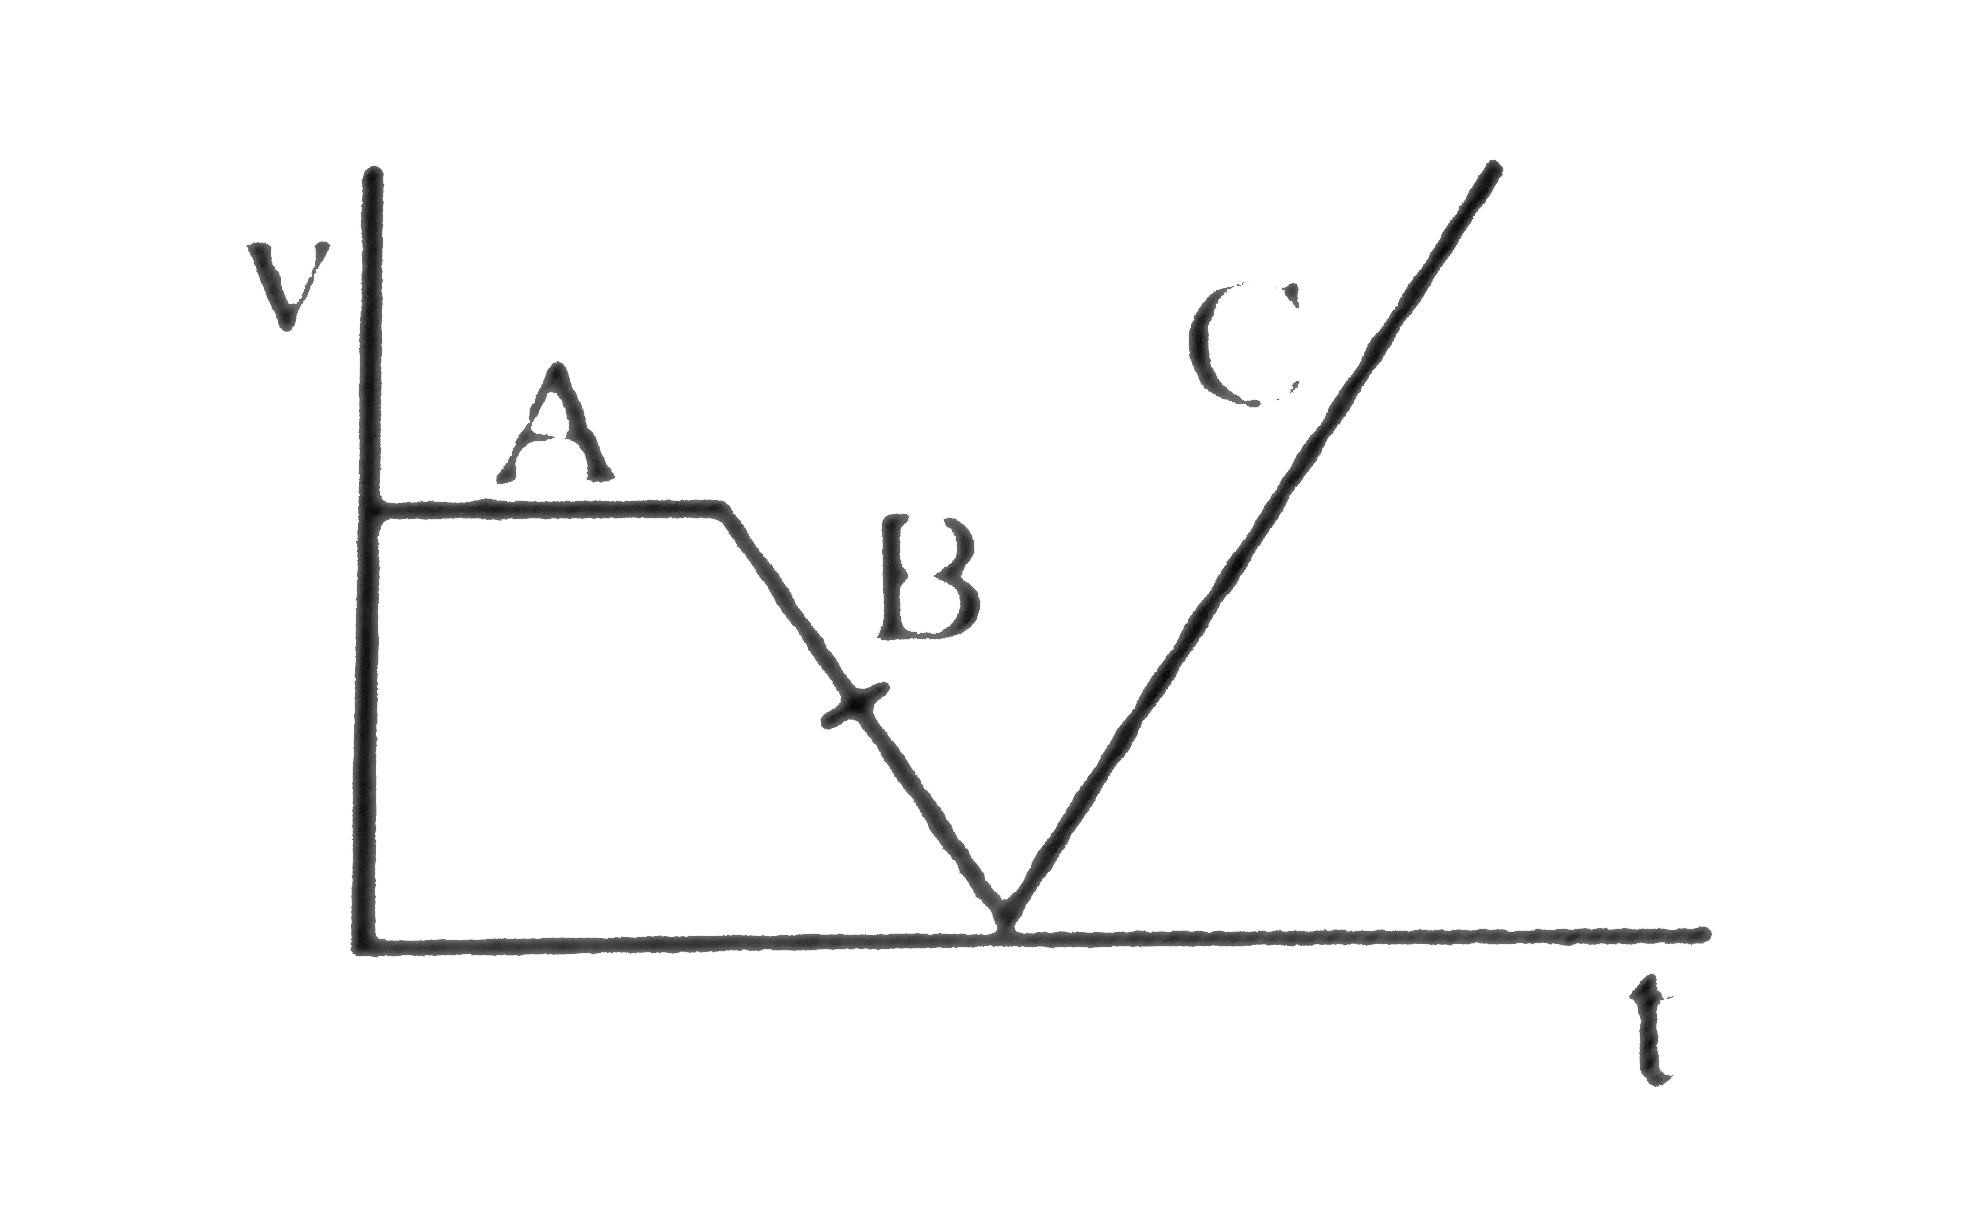
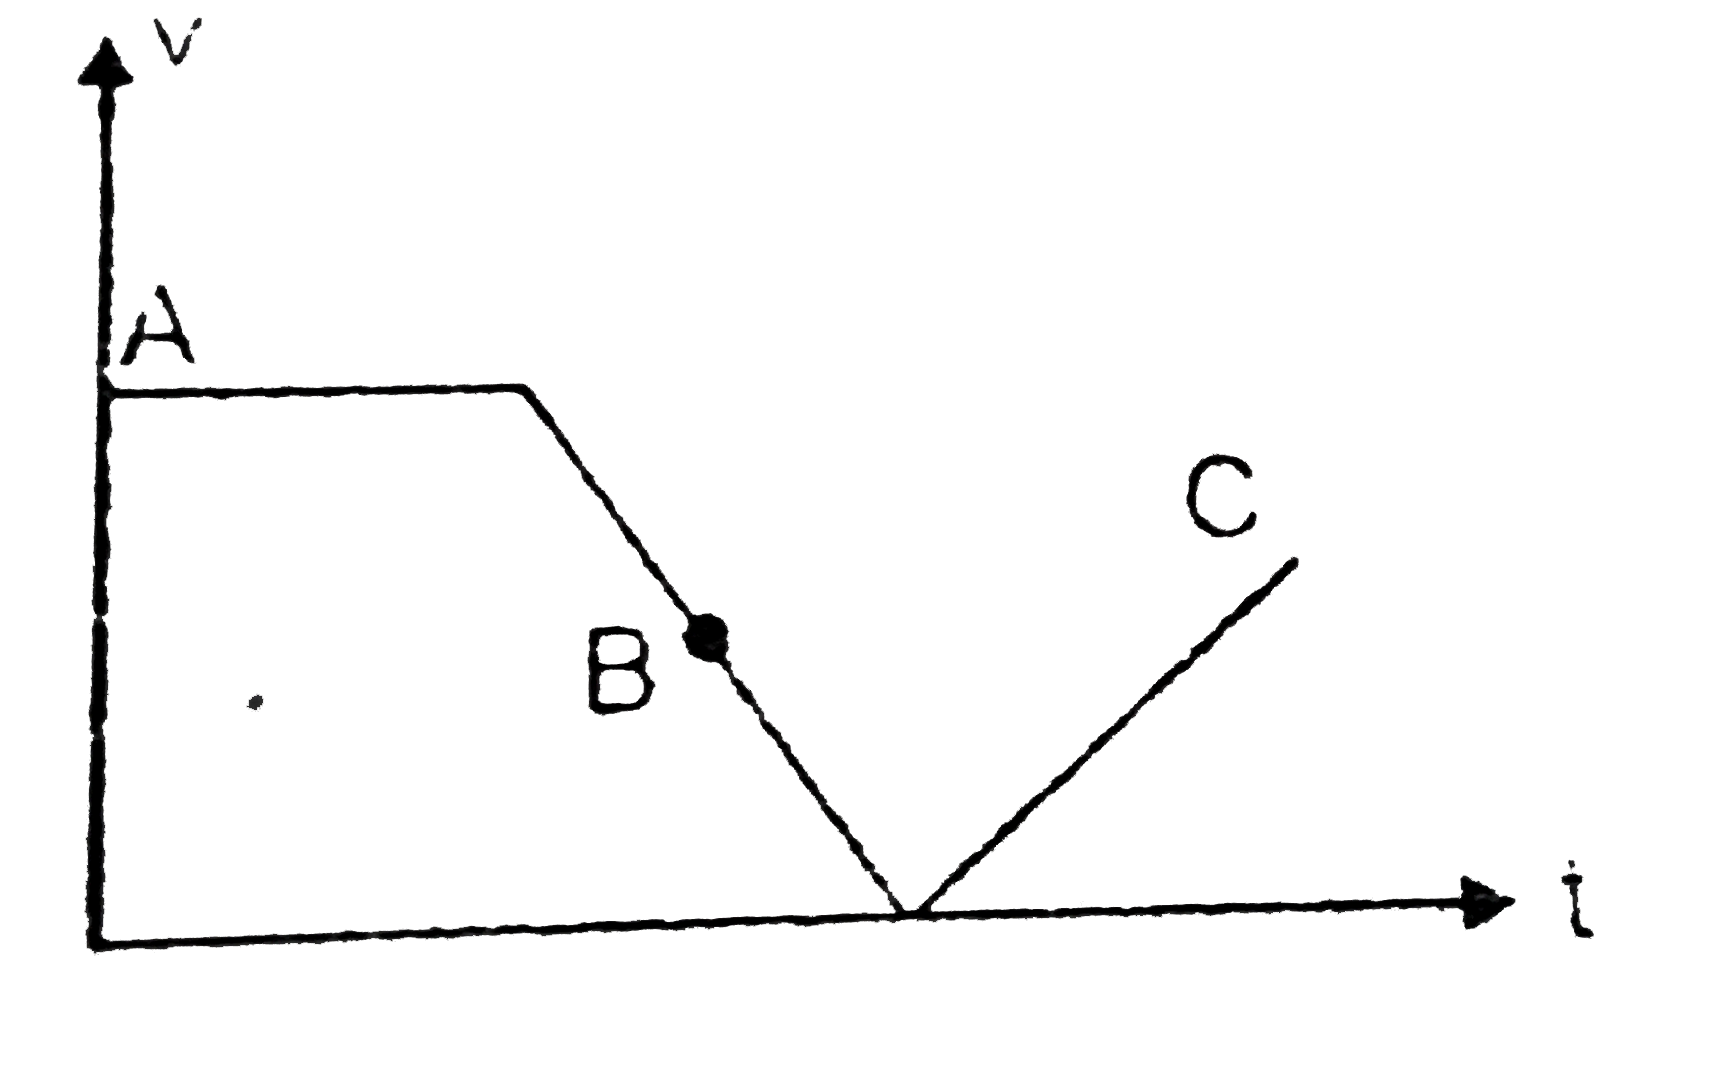
Graph of a body is shown below. It explains that

A
at B force is zero
B
at B there is a force but towards motion
C
at B there is a force which opposes motion
D
at B the force may be in any direction
Text Solution
The correct Answer is:C
|
Topper's Solved these Questions
- LAWS OF MOTIONBOOK - AAKASH SERIESCHAPTER - LAWS OF MOTIONEXERCISE - EXERCISE - II
136 Videos
- LAWS OF MOTIONBOOK - AAKASH SERIESCHAPTER - LAWS OF MOTIONEXERCISE - PRACTICE EXERCISE
108 Videos
- LAWS OF MOTIONBOOK - AAKASH SERIESCHAPTER - LAWS OF MOTIONEXERCISE - QUESTIONS FOR DESCRIPTIVE ANSWER
5 Videos
- KINETIC THEORY OF GASESBOOK - AAKASH SERIESCHAPTER - KINETIC THEORY OF GASESEXERCISE - Practice Exercise
15 Videos
- MECHANICAL PROPERTIES OF FLUIDS BOOK - AAKASH SERIESCHAPTER - MECHANICAL PROPERTIES OF FLUIDS EXERCISE - EXERCISE-3
43 Videos
Similar Questions
Knowledge Check
The veloctiy - time graph of a body is shown in the fig. It implies that at point B.
 AThe force is zeroBThere is a force towards motionCThere is a force which opposes motionDThere is only gravitational force
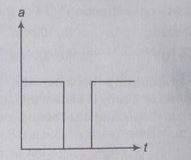
Acceleration time graph of a body is shown below the corresponding velocity time graph of the same body is
 A
A B
B C
C D
D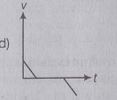
Acceleration time graph of a body is shown below the corresponding velocity time graph of the same body is
 A
A B
B C
C D
D
Velocity versus time graph of a body is shown in figure. It explains that
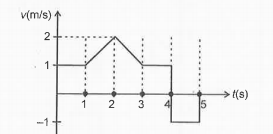
View SolutionThe velocity-time graph of a body is shown below. The displacement covered by body in 5 s is
View SolutionThe velocity time graph of a body is shown in fig. it indicates that :
View SolutionThe velocity time graph of a body is shown in fig. it indicates that :

View Solution
The acceleration time graph of a body is shown below the most probable velocity time graph of the body is
View Solution

