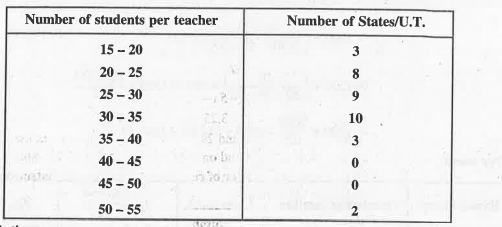
The following distribution gives the state-wise teacher-student ratio in higher secondary schools of India. Find the mode and mean of this data.Interpret, the two measures.
 Solution in Punjabi
Step by step video & image solution for The following distribution gives the state-wise teacher-student ratio in higher secondary schools of India. Find the mode and mean of this data.Interpret, the two measures. by Maths experts to help you in doubts & scoring excellent marks in Class 10 exams.
Topper's Solved these Questions
Similar Questions
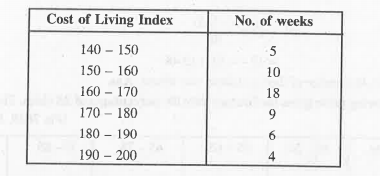
In a city, the following weekly observations were made in a study of cost of living index for the year 1980-81.
 Calculate the mean weekly cost of living index by a suitable method.03:39View Solution
An aeroplane, when 3000 m high, passes vertically above another aeroplane at an instant when the angles of elevation of the two aeroplanes from the same point on the ground are 60∘ and 45∘ respectively. Find the vertical distance between the two aeroplanes.
06:07View SolutionA toy is in the form of a cone mounted on a hemisphere of radius 3.5 cm. The total height of the toy is 15.5 cm. Find the surface area of the toy
02:11View SolutionThe following distribution gives the state-wise teacher-student ratio in higher secondary schools of India. Find the mode and mean of this data. Interpret the two measures.
01:31View SolutionWhich of the following are correct chain isomers of butane ? (i)
02:45View SolutionDetermine the point of symmetry of a regular hexagon.
02:17View SolutionDtermine the images of the following figure about the given line :
05:41View SolutionMatch the following Column A to Column B
 02:10View Solution
Match the following Column A to Column B
 02:17View Solution
Match the following Column A to Column B
 02:10View Solution
The inequation represented by the graph given below is :
09:28View SolutionThe inequation that best describes the graph given below is _________
05:09View SolutionThe inequation that best describes the following graph is _________
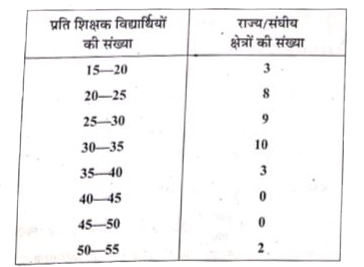
04:11View Solutionनिम्नलिखित बंटन भारत के उच्चतर माध्यमिक स्कूलो में राज्यों के अनुसार शिक्षक - विधार्थी अनुपात को दर्शाता है। इन आकड़ो के बहुलक और माध्य ज्ञात कीजिए। दोनों मापको की व्यख्या कीजिए।
 View Solution
The following distribution gives the state-wise teacher-student ratio in higher secondary schools of India. Find the mode and mean of this data. Interpret the two measures.

 08:06View Solution

