The following distribution distribution given the state-wise, teacher-student ratio in higher secondary schools of India. Find the mode and mean of this data. Interpret the two measures.
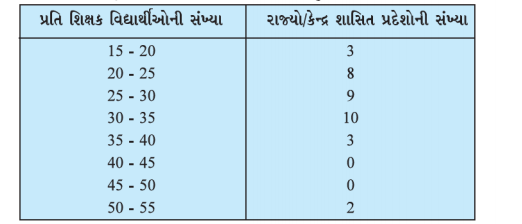
The correct Answer is:Mode : 30.6, Mean = 29.2. Most states/U.T. have a student teacher ratio of 30.6 and on an average, this ratio is 29.2
Topper's Solved these Questions
- STATISTICSBOOK - NCERT GUJARATICHAPTER - STATISTICSEXERCISE - Exercise 14.3
7 Videos
- STATISTICSBOOK - NCERT GUJARATICHAPTER - STATISTICSEXERCISE - Exercise 14.4
3 Videos
- STATISTICSBOOK - NCERT GUJARATICHAPTER - STATISTICSEXERCISE - Exercise 14.1
9 Videos
- SIMILAR TRIANGLES BOOK - NCERT GUJARATICHAPTER - SIMILAR TRIANGLES EXERCISE - TRY THIS
6 Videos
- TANGENTS AND SECANTS TO A CIRCLEBOOK - NCERT GUJARATICHAPTER - TANGENTS AND SECANTS TO A CIRCLEEXERCISE - Try this
2 Videos
Similar Questions
The following distribution gives the state-wise teacher-student ratio in higher secondary schools of India. Find the mode and mean of this data. Interpret the two measures.
View SolutionThe following distribution gives the state-wise teacher-student ratio in higher secondary schools of India. Find the mode and mean of this data. Interprent the two measures.
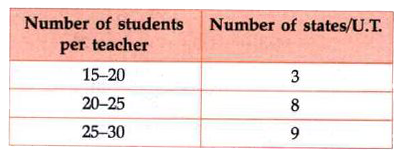
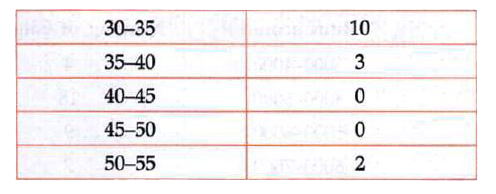
View SolutionThe following distribution gives the state-wise teacher-student ratio in higher secondary schools of India. Find the mode and mean of this data. Interpret, the two measures: Number of students per Teacher Number of States/U.T. 15-20 3 20-25 8 25-30 9 30-35 10 35-40 3 40-45 0 45-50 0 50-55 2
View SolutionThe following table shows the ages of the patients admitted in a hospital during a year:Find the mode and the mean of the data given above. Compare and interpret the two measures of central tendency.
View SolutionThe following table shows the ages of the patients admitted in a hospital during a year:Find the mode and the mean of the data given above. Compare and interpret the two measures of central tendency.
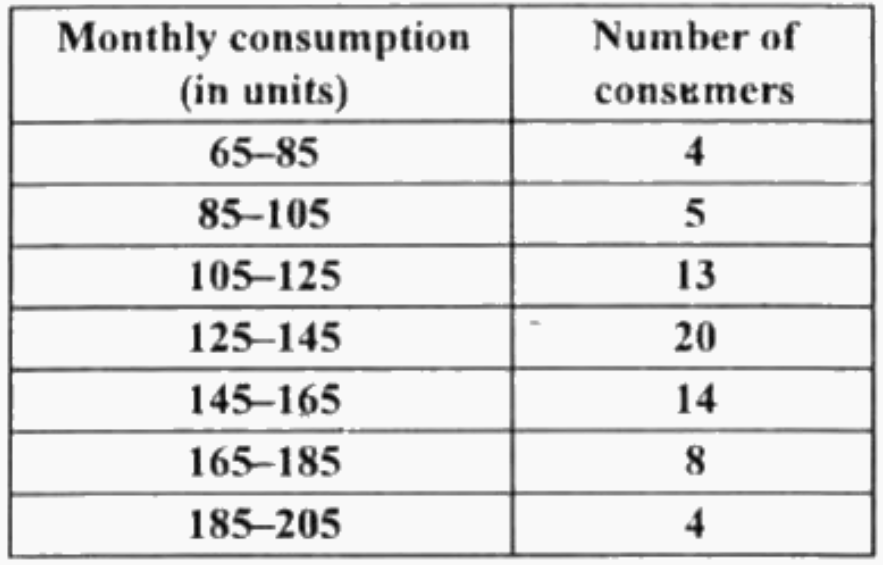
View SolutionThe following frequency distribution gives the monthly consumption of electricity of 68 consumers of a locality. Find the median, mean and mode of the data and compare them.
View SolutionThe following table shows frequency distribution of the number of saplings planted by the students of a school :

Find the modal number of saplings planted.
View SolutionThe distribution given below, shows the marks obtained by 25 students in an aptitude test. Find the median and mode of the distribution.
View SolutionThe marks distribution of 30 students m a mathematics examination are given in Table of Example 1. Find the mode of this data. Also compare and interpret the mode and the mean.
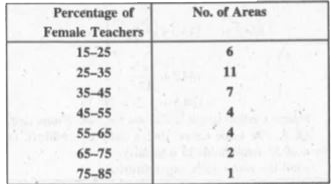
View SolutionThe table below gives the percentage distribution of female teachers in the schools of rural areas. Find the mean percentage of female teachers.
View Solution
