The slope of line plotted between In k versus (1/T) Arrhenius equation is given by
(−Ea2.303R)
(−EaR)
(−Ea2.303R)
(−REa)
To find the slope of the line plotted between ln k versus (1/T) according to the Arrhenius equation, we can follow these steps:
1. Understand the Arrhenius Equation:
The Arrhenius equation is given by:
k=Ae−EaRT
where k is the rate constant, A is the pre-exponential factor, Ea is the activation energy, R is the universal gas constant, and T is the temperature in Kelvin.
2. Take the Natural Logarithm:
Taking the natural logarithm of both sides gives:
lnk=lnA−EaRT
3. Rearranging the Equation:
Rearranging the equation, we have:
lnk=−EaR⋅1T+lnA
This is in the form of y=mx+b, where:
- y=lnk
- x=1T
- m=−EaR (slope)
- b=lnA (y-intercept)
4. Identifying the Slope:
From the rearranged equation, we can see that the slope m of the line plotted between lnk and 1T is:
m=−EaR
5. Conclusion:
Therefore, the slope of the line plotted between lnk versus 1T is given by:
slope=−EaR
Final Answer:
The slope of the line plotted between lnk versus 1T is −EaR.
---
The Arrhenius equation is given by:
k=Ae−EaRT
where k is the rate constant, A is the pre-exponential factor, Ea is the activation energy, R is the universal gas constant, and T is the temperature in Kelvin.
Taking the natural logarithm of both sides gives:
lnk=lnA−EaRT
Rearranging the equation, we have:
lnk=−EaR⋅1T+lnA
This is in the form of y=mx+b, where:
- y=lnk
- x=1T
- m=−EaR (slope)
- b=lnA (y-intercept)
From the rearranged equation, we can see that the slope m of the line plotted between lnk and 1T is:
m=−EaR
Therefore, the slope of the line plotted between lnk versus 1T is given by:
slope=−EaR
The slope of the line plotted between lnk versus 1T is −EaR.
Topper's Solved these Questions
Similar Questions
Knowledge Check
Arrhenius equation may be given as :
Aln.Ak=E0RTBlogA=logk+Ea0.303RTClog[−.EaRT]=(k)Ddlnkdt=EaRTIf we plot a graph between log K and 1T by Arrhenius equation , the slope is
A−EaRB+EaRC−Ea2.303RD+Ea2.303RA graph plotted between log k vs 1T is represented by
A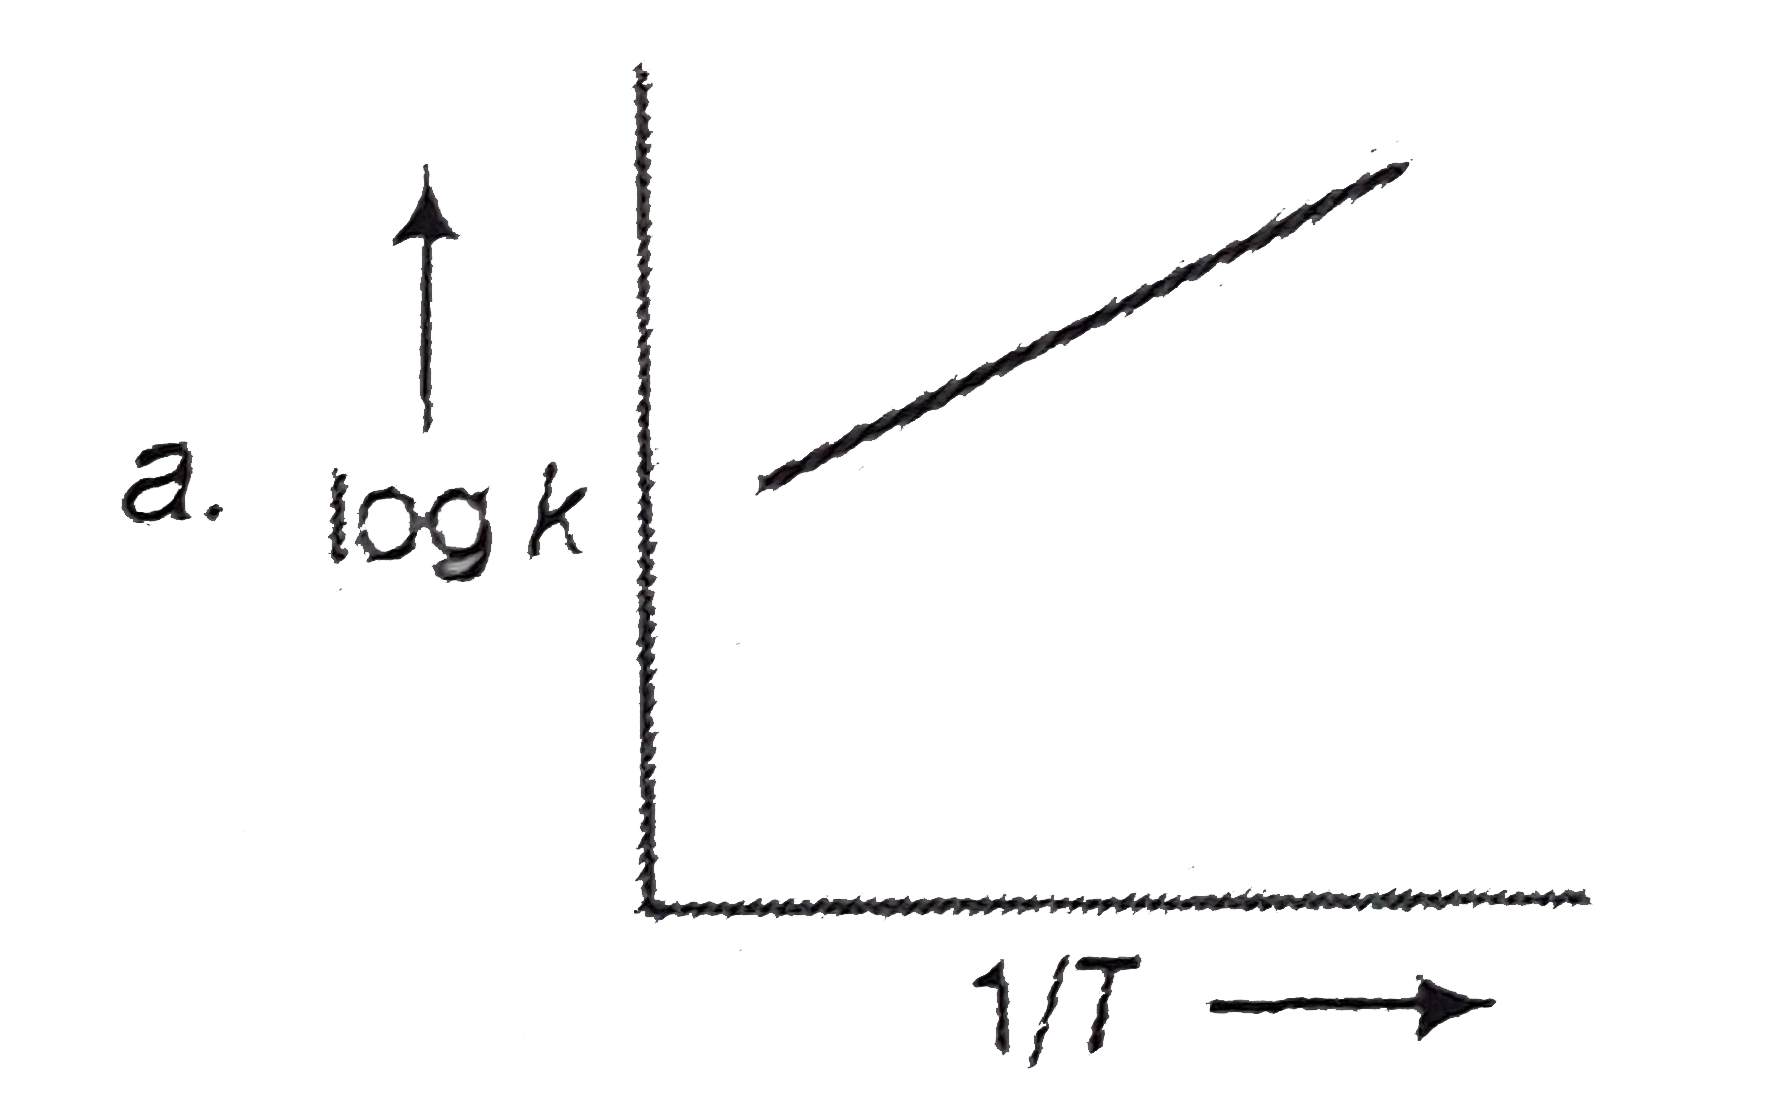 B
B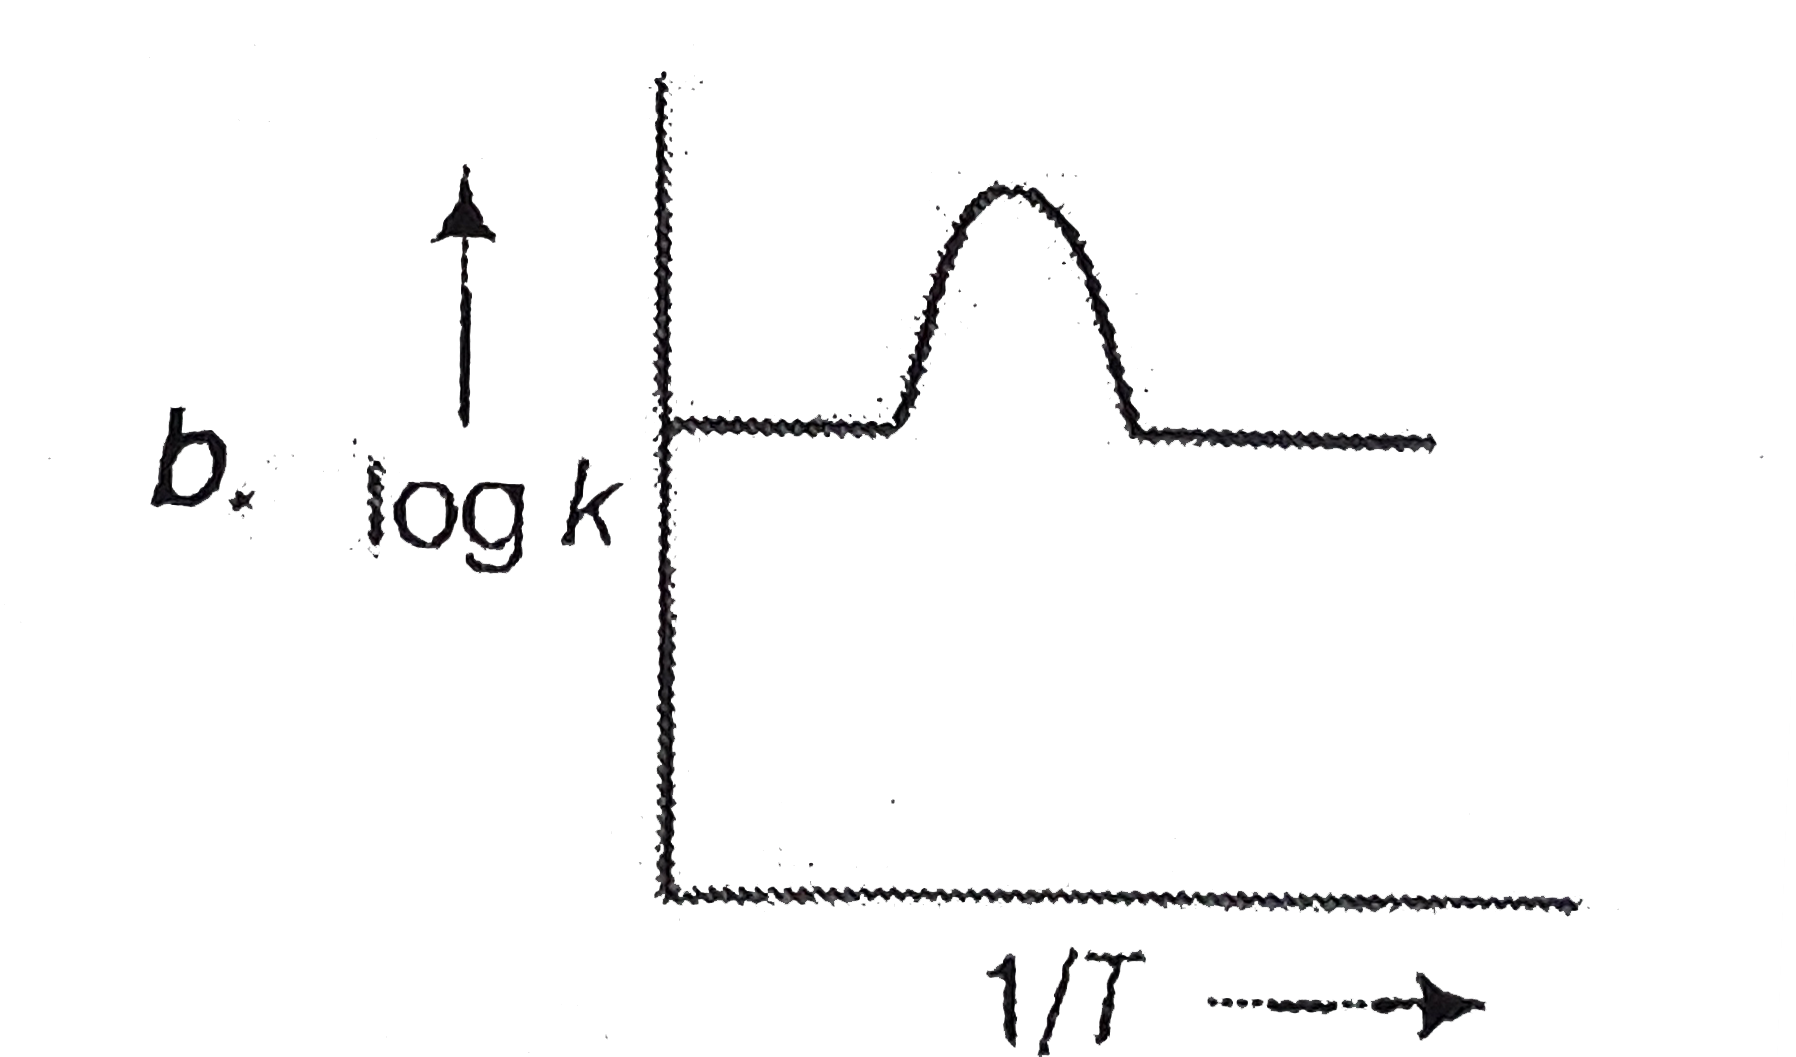 C
C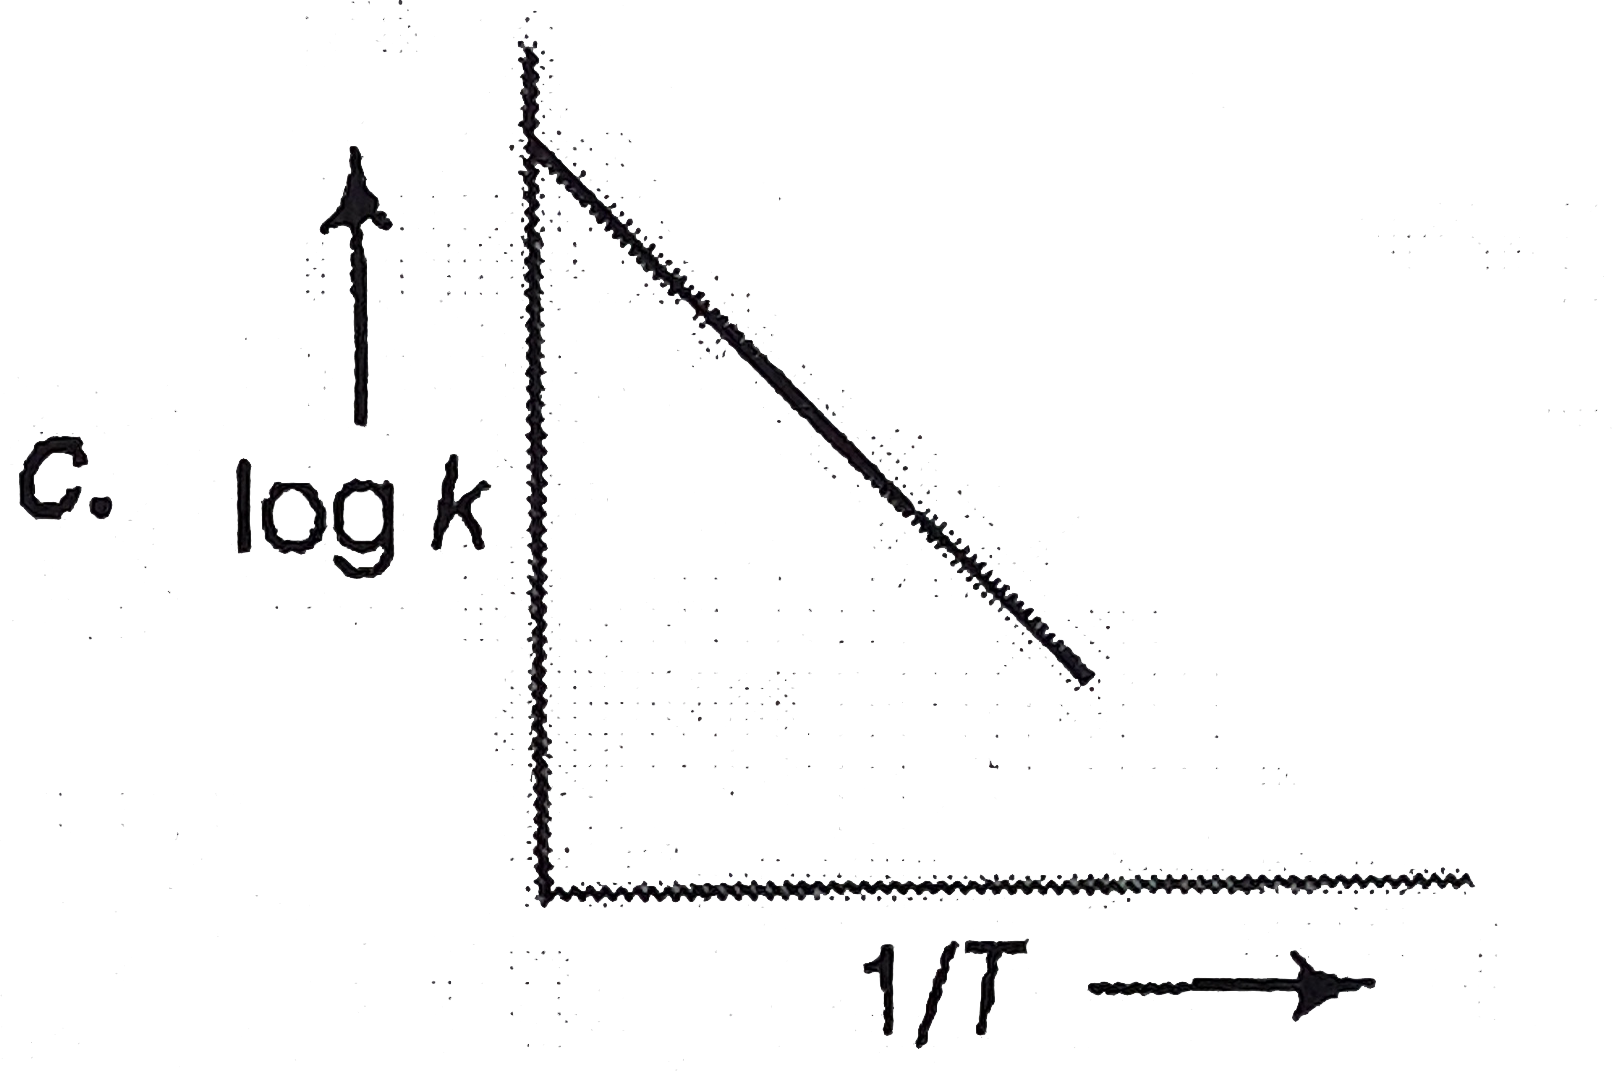 D
D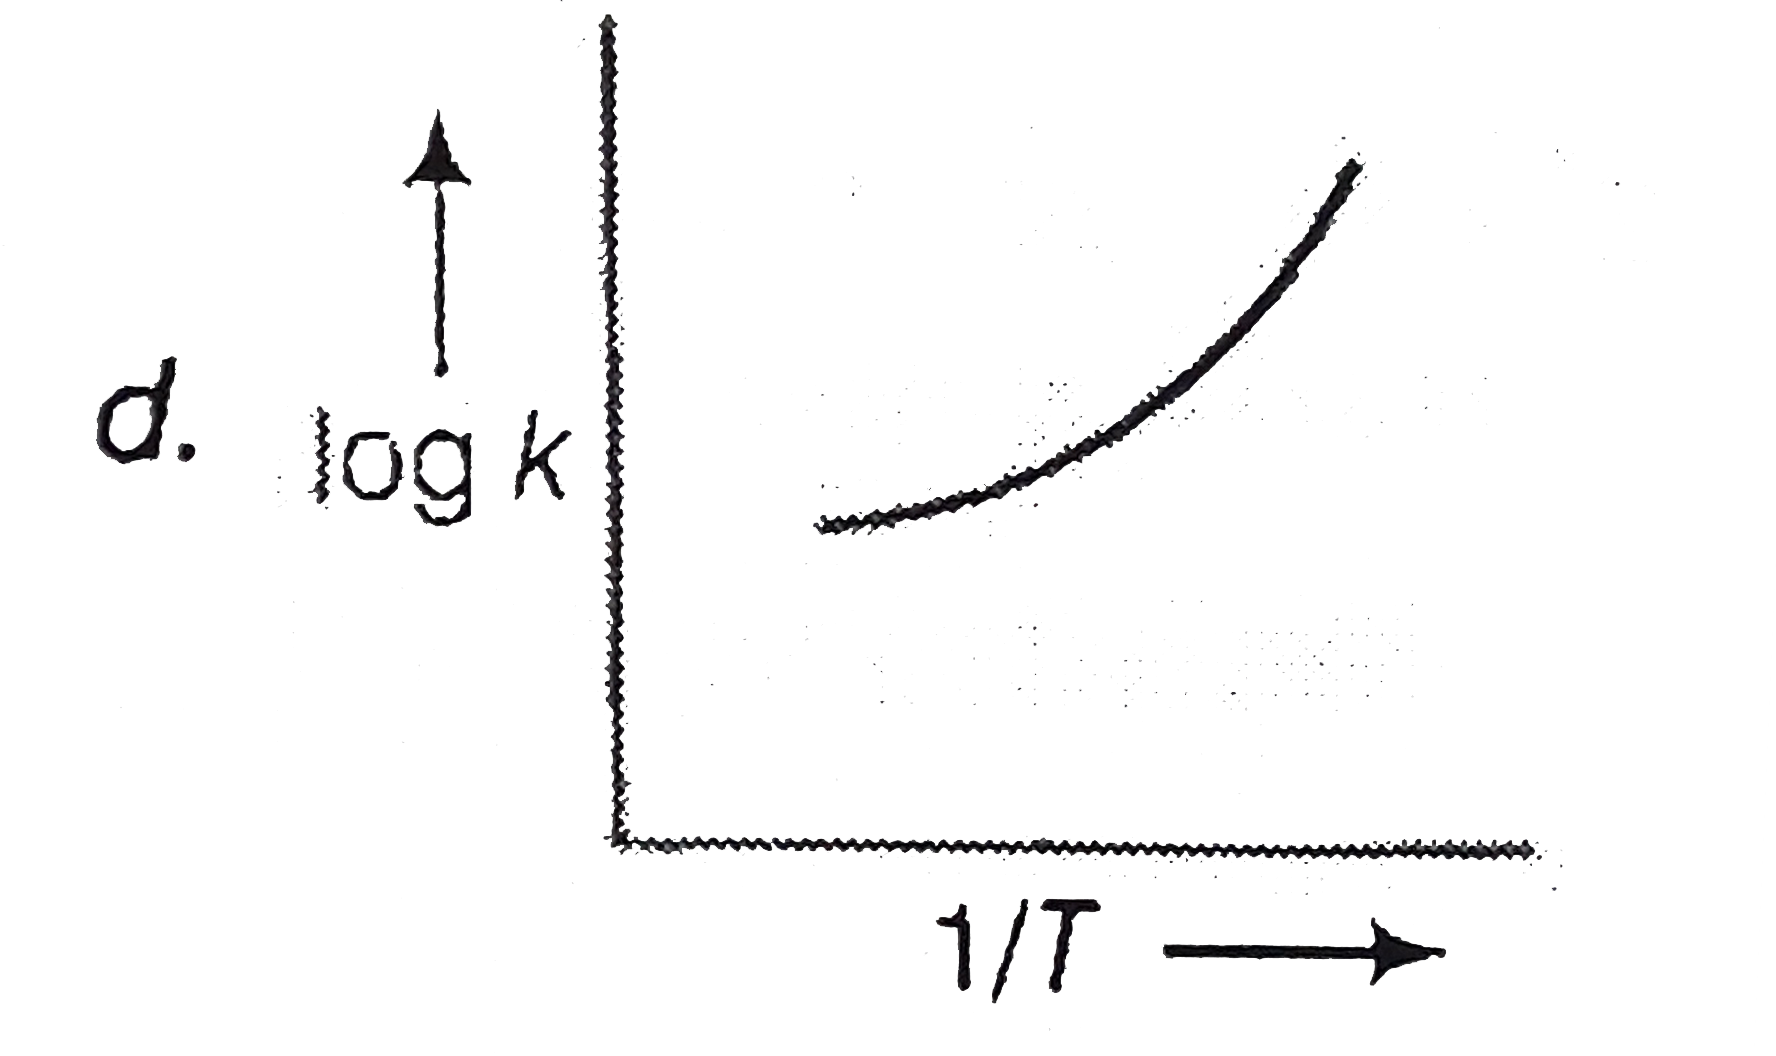
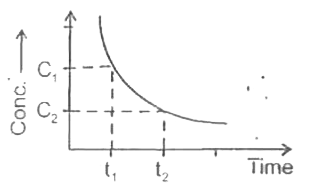
The graph plotted between concentration versus time
View SolutionWhen loge k is plotted against 1T using the Arrhenius equation a straight line is expected with a slope equal to ,
View SolutionA graph plotted between logk versus 1/T for calculating activation energy is shown by
View SolutionA graph plotted between logk versus 1/T for calculating activation energy is shown by
View SolutionThe slope of the plot between pV and p at constant temperature is
View Solution
