The graph shows the relation between potential energy and progress of reaction. Observe the graph and answer the questions. What happen to the amount of enzyme at completion of reaction?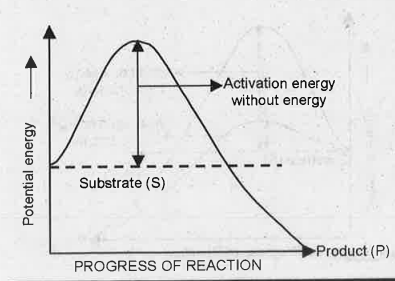 Solution in Malayalam
Step by step video & image solution for The graph shows the relation between potential energy and progress of reaction. Observe the graph and answer the questions. What happen to the amount of enzyme at completion of reaction? by Biology experts to help you in doubts & scoring excellent marks in Class 11 exams.
Topper's Solved these Questions
Similar Questions
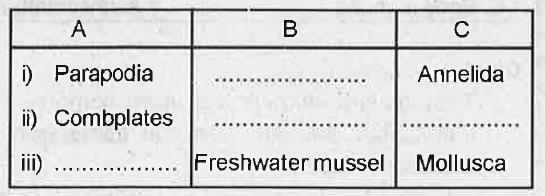
Fill in the blanks.
 03:51View Solution
Name the double walled membrane of human heart. (Cuticle, Pleura, Pericardium, Sarcolemma)
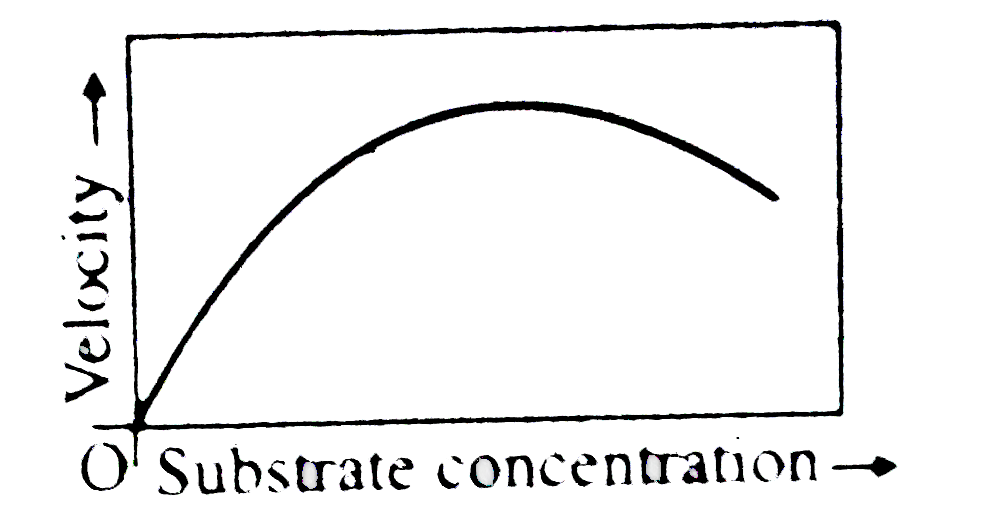
04:33View SolutionThe given graph shows the effect of substrate concentration on the rate of reaction of the enzyme green gram-phosphatase

What dose the graph indicateView SolutionThe given graph shows the effect of substrate concentration on the rate of reaction of the enzymes green gram-phosphatase. What does the graph indicate ?
 View Solution
Following graph between DeltaG and reaction progress in for/can be :
02:25View SolutionThe given graph shows the effect of substrate concentration on the rate of reaction of the enzyme green-gram-phosphatase What does the graph indicate?
02:44View SolutionDraw the graphs between potential energy - reaction coordinates for catalysed and uncatalysed reactions.
03:39View SolutionDraw a graph of potential energy v/s reaction co-ordinate showing the effect of a catalyst on activation energy.
04:28View Solutionऊष्माक्षेपी अभिक्रिया के लिए सक्रियण ऊर्जा दर्शाने वाला ग्राफ दीजिये।
04:28View Solutionअभिक्रिया (reaction) के लिए कौन-सा ग्राफ शून्य सक्रियण ऊर्जा दर्शाता है।
02:26View Solutionअभिक्रिया के लिए कौनसा ग्राफ शून्य सक्रियण ऊर्जा दर्शाता है
03:29View SolutionDraw a graph of potential energy V/S reaction co - ordinates showing the effect of catalyst on activation energy (Ea) of a reaction.
01:51View SolutionProgress of a chemical reaction and potential energy changes associated with it is plotted as curve.
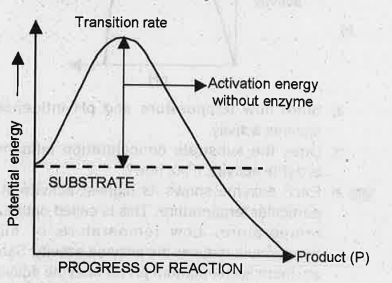 What happens to the activation energy of the substrate, when enzyme is added to the reaction system?02:26View Solution
Observe the graph showing the activity of an enzyme influenced by pH.
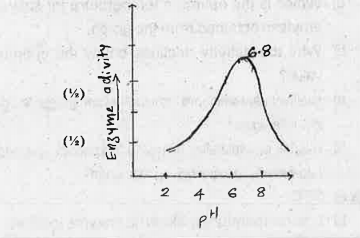 Name the possible enzyme involved in this reaction.View Solution
Draw a graph of potential energy V/S reaction co - ordinates showing the effect of catalyst on activation energy (E_(a)) of a reaction.
04:29View Solution

