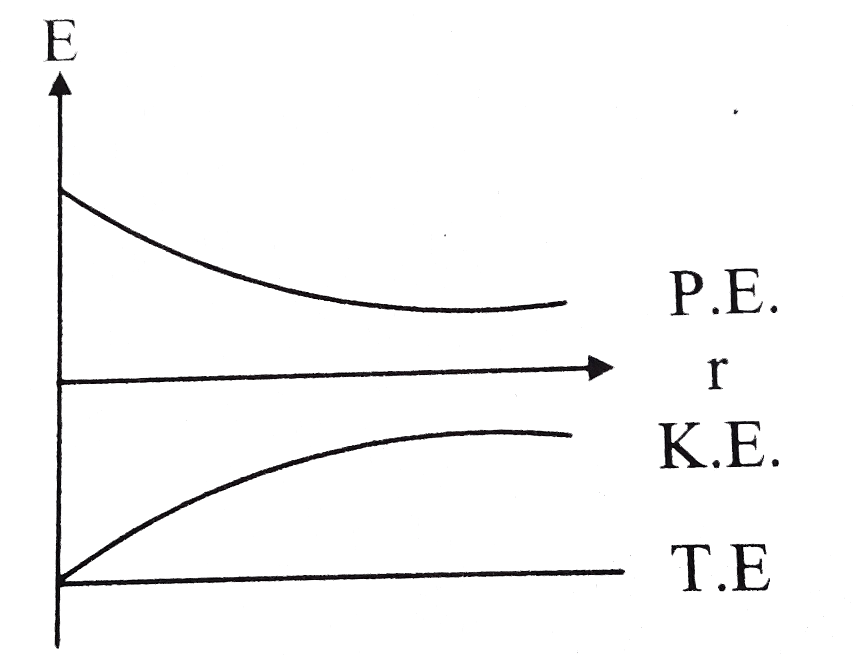
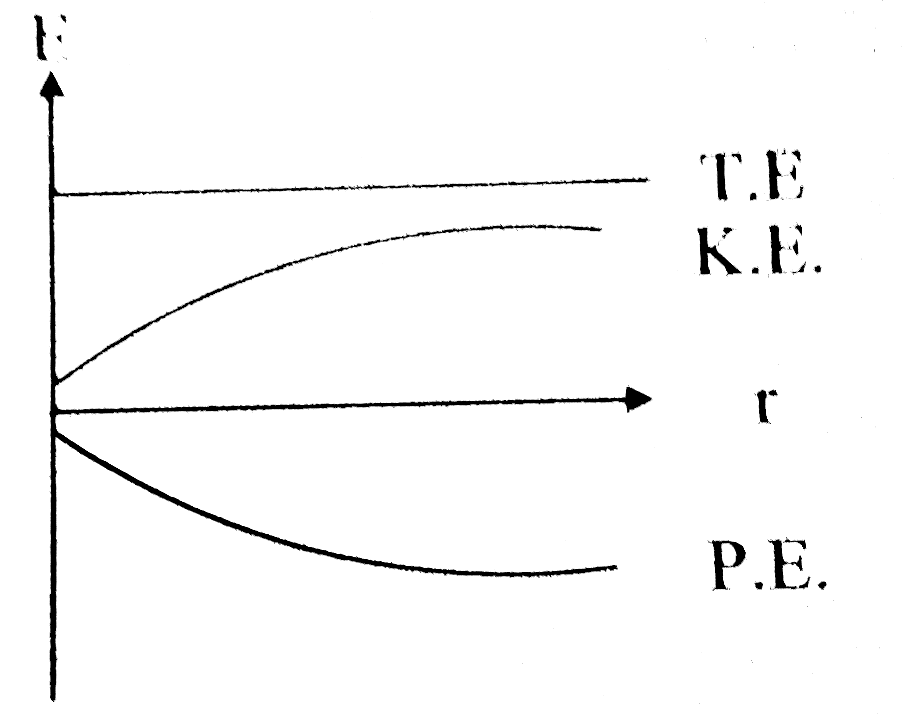
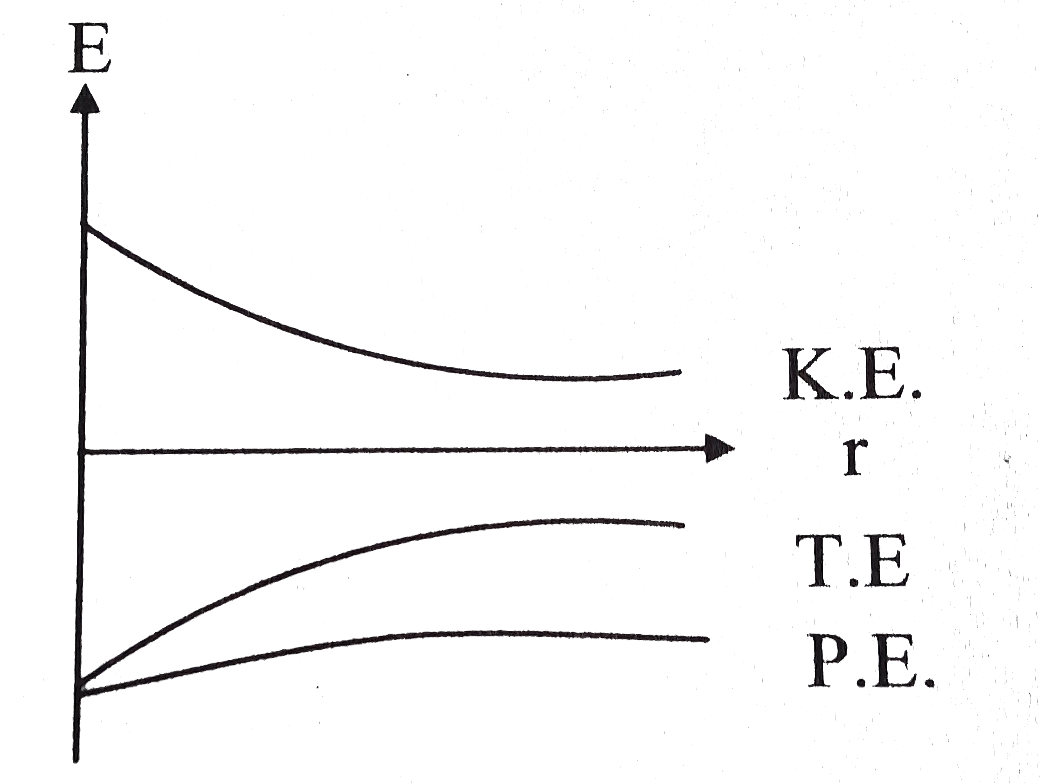
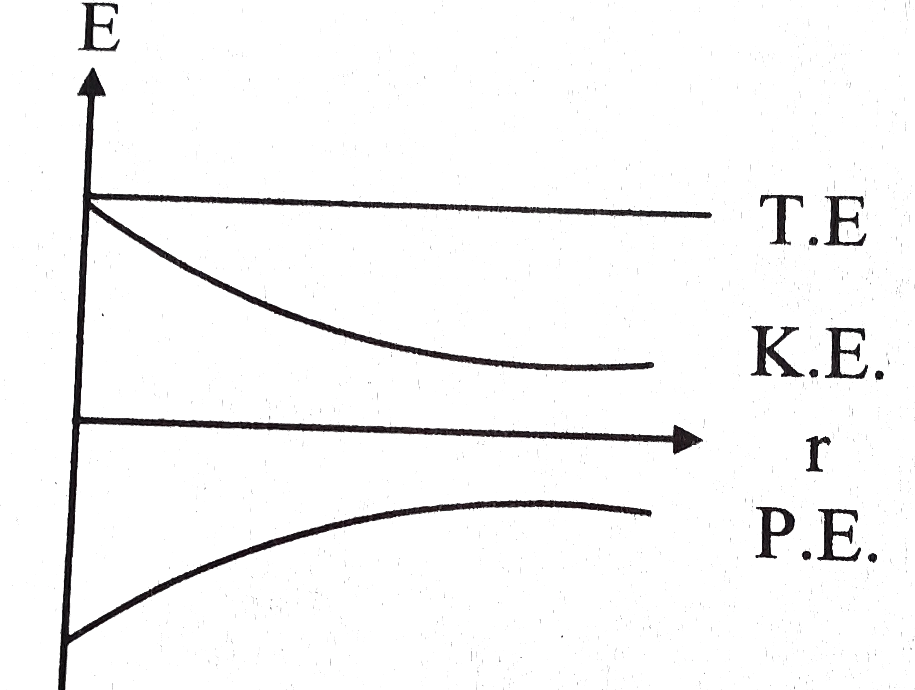
The correct graph representing the variation of total energy (Et), kinetic energy (Ek) and potential energy (U) of a satellite with its distance form the centre of earth is Solution in Marathi


The correct Answer is:C
Step by step video & image solution for The correct graph representing the variation of total energy (E_(t)), kinetic energy (E_(k)) and potential energy (U) of a satellite with its distance form the centre of earth is by Physics experts to help you in doubts & scoring excellent marks in Class 12 exams.
Updated on:21/07/2023Similar Questions
An artificial satellite moving in a circular orbit around the earth has a total energy E0. Its potential energy is
View Solutionएक उपग्रह की कुल ऊर्जा, गतिज ऊर्जा (K) तथा स्थितिज ऊर्जा (U) की पृथ्वी के केन्द्र से दूरी के साथ वृद्धि को निम्न ग्राफ से सही प्रकार प्रदर्शित किया जाता है
View SolutionAn artificial satellite moving in a circular orbit around the earth has a total energy E_(0) . Its potential energy is
View SolutionAn artificial satellite moving in a circular orbit at a distance h from the centre of the earth has a total energy E0. Its potential energy is
View SolutionThe correct graph representing the variation of total energy (E_(t)) , kinetic energy (E_(k)) and potential energy (U) of a satellite with its distance form the centre of earth is
View SolutionThe correct graph representing the variation of total energy (E) kinetic energy (K) and potential energy (U) of a satellite with its distance from the centre of earth is
View SolutionAn artificial satellite moving in a circular orbit around the earth has a total energy E_(0) . Its potential energy is
View Solution
