The correct graph representing the variation of total energy (E) kinetic energy (K) and potential energy (U) of a satellite with its distance from the centre of earth is
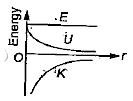
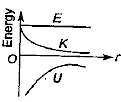
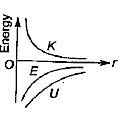
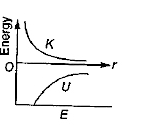
The correct Answer is:C
If r<R then F =GMmR3r=mv2r=GMmR3r⇒v∝r
If r>r then F =GMmr2∴mv2r=GMmr2⇒v∝1r
Similar Questions
The correct graph representing the variation of total energy (Et), kinetic energy (Ek) and potential energy (U) of a satellite with its distance form the centre of earth is
View SolutionThe gravitational potential energy of a body at a distance r from the centre of earth is U. Its weight at a distance 2r from the centre of earth is
View Solution
Knowledge Check
The correct graph representing the variation of total energy (Et), kinetic energy (Ek) and potential energy (U) of a satellite with its distance form the centre of earth is
A B
B C
C D
D
For a simple harmonic oscillator moving along a straight line, the graphs which represent the variation of kinetic energy K, potential energy U and total energy T with displacement are
A B
B C
C D
D
The gravitational potential energy of a body at a distance r from the centre of earth is U. Its weight at a distance 2r from the centre of earth is
AUrBU2rCU4rDU√2r
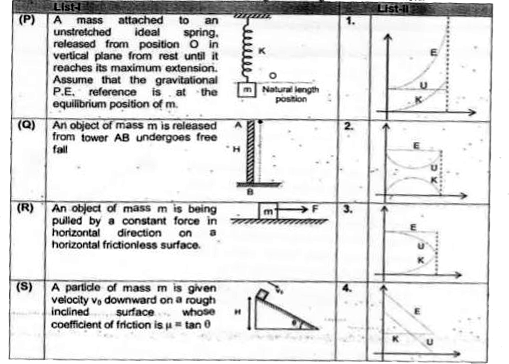
The physical situation in List-I with graphs of the variation of total energy (E), potential energy (U) and kinetic energy ( K) with time in List-II are given. Match the statements from List I with those in List II and select the correct answer using the code given below the lists.
View SolutionRepresent graphically the variation of kinetic energy (Ek), potential energy (Ek) and total energy (E ) of a body falling freely from a height h. At what height is Ep=Ek?
View SolutionThe gravitational potential energy of a body at a distance r from the centre of earth is U. Its weight at a distance 2r from the centre of earth is
View SolutionThe physical situation in List-I with graphs of the variation of total energy (E), potential energy (U) and kinetic energy ( K) with time in List-II are given. Match the statements from List I with those in List II and select the correct answer using the code given below the lists.

View SolutionThe magnitude of gravitational potential energy of a body at a distance r from the centre of earth is u. Its weight at a distance 2r from the centre of earth is
View Solution
