Following graphs show the variation of stopping potential corresponding to the frequency of incident radiation (F) for a given metal. The correct variation is shown in graph (V0= Threshold frequency)
 Solution in Marathi
1
2
3
4
The correct Answer is:A
Step by step video & image solution for Following graphs show the variation of stopping potential corresponding to the frequency of incident radiation (F) for a given metal. The correct variation is shown in graph (V_0=" Threshold frequency") by Physics experts to help you in doubts & scoring excellent marks in Class 11 exams.
Updated on:21/07/2023Topper's Solved these Questions
- ELECTRONS AND PHOTONSBOOK - TARGET PUBLICATIONCHAPTER - ELECTRONS AND PHOTONSEXERCISE - Evaluation Test
19 Videos
- ELECTRONS AND PHOTONSBOOK - TARGET PUBLICATIONCHAPTER - ELECTRONS AND PHOTONSEXERCISE - Critical thinking
22 Videos
- COMMUNICATION SYSTEMSBOOK - TARGET PUBLICATIONCHAPTER - COMMUNICATION SYSTEMSEXERCISE - Evaluation Test
15 Videos
- ELECTROSTATICSBOOK - TARGET PUBLICATIONCHAPTER - ELECTROSTATICSEXERCISE - EXCERCISE
156 Videos
Similar Questions
Relation between the stopping potential V0 of a metal and the maximum velocity of the photoelectrons is
View SolutionIf the work function of a metal is 'ϕ' and the frequency of the incident light is 'v', there is no emission of photoelectron if
View SolutionThe critcal frequency for sky wave propagation if maximum number density of electrons in ionosphere is 1010m−3 is
View SolutionElectrostatic means study of
View SolutionDraw a graph showing the variation of stopping potential with frequency of the incident on a metal plate. How can the value of Planck's constant be determined from this graph?
View SolutionThe graph shows variation of stopping potential V_(0) versus frequency of incident radiation v for two photosensitive metals A and B . Which of two metals has higher threshold frequency and why?
View SolutionDraw a graph to show the dependence of stopping potential on the frequency of incident light in case of photoelectric effect. Indicate the threshold frequency in the graph.
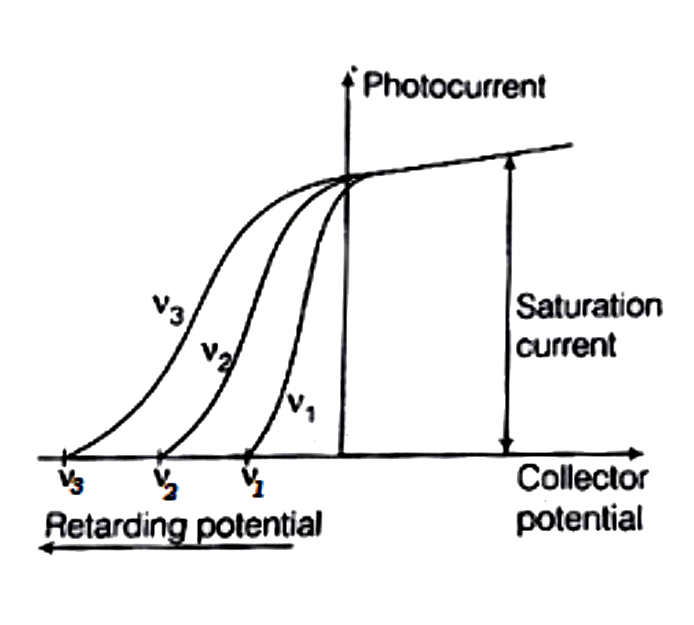
View SolutionThe variation of photocurrent with collector potential for different frequencies of incident radiation v1,v2,v3 is as shown in the the graph , then

View SolutionDraw a graph between stopping potential and the frequency of two metals A and B having threshold frequencies v_0 and 2v_0 .
View SolutionDraw and explain the graph showing the variation of stopping potential with frequency of incident radiation in relation to photoelectric effect.
View SolutionDefine photoelectric effect. Draw a graph to show the variation of stopping potential with frequency of incident radiation on a metal plate.
View SolutionEnergy corresponding to threshold frequency of metal is 6.2 eV.For given radiation stopping potential is 5 V then incident radiation will be in …region.
View SolutionThe graph shows variation of stopping potential V_(0) versus frequency of incident radiation v for two photosensitive metals A and B . Which of two metals has higher threshold frequency and why?
View SolutionThe threshold frequency for a metallic surface corresponds to an energy of 6.2eV and the stopping potential for a radiation incident on this surface is 5V. The incident radiation lies in
View SolutionThe variation of photo-current with collector potential for different frequencies of incident radiation V_1,V_2 and V_3 is as shows in the graph, then
View Solution
