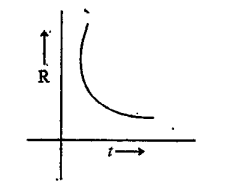
Plot a graph showing the variation of resistance of conducting wire as a function of it's radius keeping the length of a wire and temperature as constant.

or
Hence, the graph of R versus r is as shown in the graph.
Topper's Solved these Questions
Similar Questions
Plot a graph showing the variation of resistance of a conducting wire as function of its radius, keeping the length of a wire and its temperature as constant.
View SolutionDraw a graph to show the variation of resistance of a metal wire as a function of its diameter, keeping length and temperature constant.
View Solution
Knowledge Check
Resistivity of a conducting wire :
Avaries with its lengthBvaries with massCvaries with is cross-sectionDis independent of its demensions.
Show variation of resistivity of copper as a function of temperature in a graph.
View SolutionShow variation of resistivity of copper as a function of temperature in a graph.
View SolutionShow variation of resistivity of copper as a function of temperature in a graph.
View SolutionShow variation of resistivity of copper as a function of temperature in a graph.
View SolutionSketch a graph showing variation of resistivity with temperature of (i) Copper (ii) Carbon.
View SolutionShow variation of resistivity of SI with temperature in a graph.
View SolutionShow on a graph the variation of resistivity with temperature for a typical semiconductor
View Solution
