Graph of velocity (v) versus time 't' for motion of a motorbike which starts from rest and moves along a stright road is given .
(a) Find the average acceleration for the time interval t0=0→t1=6.0s
(b)Estimate the time at which the acceleration has its greatest positive value and the value of the acceleration at the instant.
(c) When is the acceleration is zero?
(d) Estimate the maximum negative value of the acceleration and the time at which it occurs.
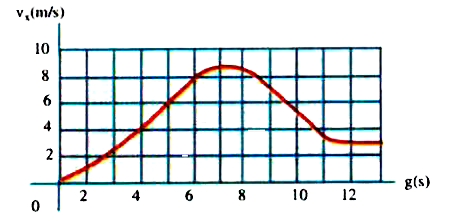
The correct Answer is:(a)1.3ms−2;(b)2ms−2at 3 s;(c) at t=6sand for t>10s;(d)−1.5ms−2at 8s
Topper's Solved these Questions
- MOTION IN A STRAIGHT LINEBook:AAKASH SERIESChapter:MOTION IN A STRAIGHT LINEExercise:EXERCISE (LEVEL 2)
Explore 28 Videos
- MOTION IN A STRAIGHT LINEBook:AAKASH SERIESChapter:MOTION IN A STRAIGHT LINEExercise:Questions for Descriptive Answers
Explore 7 Videos
- MOTION IN A STRAIGHT LINEBook:AAKASH SERIESChapter:MOTION IN A STRAIGHT LINEExercise:Very Short Answer Type Questions
Explore 15 Videos
- MOTION IN A PLANE Book:AAKASH SERIESChapter:MOTION IN A PLANE Exercise:Practice Exercise
Explore 84 Videos
- NEWTONS LAWS OF MOTION Book:AAKASH SERIESChapter:NEWTONS LAWS OF MOTION Exercise:ADDITIONAL PRACTICE EXERCISE PRACTICE SHEET (ADVANECED) (Matrix Matching Type Questions)
Explore 1 Video
Similar Questions
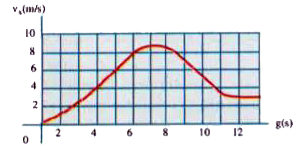
Graph of velocity (v) versus time 't' for motion of a motorbike which starts from rest and moves along a stright road is given .
(a)Find the average acceleration for the time interval t0=0 to t1=6.0 s
(b) Estimate the time at which the acceleration has its greatest positive value and the value of the acceleration at that instant.
(c) When is the acceleration is zero ?
(d) Estimate the maximum negative value of the acceleration and the time at which it occurs.
View SolutionA body is moving with variable acceleartion (a) along a straight line. The average acceleration of body in time interval t1 to t2 is :-
View Solution
Knowledge Check
A body is moving with variable acceleartion (a) along a straight line. The average acceleration of body in time interval t1 to t2 is :-
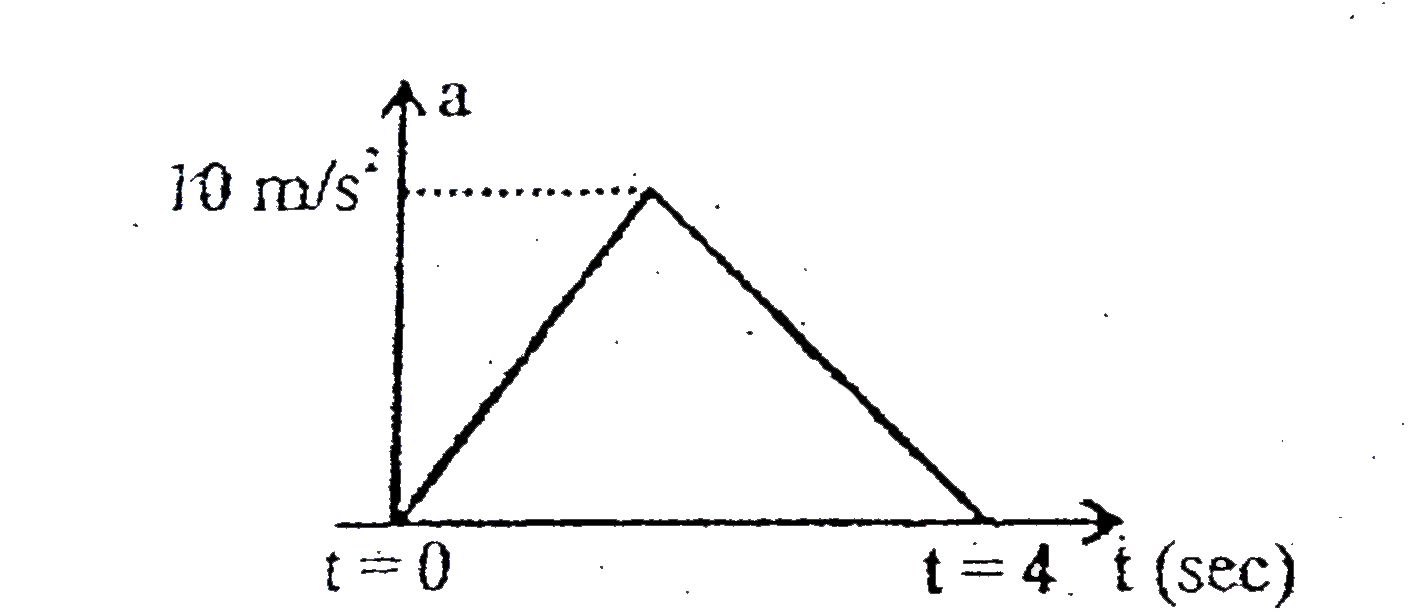
Aa[t2+t1]2Ba[t2−t1]2Ct2∫t1a dtt2+t1Dt2∫t1a dtt2−t1Acceleration time graph of a particle moving along a straight line is given. Then average acceleration between t=0 & t=4 is :−
 A0m/s2B5m/s2C10m/s2D7.5m/s2
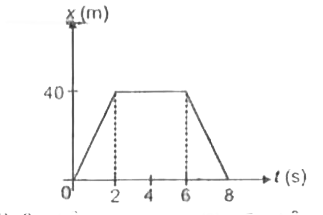
The position (x) of a particle moving along x - axis veries with time (t) as shown in figure. The average acceleration of particle in time interval t = 0 to t = 8 s is
 A3m/s2B−5m/s2C−4m/s2D2.5m/s2
Acceleration time graph of a particle moving along a straight line is given. Then average acceleration between t=0 & t=4 is :−

View SolutionA particle starts motion from rest and moves along a straight line. Its acceleration-time graph is shown. Find out speed of particle at t=2s and at t=3s.
View SolutionA particle starts motion from rest and moves along a straight line. Its acceleration-time graph is shown. Find out speed of particle at t=2s and at t=3s.
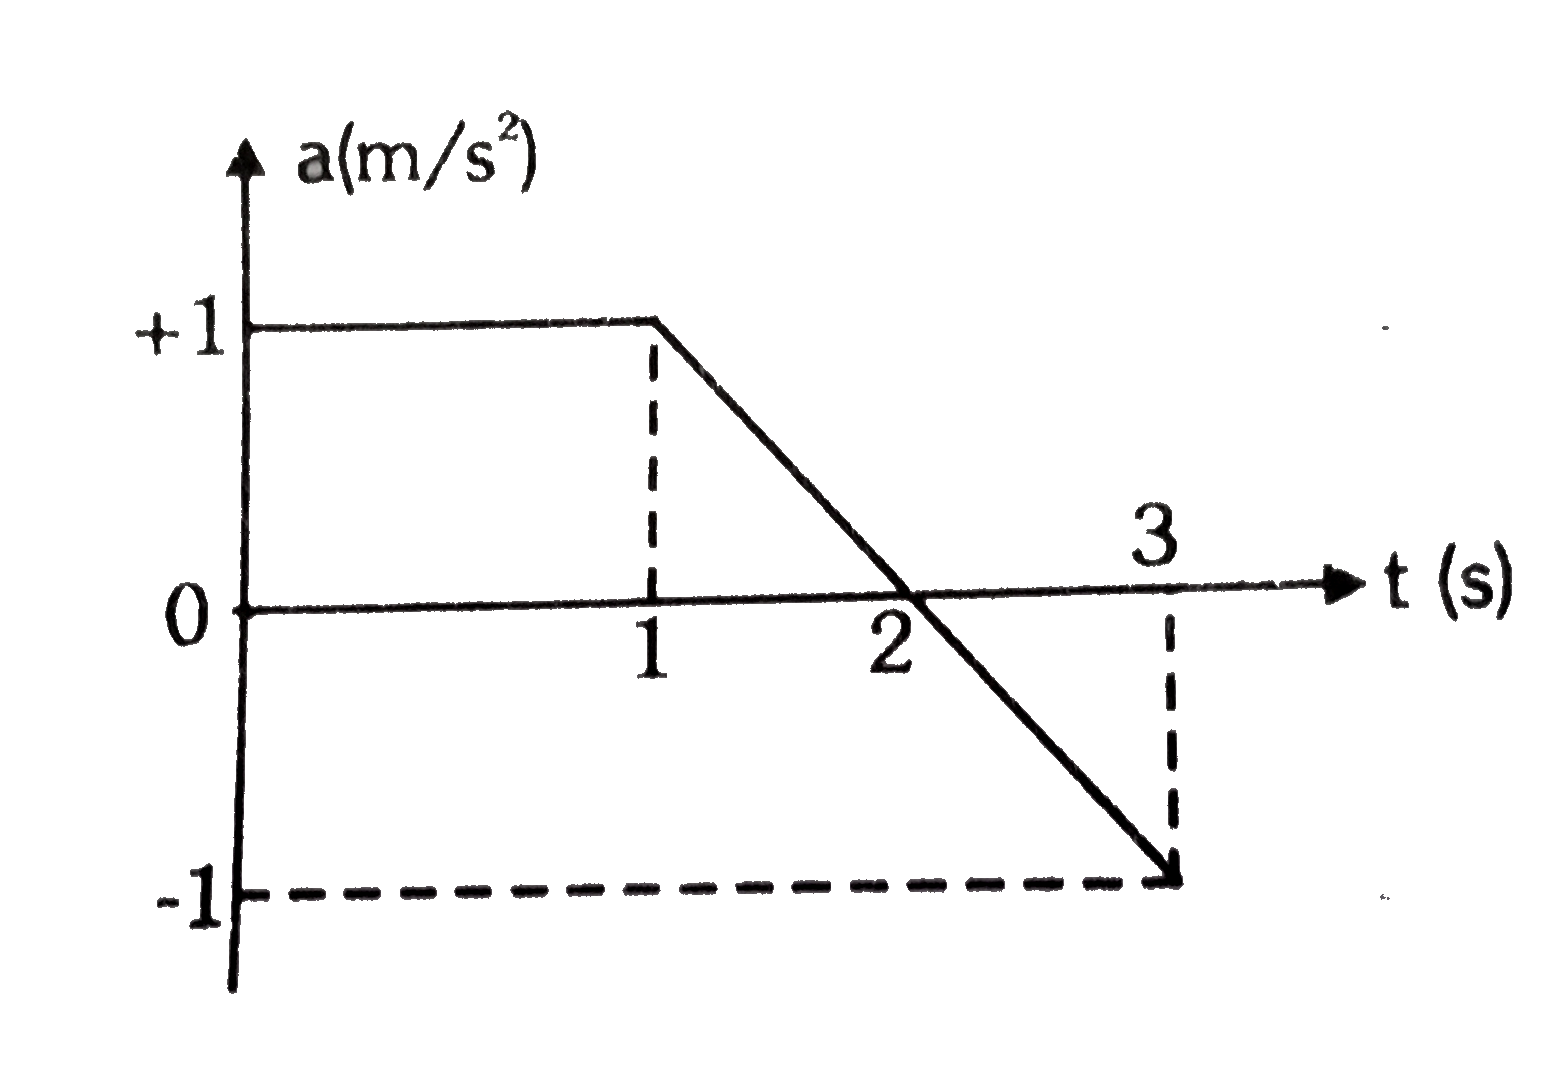
View SolutionA particle starts motion from rest and moves along a straight line. Its acceleration-time graph is shown. Find out speed of particle at t=2s and at t=3s.

View SolutionThe position (x) of a particle moving along x - axis veries with time (t) as shown in figure. The average acceleration of particle in time interval t = 0 to t = 8 s is

View Solution
