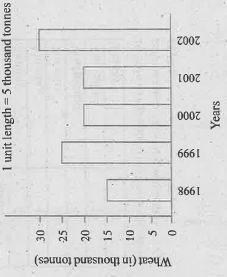
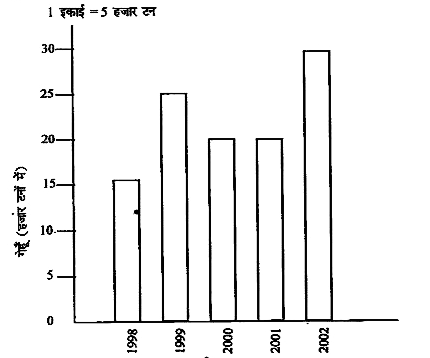
The baar graph given alongside shows the amount of wheat purchased by government during the year 1998-2002. Read the bar graph and write down your observations. In which year was (b) the wheat production minimum?
 Solution in Kannada
Step by step video & image solution for The baar graph given alongside shows the amount of wheat purchased by government during the year 1998-2002. Read the bar graph and write down your observations. In which year was (b) the wheat production minimum? by Maths experts to help you in doubts & scoring excellent marks in Class 6 exams.
Updated on:21/07/2023Topper's Solved these Questions
Similar Questions
Find the rule which gives the number of matchsticks required to make the following matchstick patterns. Use a variable to write the rule. (a) A pattern f letter Z as
View SolutionWrite the fraction representing the place value blocks. (a)
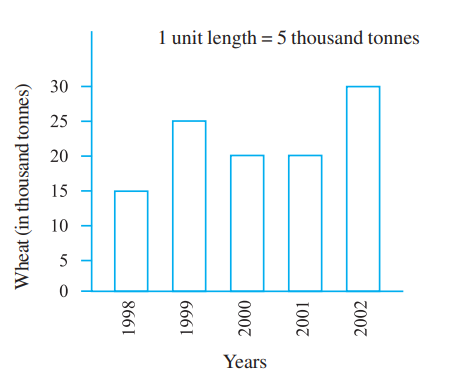
View SolutionThe bar graph given alongside shows the amount of wheat purchasedby government during the year 1998-2002. Read the bar graph andwrite down your observations. In which year was(a) the wheat production maximum?(b) the wheat production minimum?
View SolutionDetermine the point of symmetry of a regular hexagon.
View SolutionMatch the following Column A to Column B

View SolutionMatch the following Column A to Column B

View SolutionMatch the following Column A to Column B

View SolutionThe inequation represented by the graph given below is :
View SolutionThe inequation that best describes the graph given below is _________
View SolutionThe inequation that best describes the following graph is _________
View SolutionWhich inequations represent the shaded region in the given figure
View Solutionनीचे दिया हुआ दंड आलेख वर्ष 1998−2002 में सरकार द्वारा खरीदे गए गेहु की मात्रा दर्शाता है :
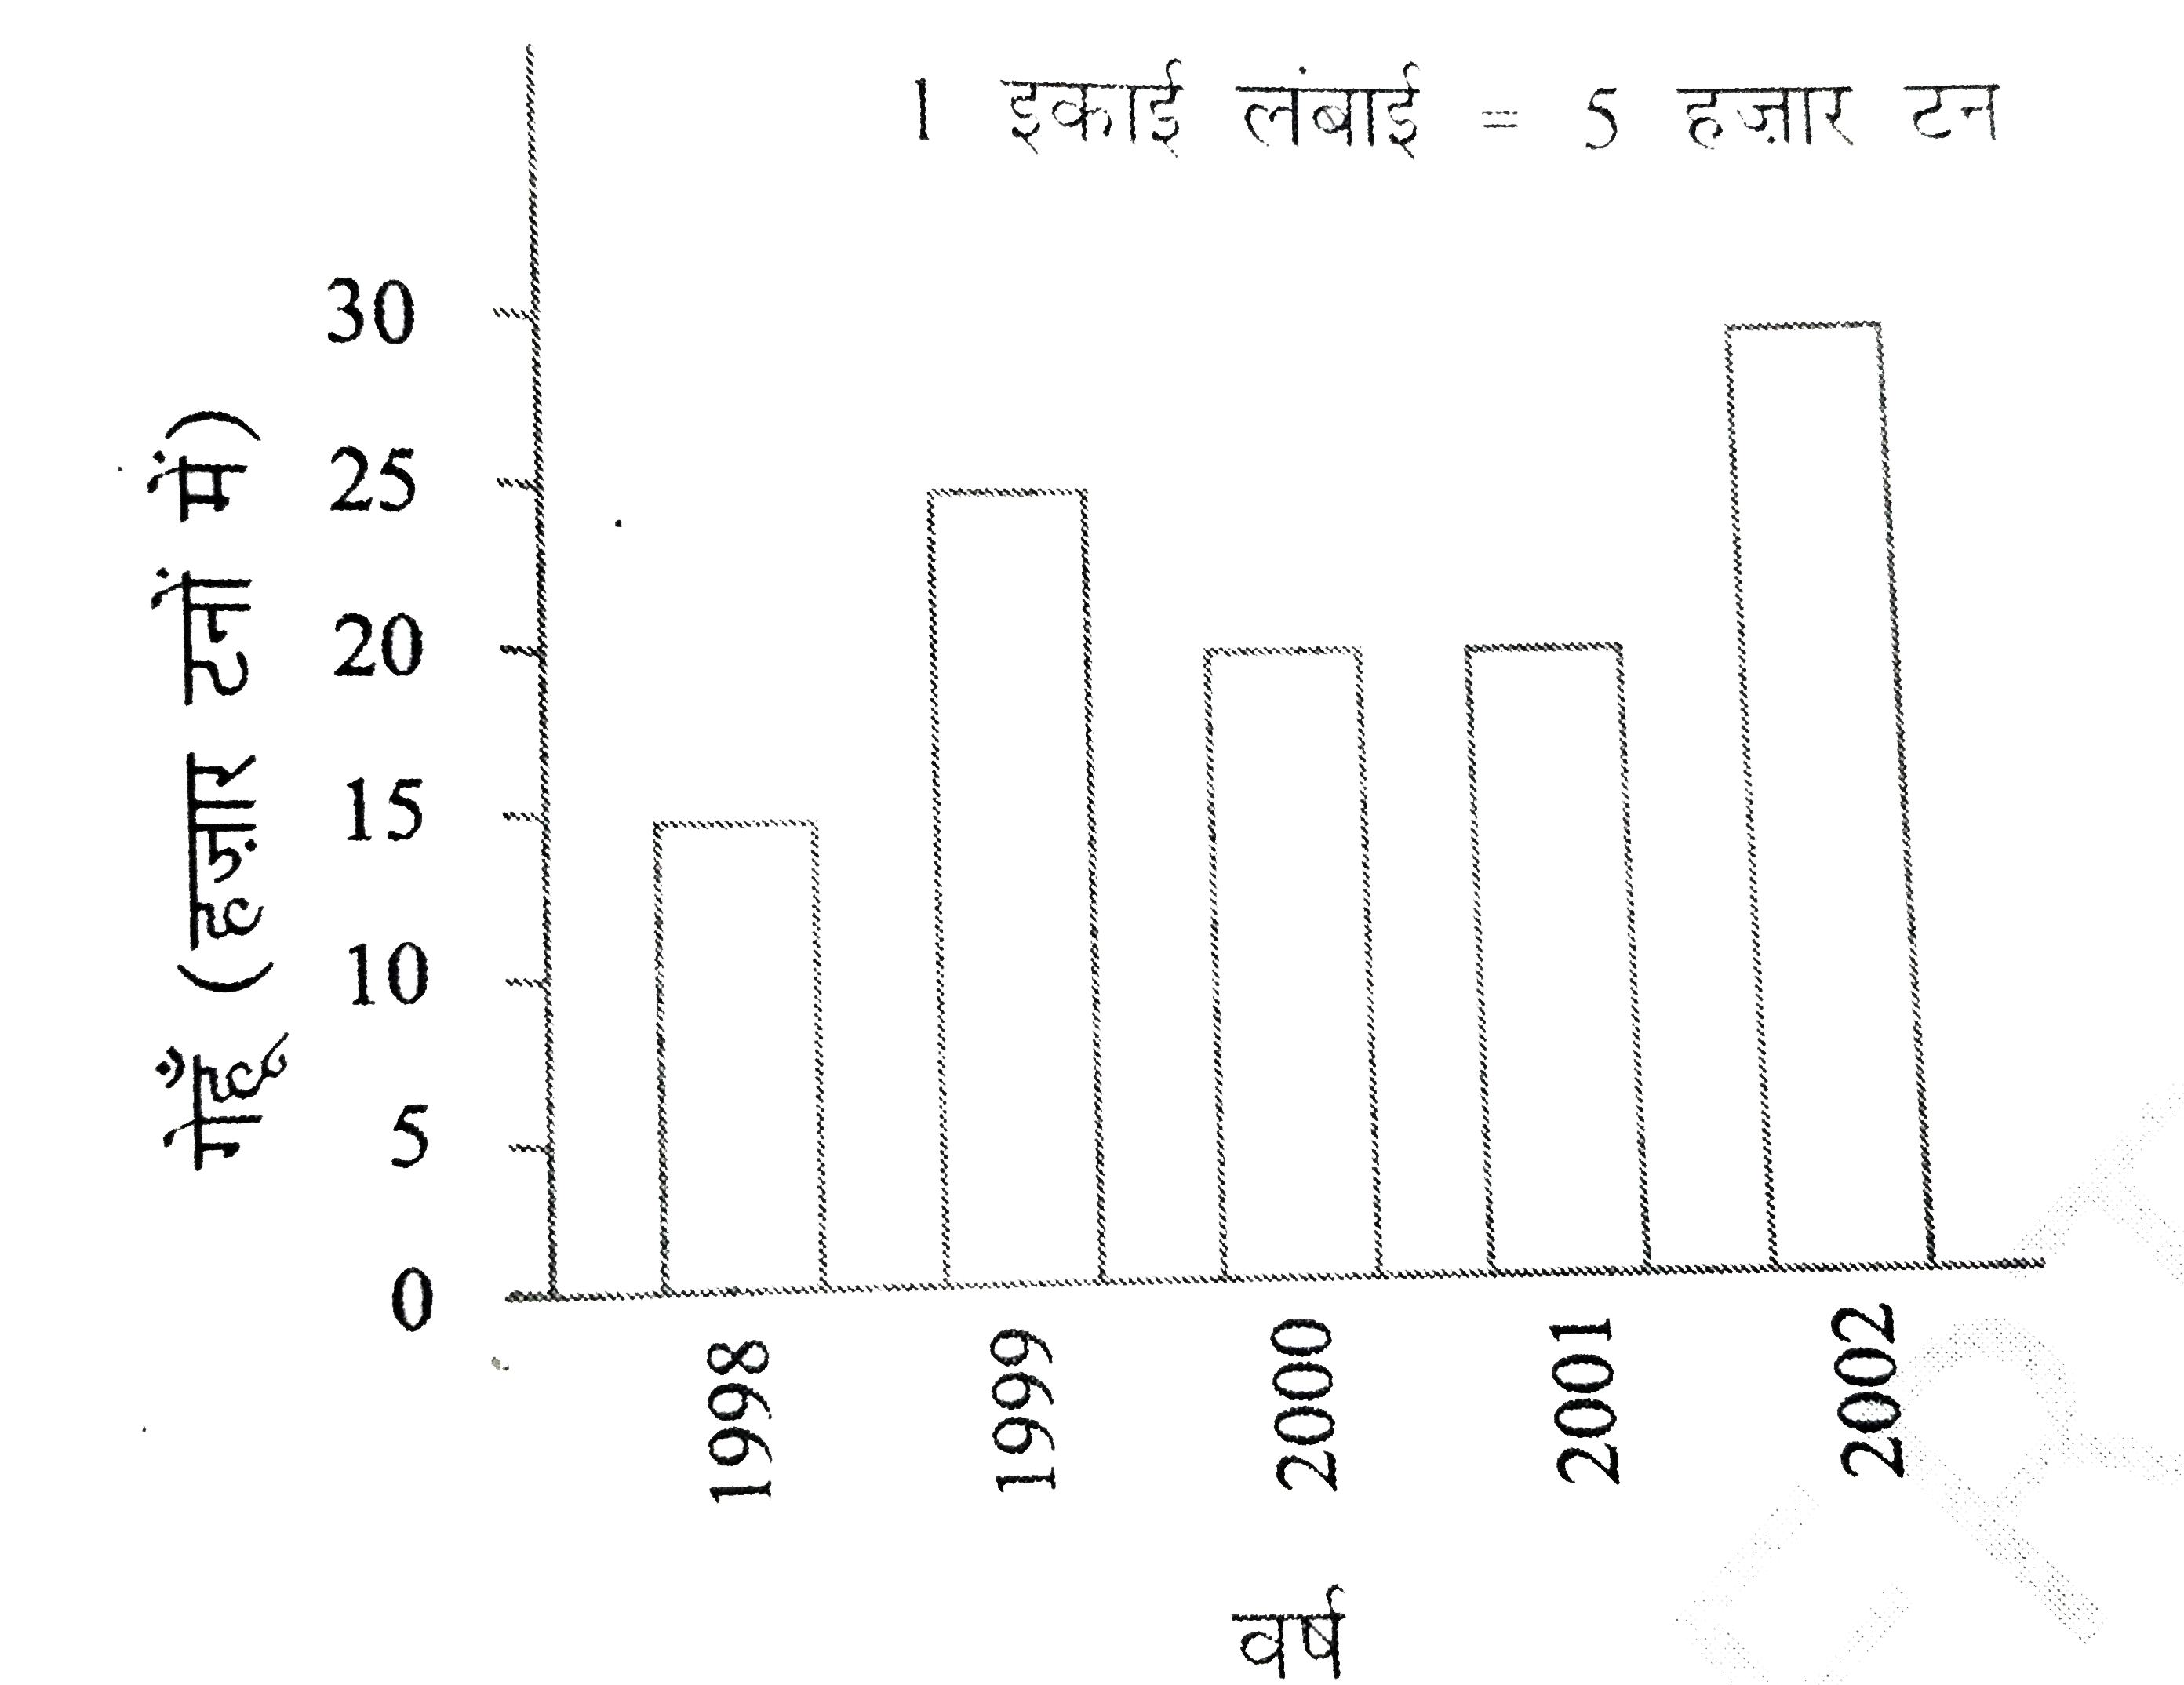
इस दंड आलेख को पढ़िए और अपने प्रेक्षणो को लिखिए ।
(a) किस वर्ष में गेहू का अधिकतम उत्पादन हुआ ?
(b) किस वर्ष में गेहू का न्यूनतम उत्पादन हुआ ?
View SolutionThe bar graph given alongside shows the amount of wheat purchasedby government during the year 1998-2002. Read the bar graph andwrite down your observations. In which year was(a) the wheat production maximum?(b) the wheat production minimum?
View SolutionThe baar graph given alongside shows the amount of wheat purchased by government during the year 1998-2002. read the bar graph andwrite down your observations. In which year was (a) the wheat production maximum?
View Solutionनीचे दिया हुआ दंडालेख वर्ष 1998 -2002 में सरकार द्वारा खरीदे गए गेहूँ की मात्रा दर्शाता है।
इस दंडालेख को पढ़िए अपने प्रेक्षणों को लिखिये।
(a) किस वर्ष में गेहूँ का अधिकतम उत्पादन हुआ ?
(b) किस वर्ष में गेहूँ का न्यूनतम उत्पादन हुआ ?
View Solution
