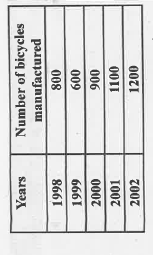
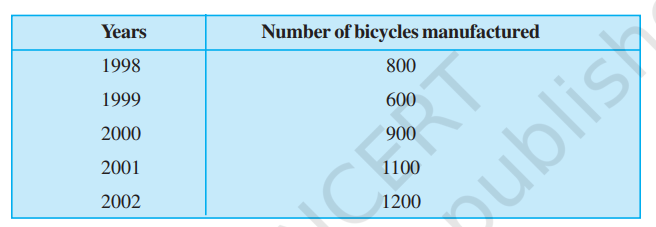
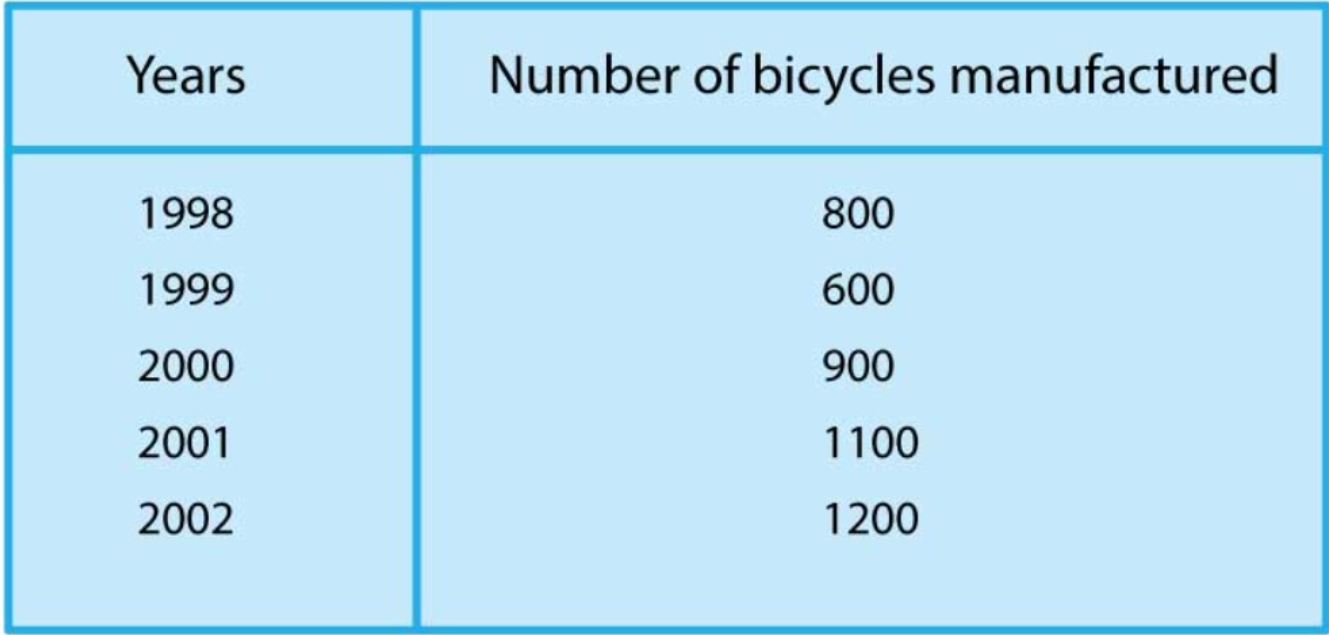
Follownig table shows the number of bicycles manufactured in a factory during the years 1998 to2002. Illustrate this data using a bar graph. Choose a scale of your choice.
 (a) In which
In In which year were the maximum number of bicycles manufactured? Solution in Kannada
Step by step video & image solution for Follownig table shows the number of bicycles manufactured in a factory during the years 1998 to2002. Illustrate this data using a bar graph. Choose a scale of your choice. (a) In which In In which year were the maximum number of bicycles manufactured? by Maths experts to help you in doubts & scoring excellent marks in Class 6 exams.
Updated on:21/07/2023Topper's Solved these Questions
Similar Questions
Find the rule which gives the number of matchsticks required to make the following matchstick patterns. Use a variable to write the rule. (a) A pattern f letter Z as
View SolutionWrite the fraction representing the place value blocks. (a)

View SolutionFollowing table shows the number of bicycles manufactured in a factory during the years 1998 to 2002. Illustrate this data using a bar graph. Choose a scale of your choice

View SolutionDetermine the point of symmetry of a regular hexagon.
View SolutionMatch the following Column A to Column B

View SolutionMatch the following Column A to Column B

View SolutionMatch the following Column A to Column B

View SolutionThe inequation represented by the graph given below is :
View SolutionThe inequation that best describes the graph given below is _________
View SolutionThe inequation that best describes the following graph is _________
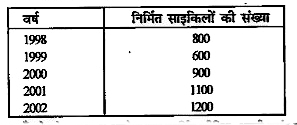
View Solutionवर्ष 1998 से 2002 के बीच एक फैक्टरी द्वारा निर्मित साइकिलो की संख्या निम्नलिखित सारणी द्वारा दर्शाई गई है :

इसे आंकड़ों को एक दंड आलेख द्वारा प्रदर्शित कीजिए । अपने पसंद का पैमाना चुनिए ।
(a) किस वर्ष में अधिकतम संख्या में साइकिले निर्मित की गई ?
(b) किस वर्ष में न्यूनतम संख्या में साइकिले निर्मित की गई ?
View SolutionFollowing table shows the number of bicycles manufactured in a factory during the years 1998 to 2002. Illustrate this data using a bar graph. Choose a scale of your choice
Year:1998,1999,2000,2001,2002
No. of Bicycle Manufactured : 800,600,900,1100,1200
View SolutionFollowing table shows the number of bicycles manufactured in a factory during the years 1998 to 2002. Illustrate this data using a bar graph. Choose a scale of your choice

View SolutionFollownig table shows the number of bicycles manufactured in a factory during the years 1998 to2002. Illustrate this data using a bar graph. Choose a scale of your choice. (b) In which In In which year were the miniimum number of bicycles manufactured?
View Solutionवर्ष 1998 से 2002 तक के बीच एक फैक्ट्री द्वारा निर्मित साइकिलों की संख्या निम्नलिखित सारणी द्वारा गई है।

इस आँकड़ें को एक दण्ड आलेख द्वारा प्रदर्शित कीजिए , अपनी पसंद का पैमाना चुनिए।
(a) किस वर्ष में अधिकतम साइकिलें निर्मित की गई ?
(b) किस वर्ष में न्यूनतम संख्या में साइकिलें निर्मित की गई ?
View Solution
