Two particles are moving along x-axis. Their x-coordinate versus time graph are as shown below.

Find velocity of A w.r.t. B
The correct Answer is:B
vA=SlopeofA=25=0.4m/s
vB=SlopeofB=125=2.4m/s
∴VAB=vA−vB=−2m/s
Topper's Solved these Questions
- KINEMATICSBOOK - DC PANDEY ENGLISHCHAPTER - KINEMATICSEXERCISE - Assertion And Reason
12 Videos
- KINEMATICSBOOK - DC PANDEY ENGLISHCHAPTER - KINEMATICSEXERCISE - Objective
45 Videos
- KINEMATICSBOOK - DC PANDEY ENGLISHCHAPTER - KINEMATICSEXERCISE - Exercise 6.8
5 Videos
- GRAVITATIONBOOK - DC PANDEY ENGLISHCHAPTER - GRAVITATIONEXERCISE - (C) Chapter Exercises
45 Videos
- KINEMATICS 1BOOK - DC PANDEY ENGLISHCHAPTER - KINEMATICS 1EXERCISE - INTEGER_TYPE
15 Videos
Similar Questions
Two particles A and B are moving along x-axis. Their x-coordinate versus time graphs are as shown below
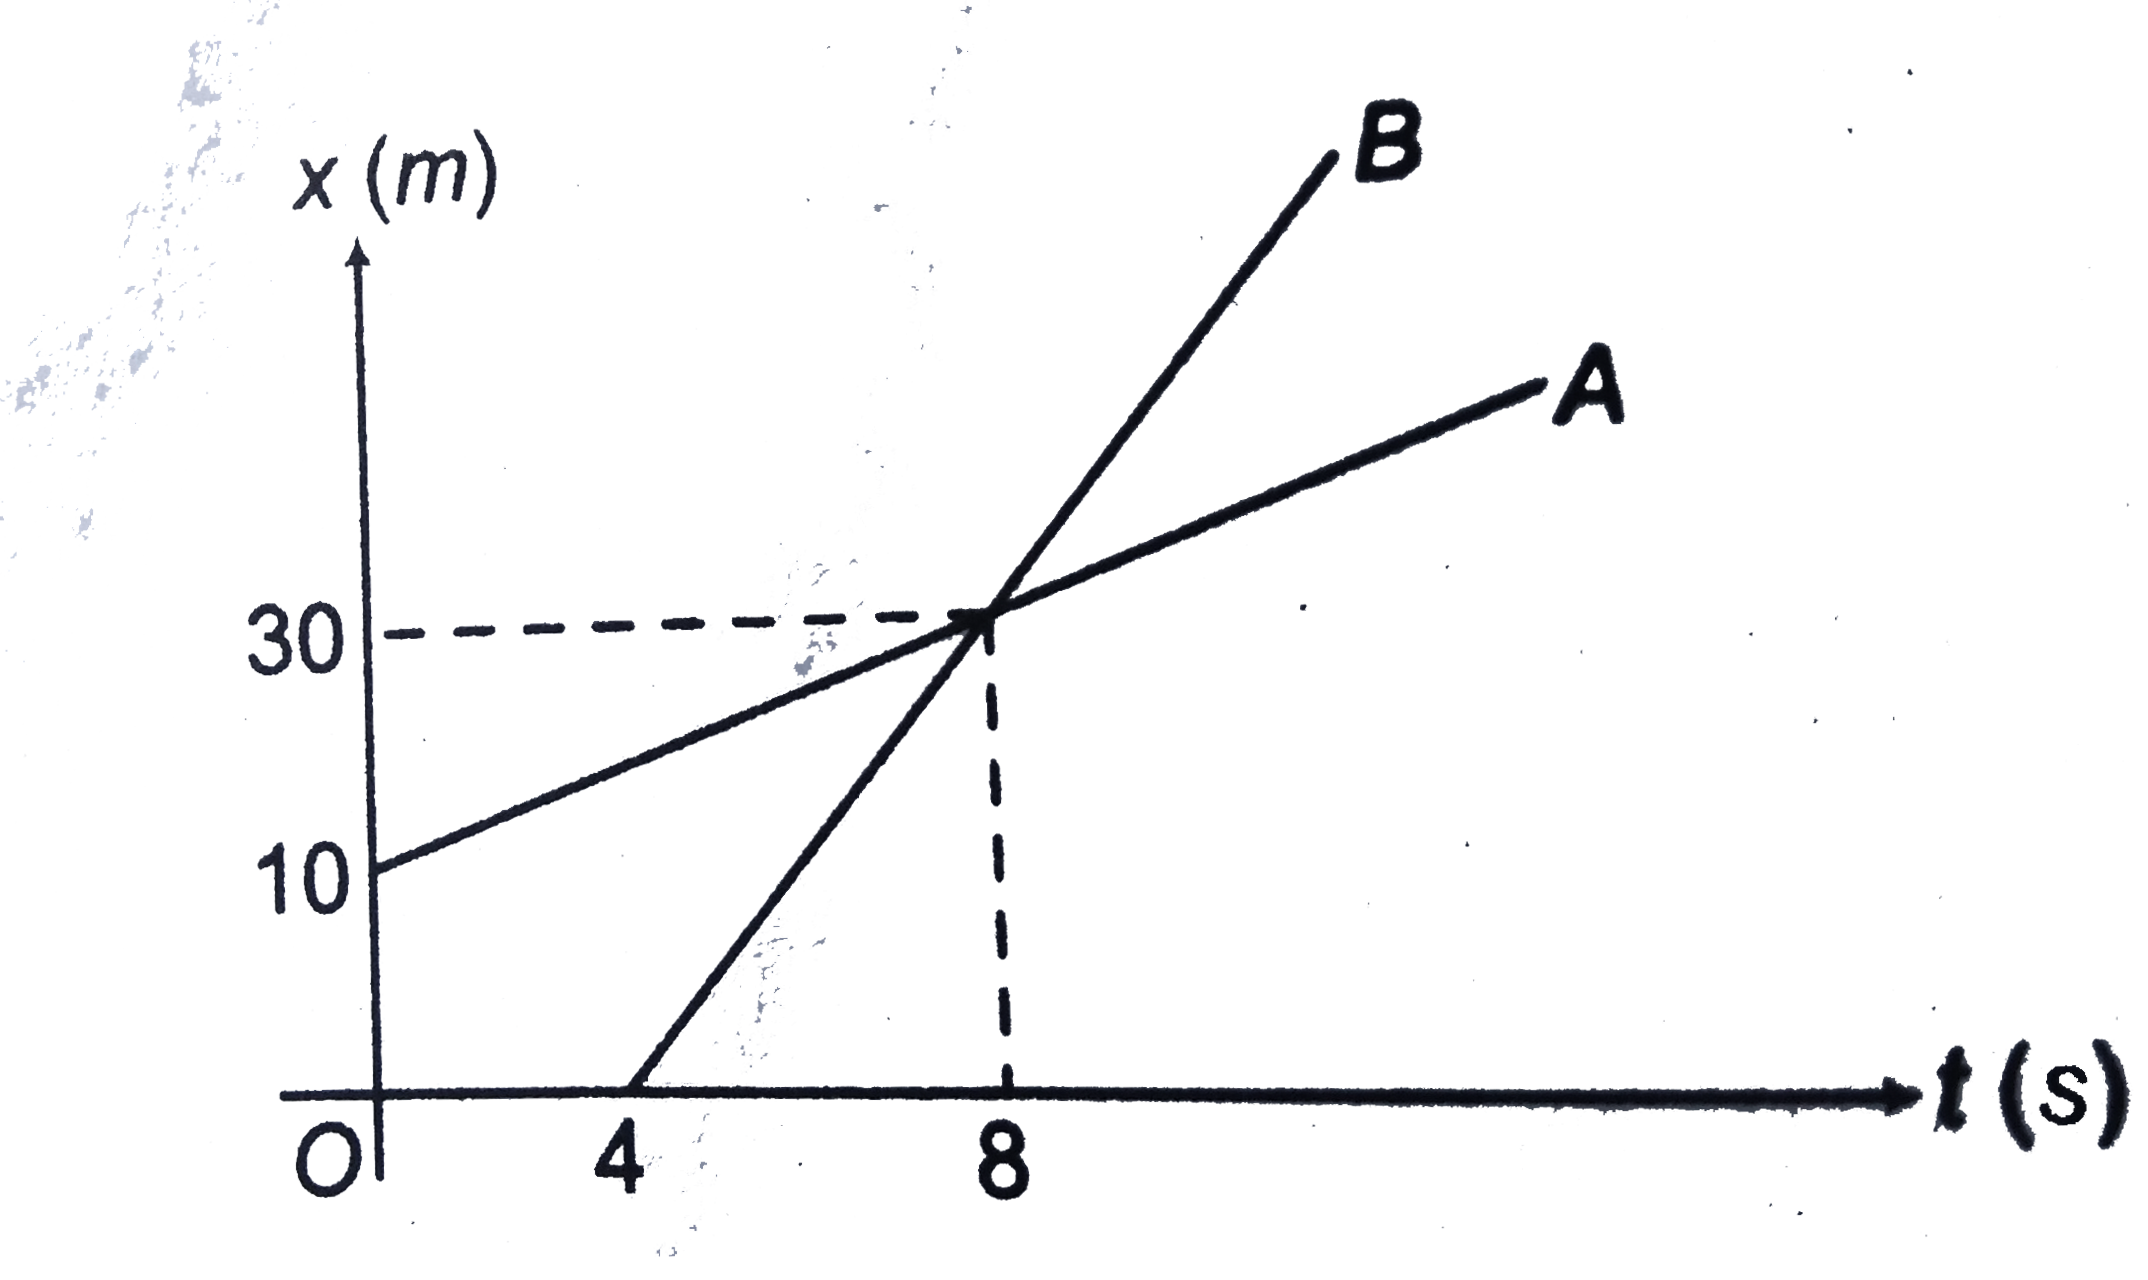
(a) Find the time when the particles start their journey and the x-coordinate at that time.
(b) Find velocities of the two particles.
(c) When and where the particles strike with each other.
View SolutionA particle is moving along x-axis. Its x-coordinate versus time graph is as shown below.
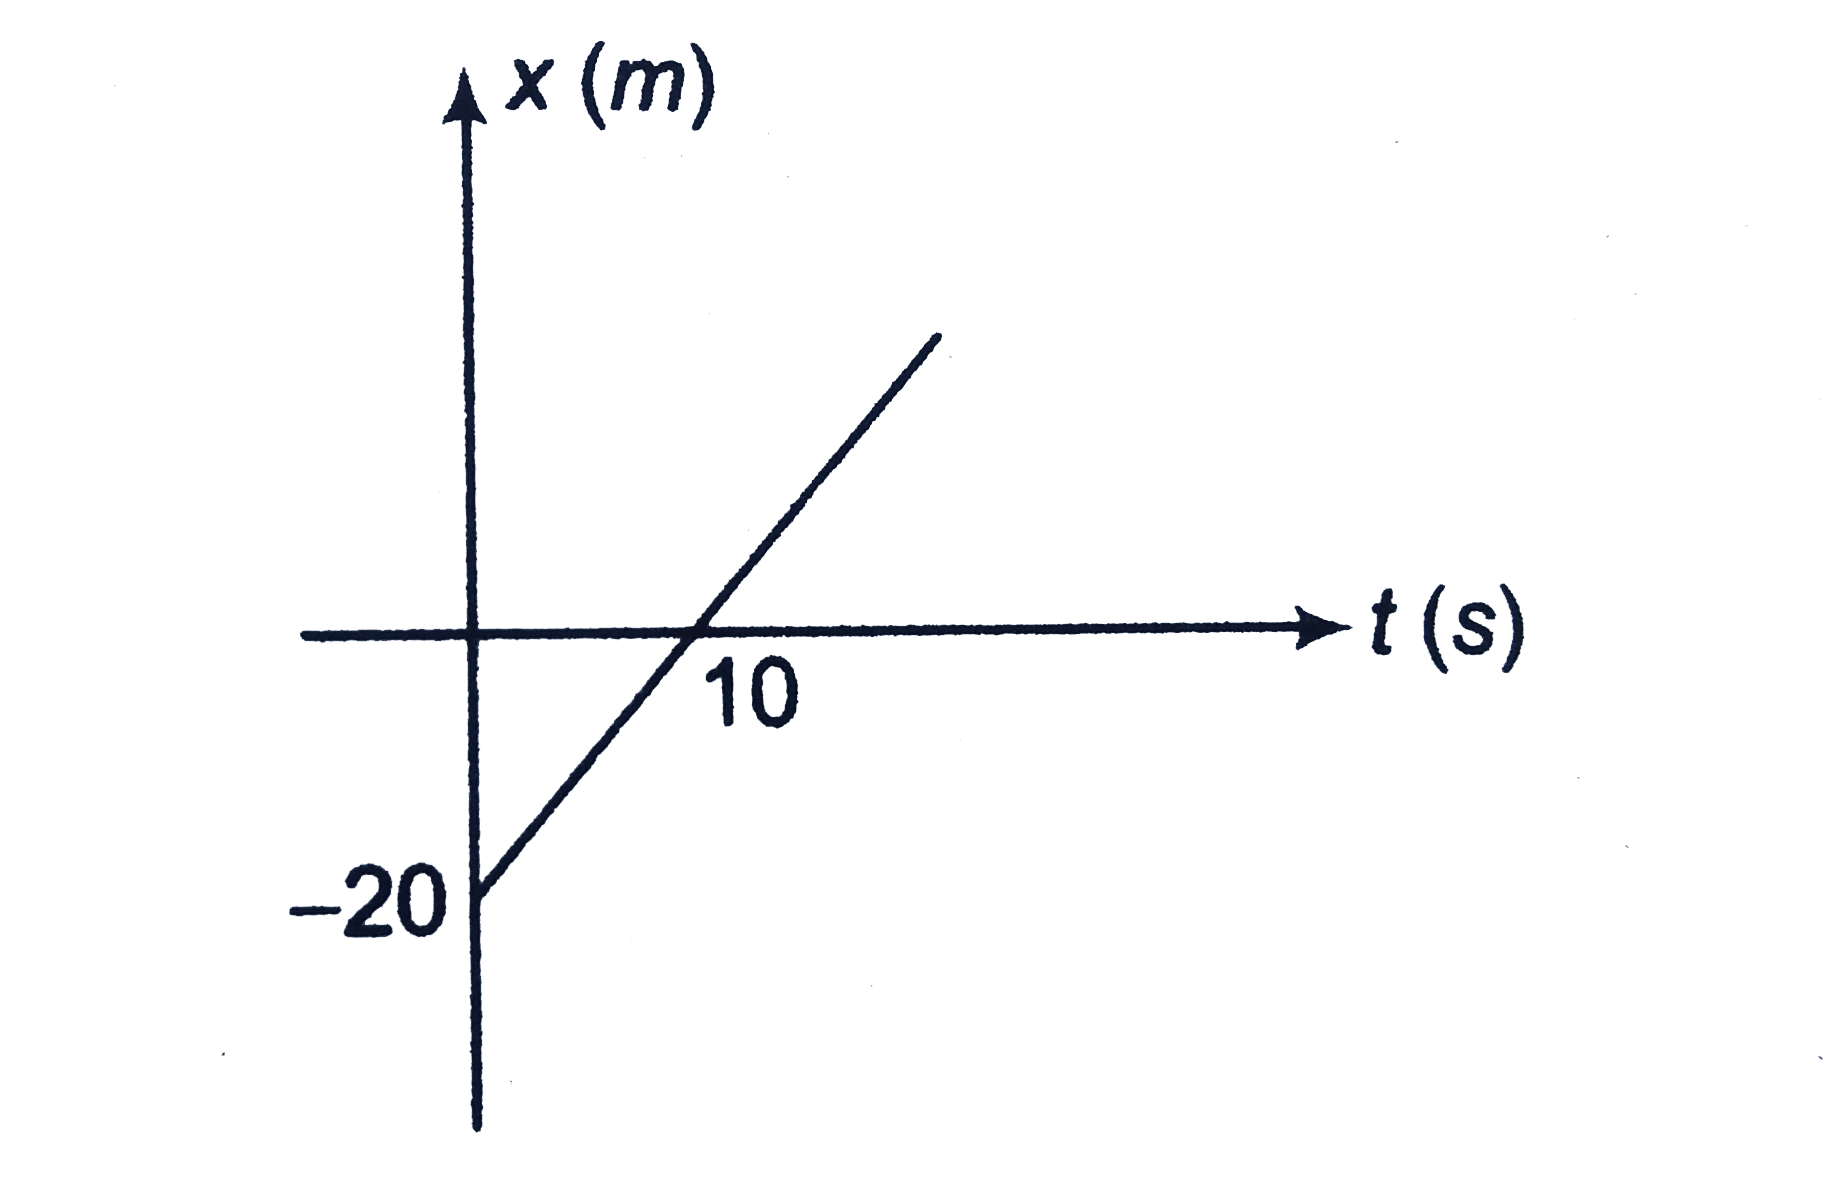 Draw some conclusion from the given graph.
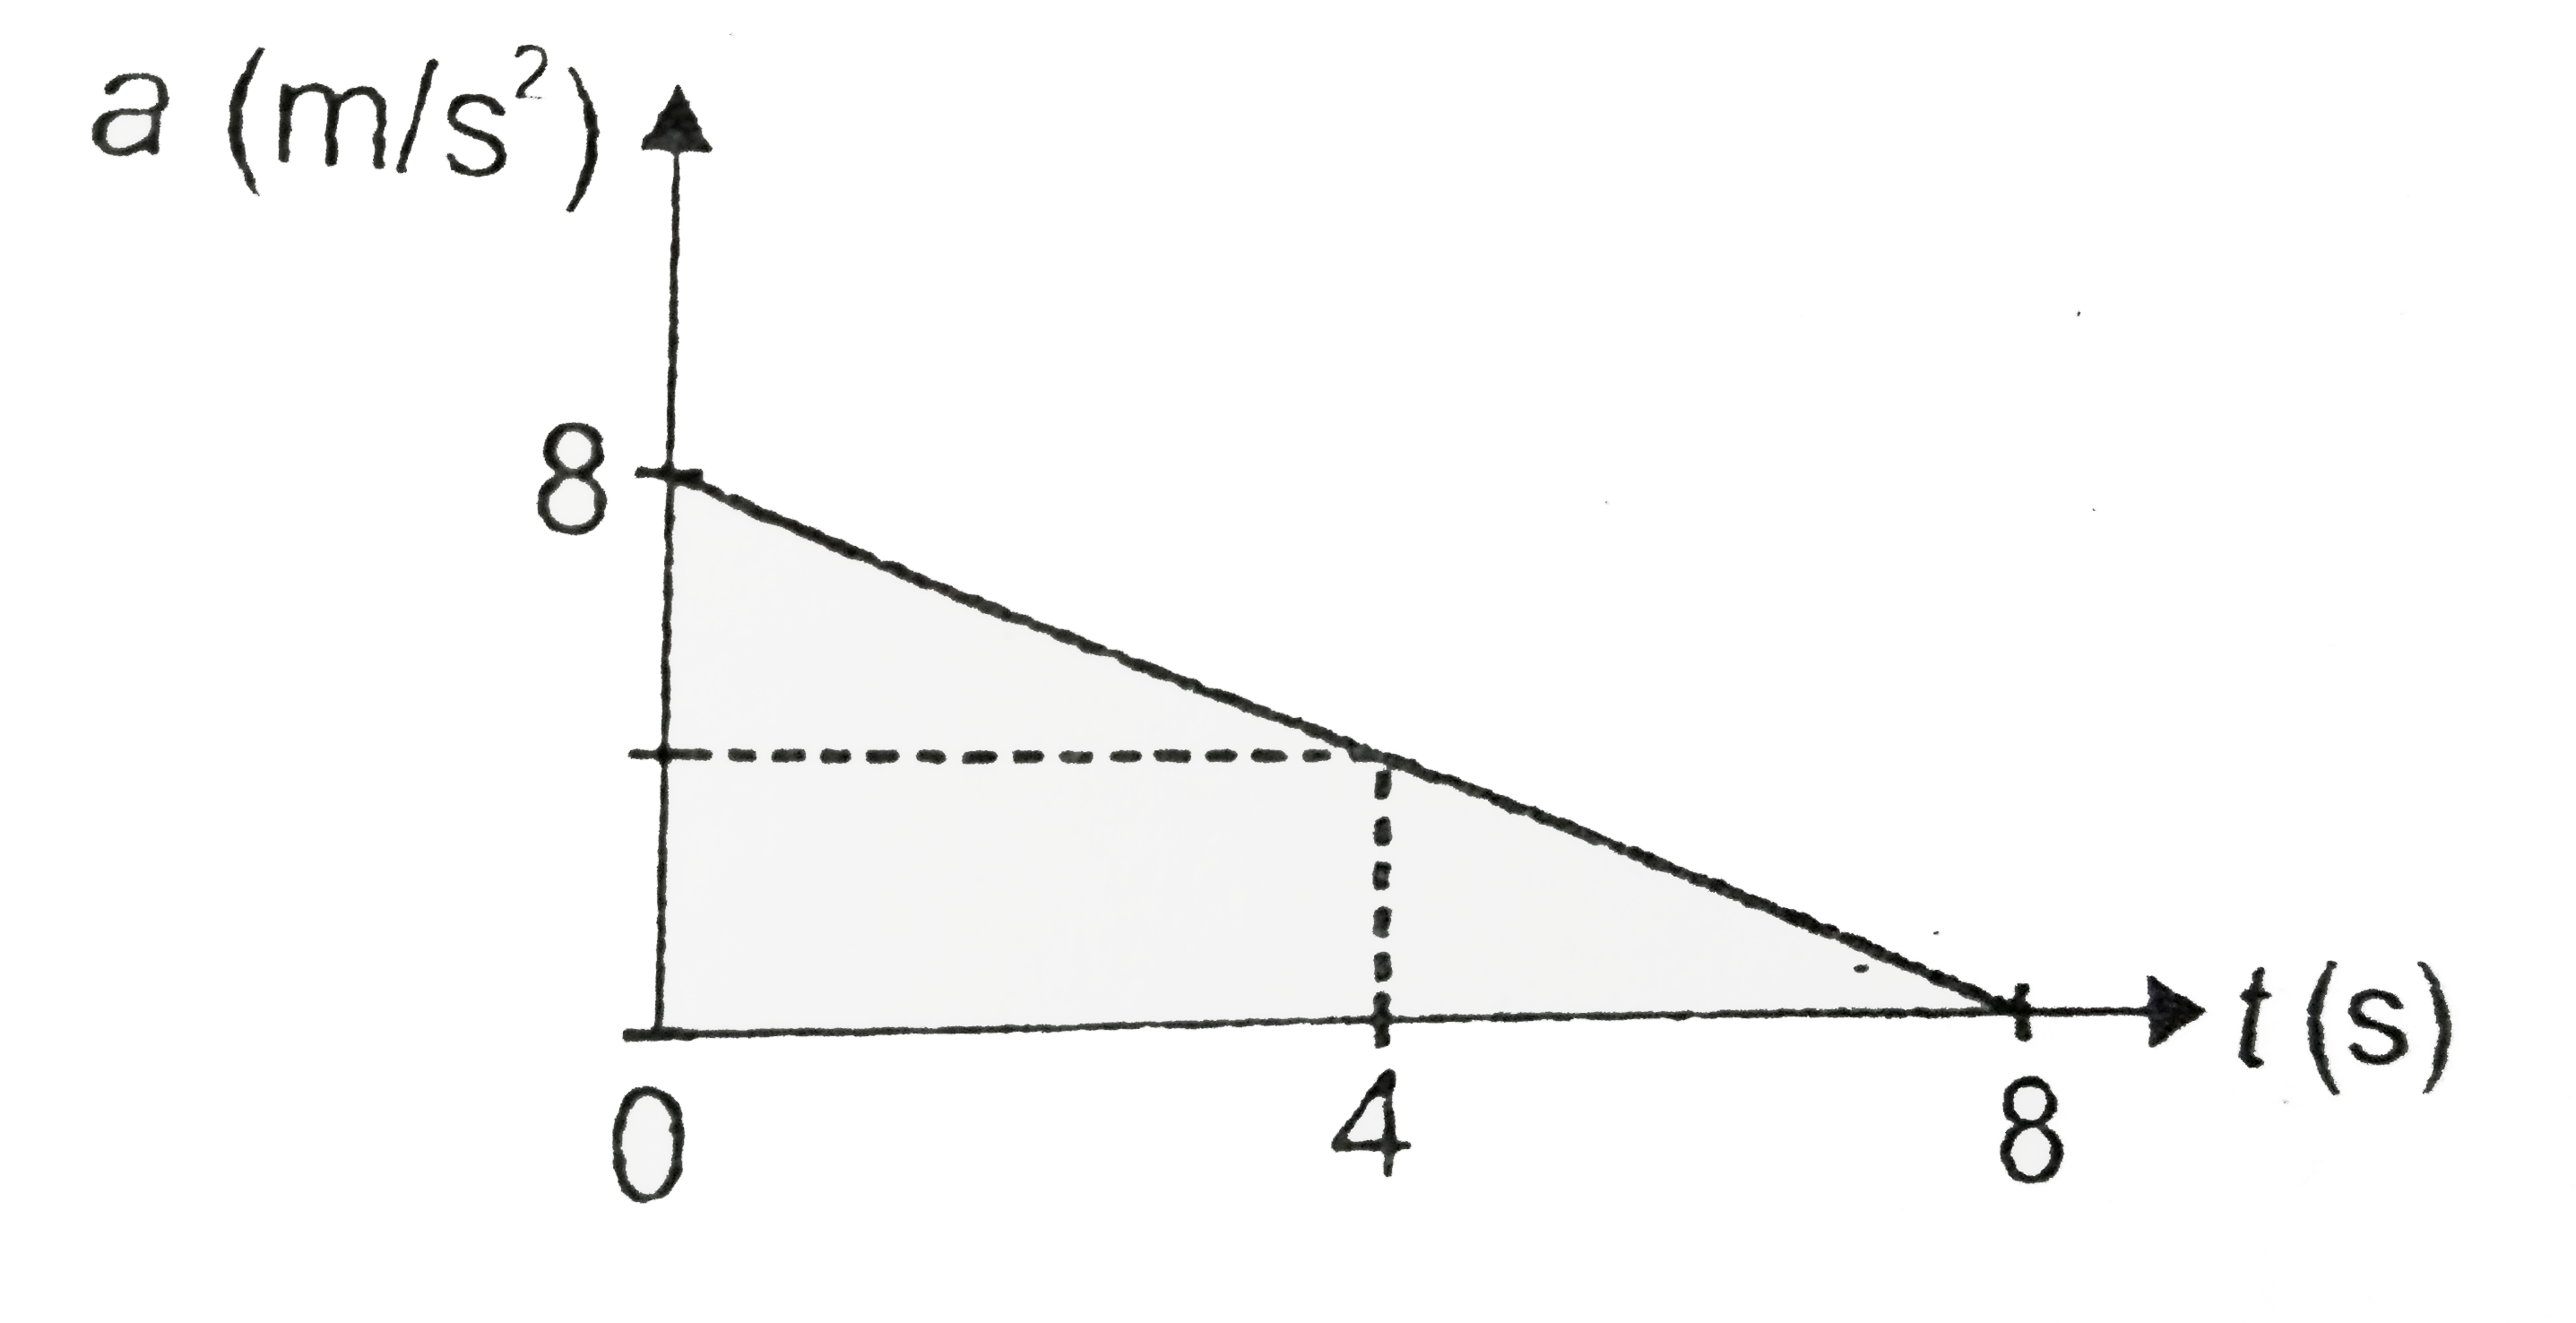
View SolutionThe acceleration-time graph of a particle moving along x-axis is shown in the figure. If the particle starts with velocity 3 m/s at t = 0, find the velocity of particle at t = 4 s.
View SolutionA particle is moving along x-axis. Its X-coordinate varies with time as, X=2t2+4t−6 Here, X is in metres and t in seconds. Find average velocity between the time interval t=0→t=2s.
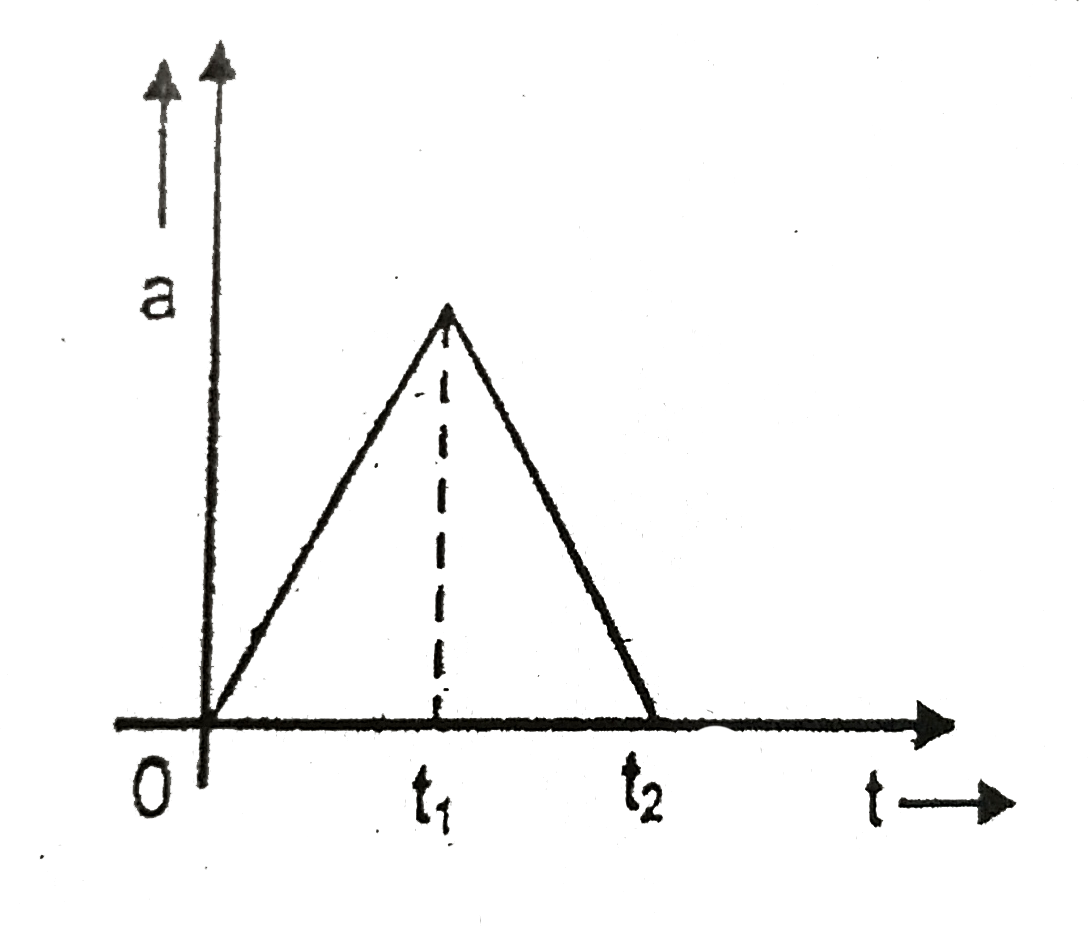
View SolutionA particle starts to move along a straight line. The acceleration versus time graph of particle is as shown in figure. The correct velocity versus time graph is :
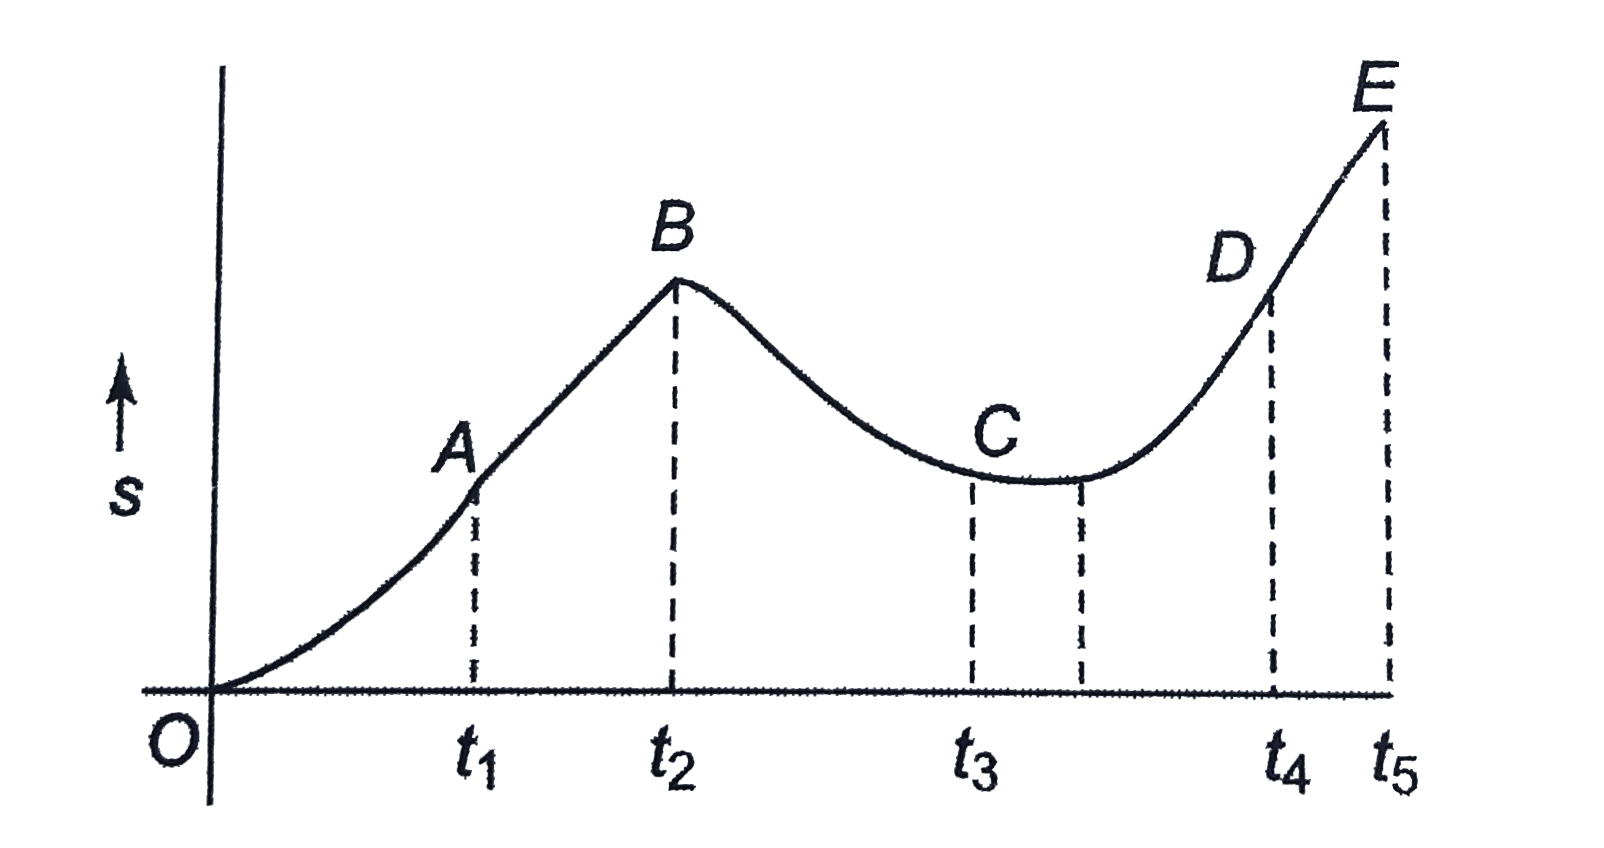
View SolutionA particle is moving along the x-axis and its position-time graph is shown. Determine the sign of acceleration.
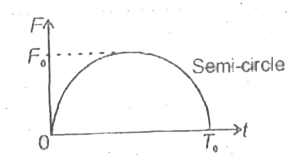
View SolutionThe magnitude of force acting on a particle moving along x-axis varies with time (t) as shown in figure. If at t = 0 the velocity of particle is v0, then its velocity at t=T0 will be
View SolutionTwo particles A and B start from the origin along x-axis. Velocity time graph of both particles are shown in the figure. During the given time interval, the maximum separation between the particles is

View SolutionA particle starts from origin and moving along x−axis. Whose v−t graph is as shown . Choose the INCORRECT statement :
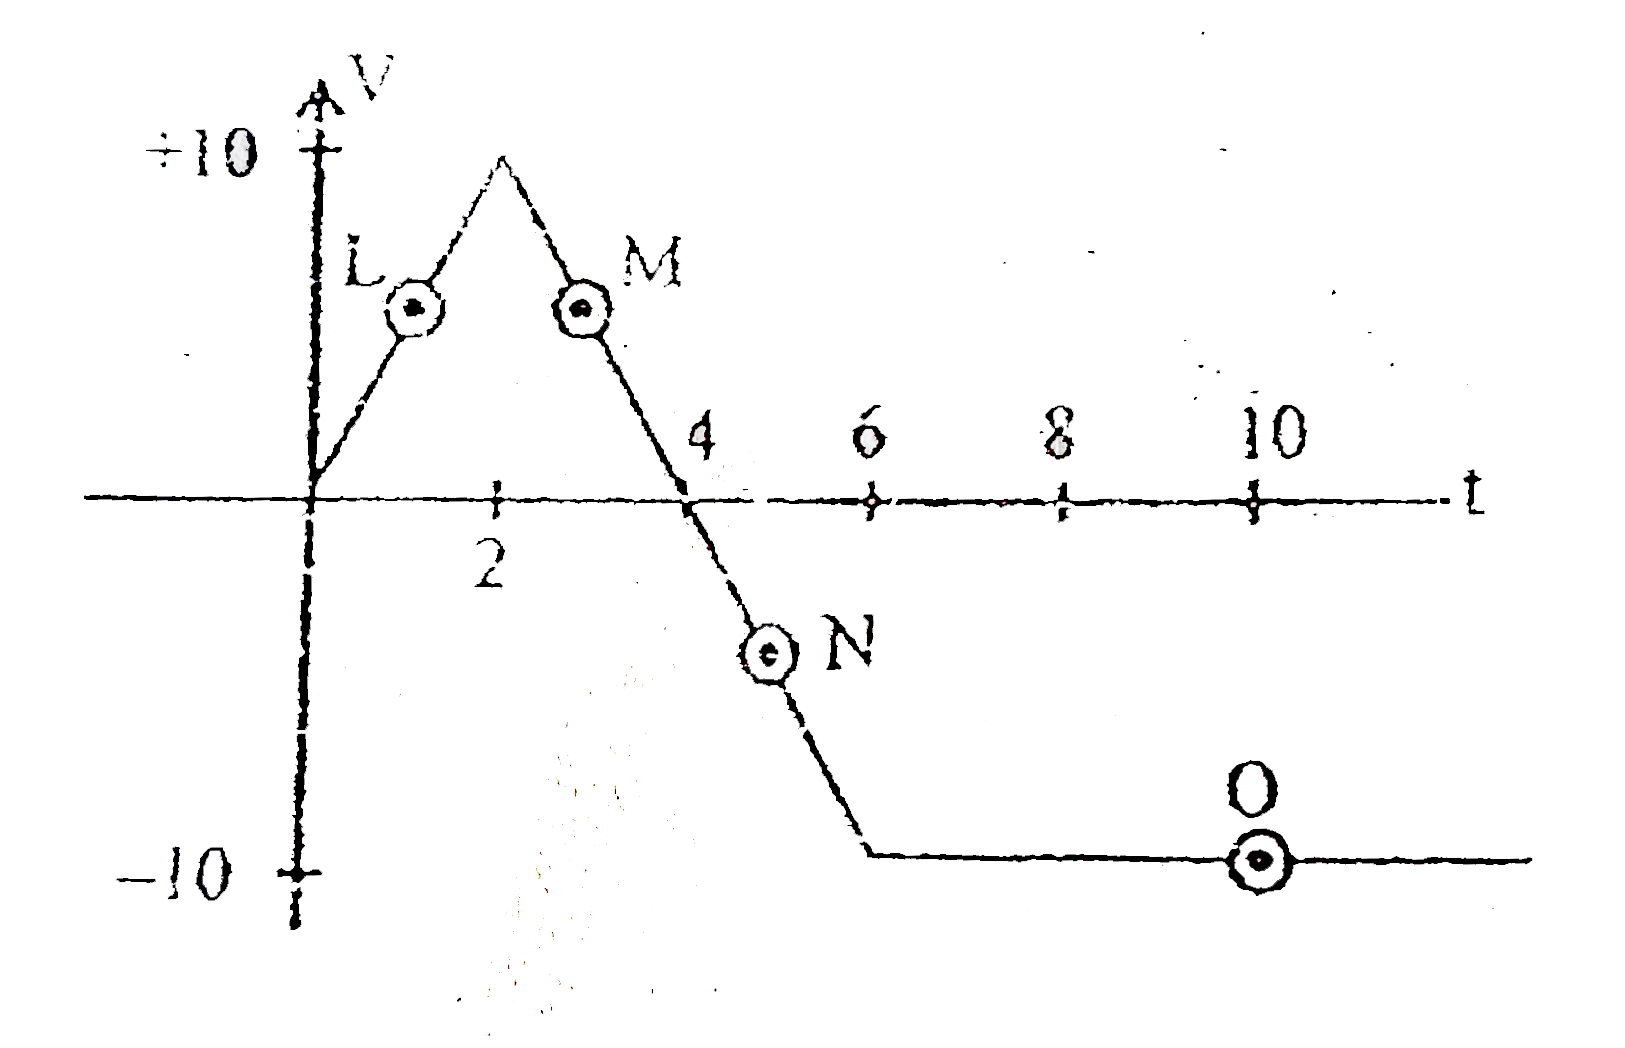 .
.
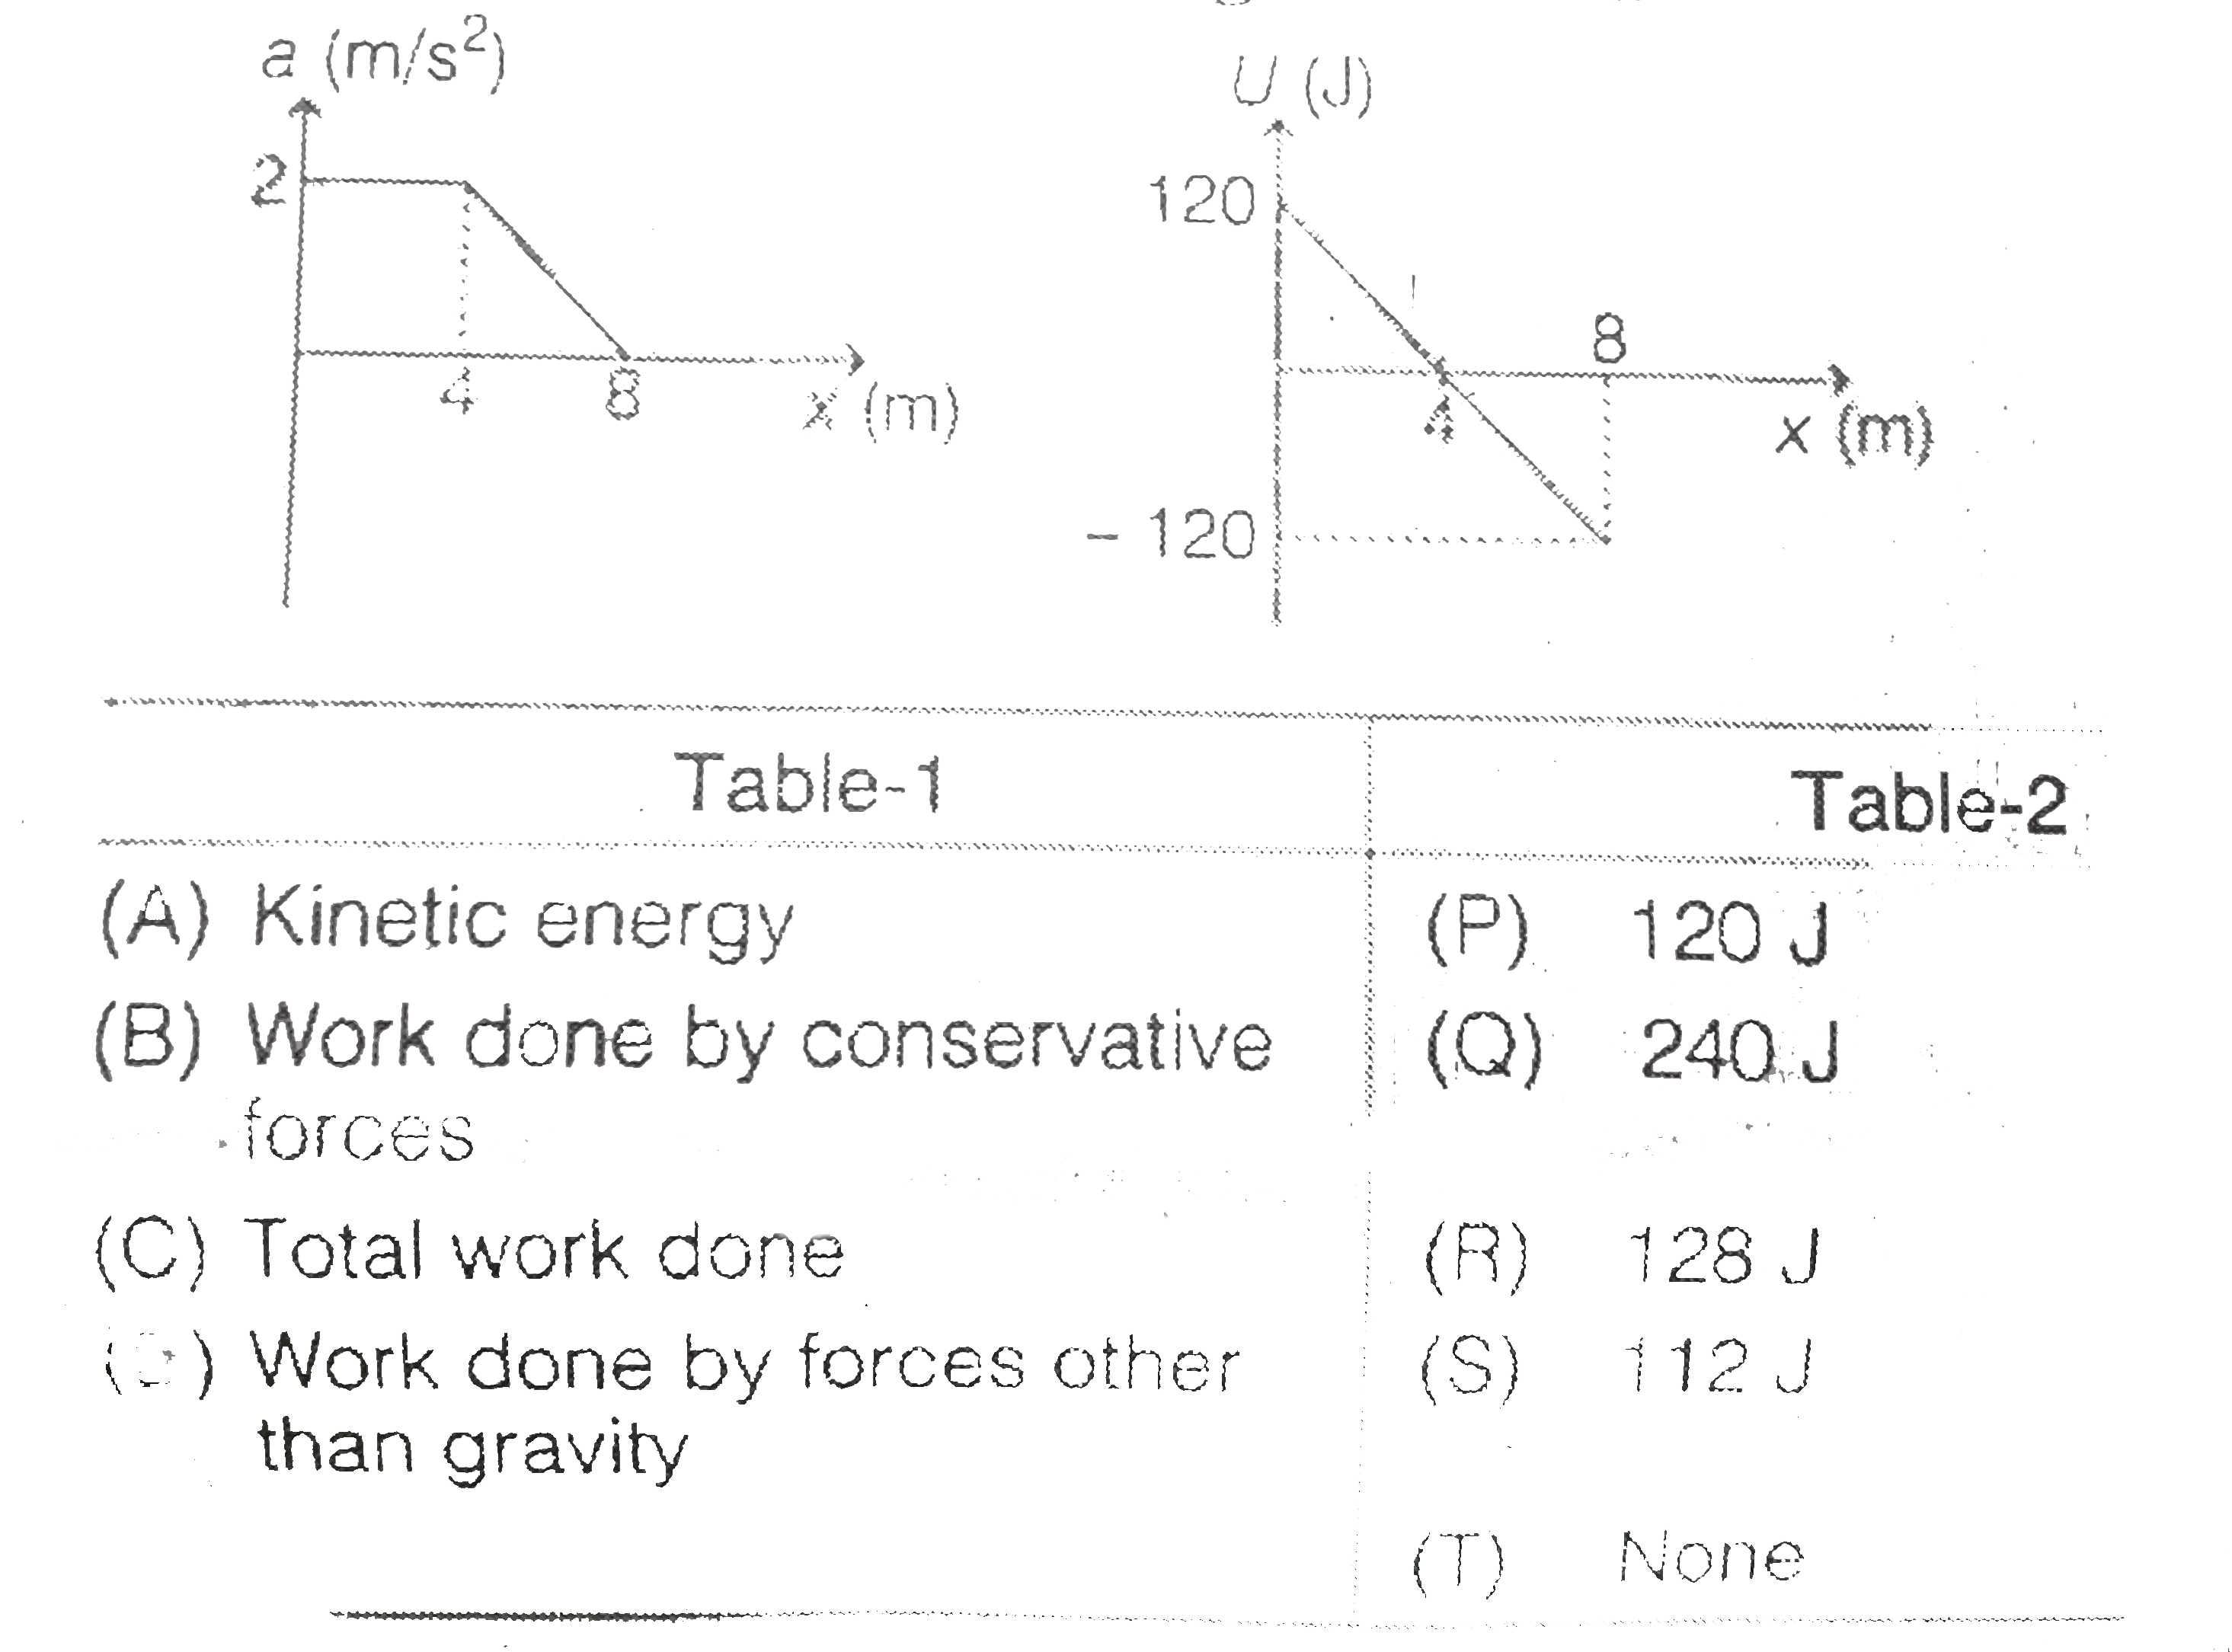
View SolutionAcceleration versus x and potential energy versus x graph of a particle moving along x-axis is as shown in figure. Mass of the particle is 1 kg and velocity at x = 0 is 4m/s. Match the following at x = 8 m.
View Solution
