A baseball having a mass of 0.4kg is thrown such that the force acting on it varies with time as shown in the first graph. The correspondeng velocity time gragh is shown in the second graph. Detemine the power applied as a functon time and the work done till t=0.3s.

The correct Answer is:A, B, C
For t≤0.2s
F=800N and v=(200.3)t
∴P=Fv=(53.3t)kW
For t>0.2s
F=800−(8000.1)(t−0.2) and v=200.3t
∴P=Fv=(160t−533t2)kW
W=∫0.20(53.3t)dt+∫0.30.2(160t−533t2)dt
=1.69kJ.
Topper's Solved these Questions
- WORK, ENERGY & POWERBook:DC PANDEY ENGLISHChapter:WORK, ENERGY & POWERExercise:Level 2 Comprehension Based
Explore 2 Videos
- WORK, ENERGY & POWERBook:DC PANDEY ENGLISHChapter:WORK, ENERGY & POWERExercise:Level 2 More Than One Correct
Explore 9 Videos
- WAVE MOTIONBook:DC PANDEY ENGLISHChapter:WAVE MOTIONExercise:Integer Type Question
Explore 11 Videos
- WORK, ENERGY AND POWERBook:DC PANDEY ENGLISHChapter:WORK, ENERGY AND POWERExercise:MEDICAL ENTRACES GALLERY
Explore 33 Videos
Similar Questions
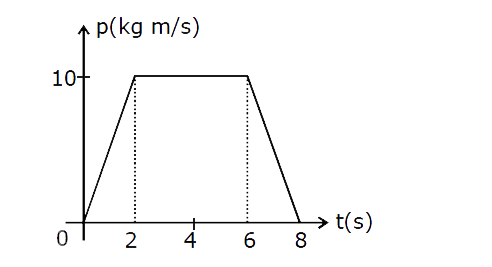
The momentum p of an object varies with time (t) as shown in figure. The corresponding force (F)- time (t) graph is -
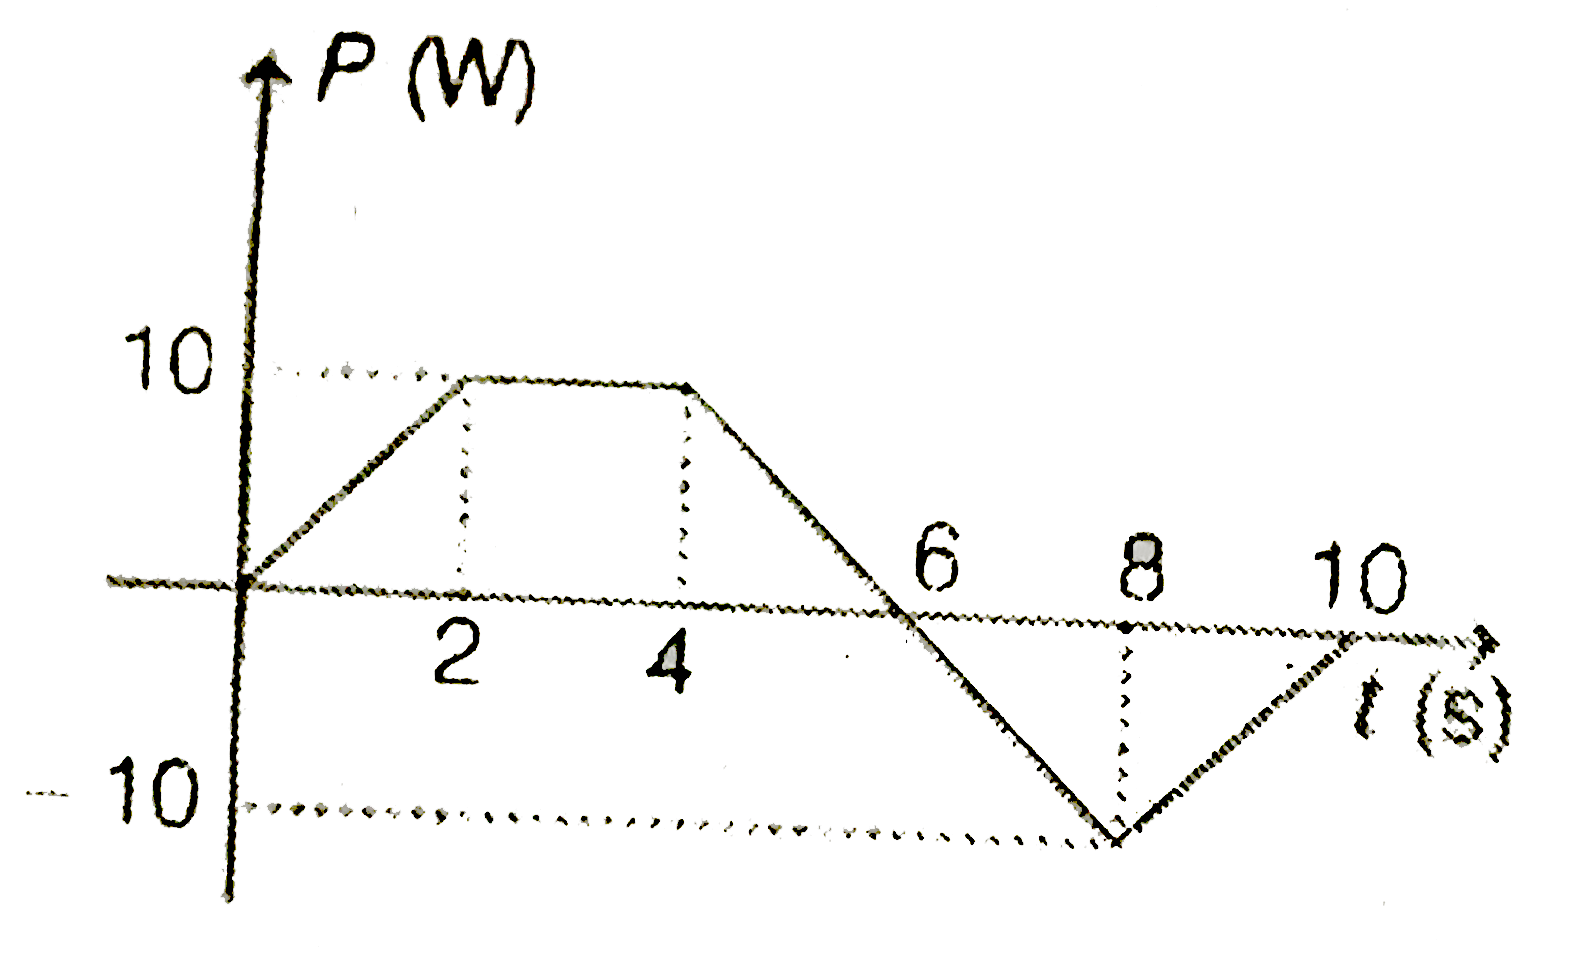
View SolutionPower of a force acting on a block varies with time t as shown in figure. Then, angle between force acting on the block and its velocity is
View SolutionThe displacement time graph of a particle executing S.H.M as shown in the figure.
 The corresponding force-time graph of the partical will be
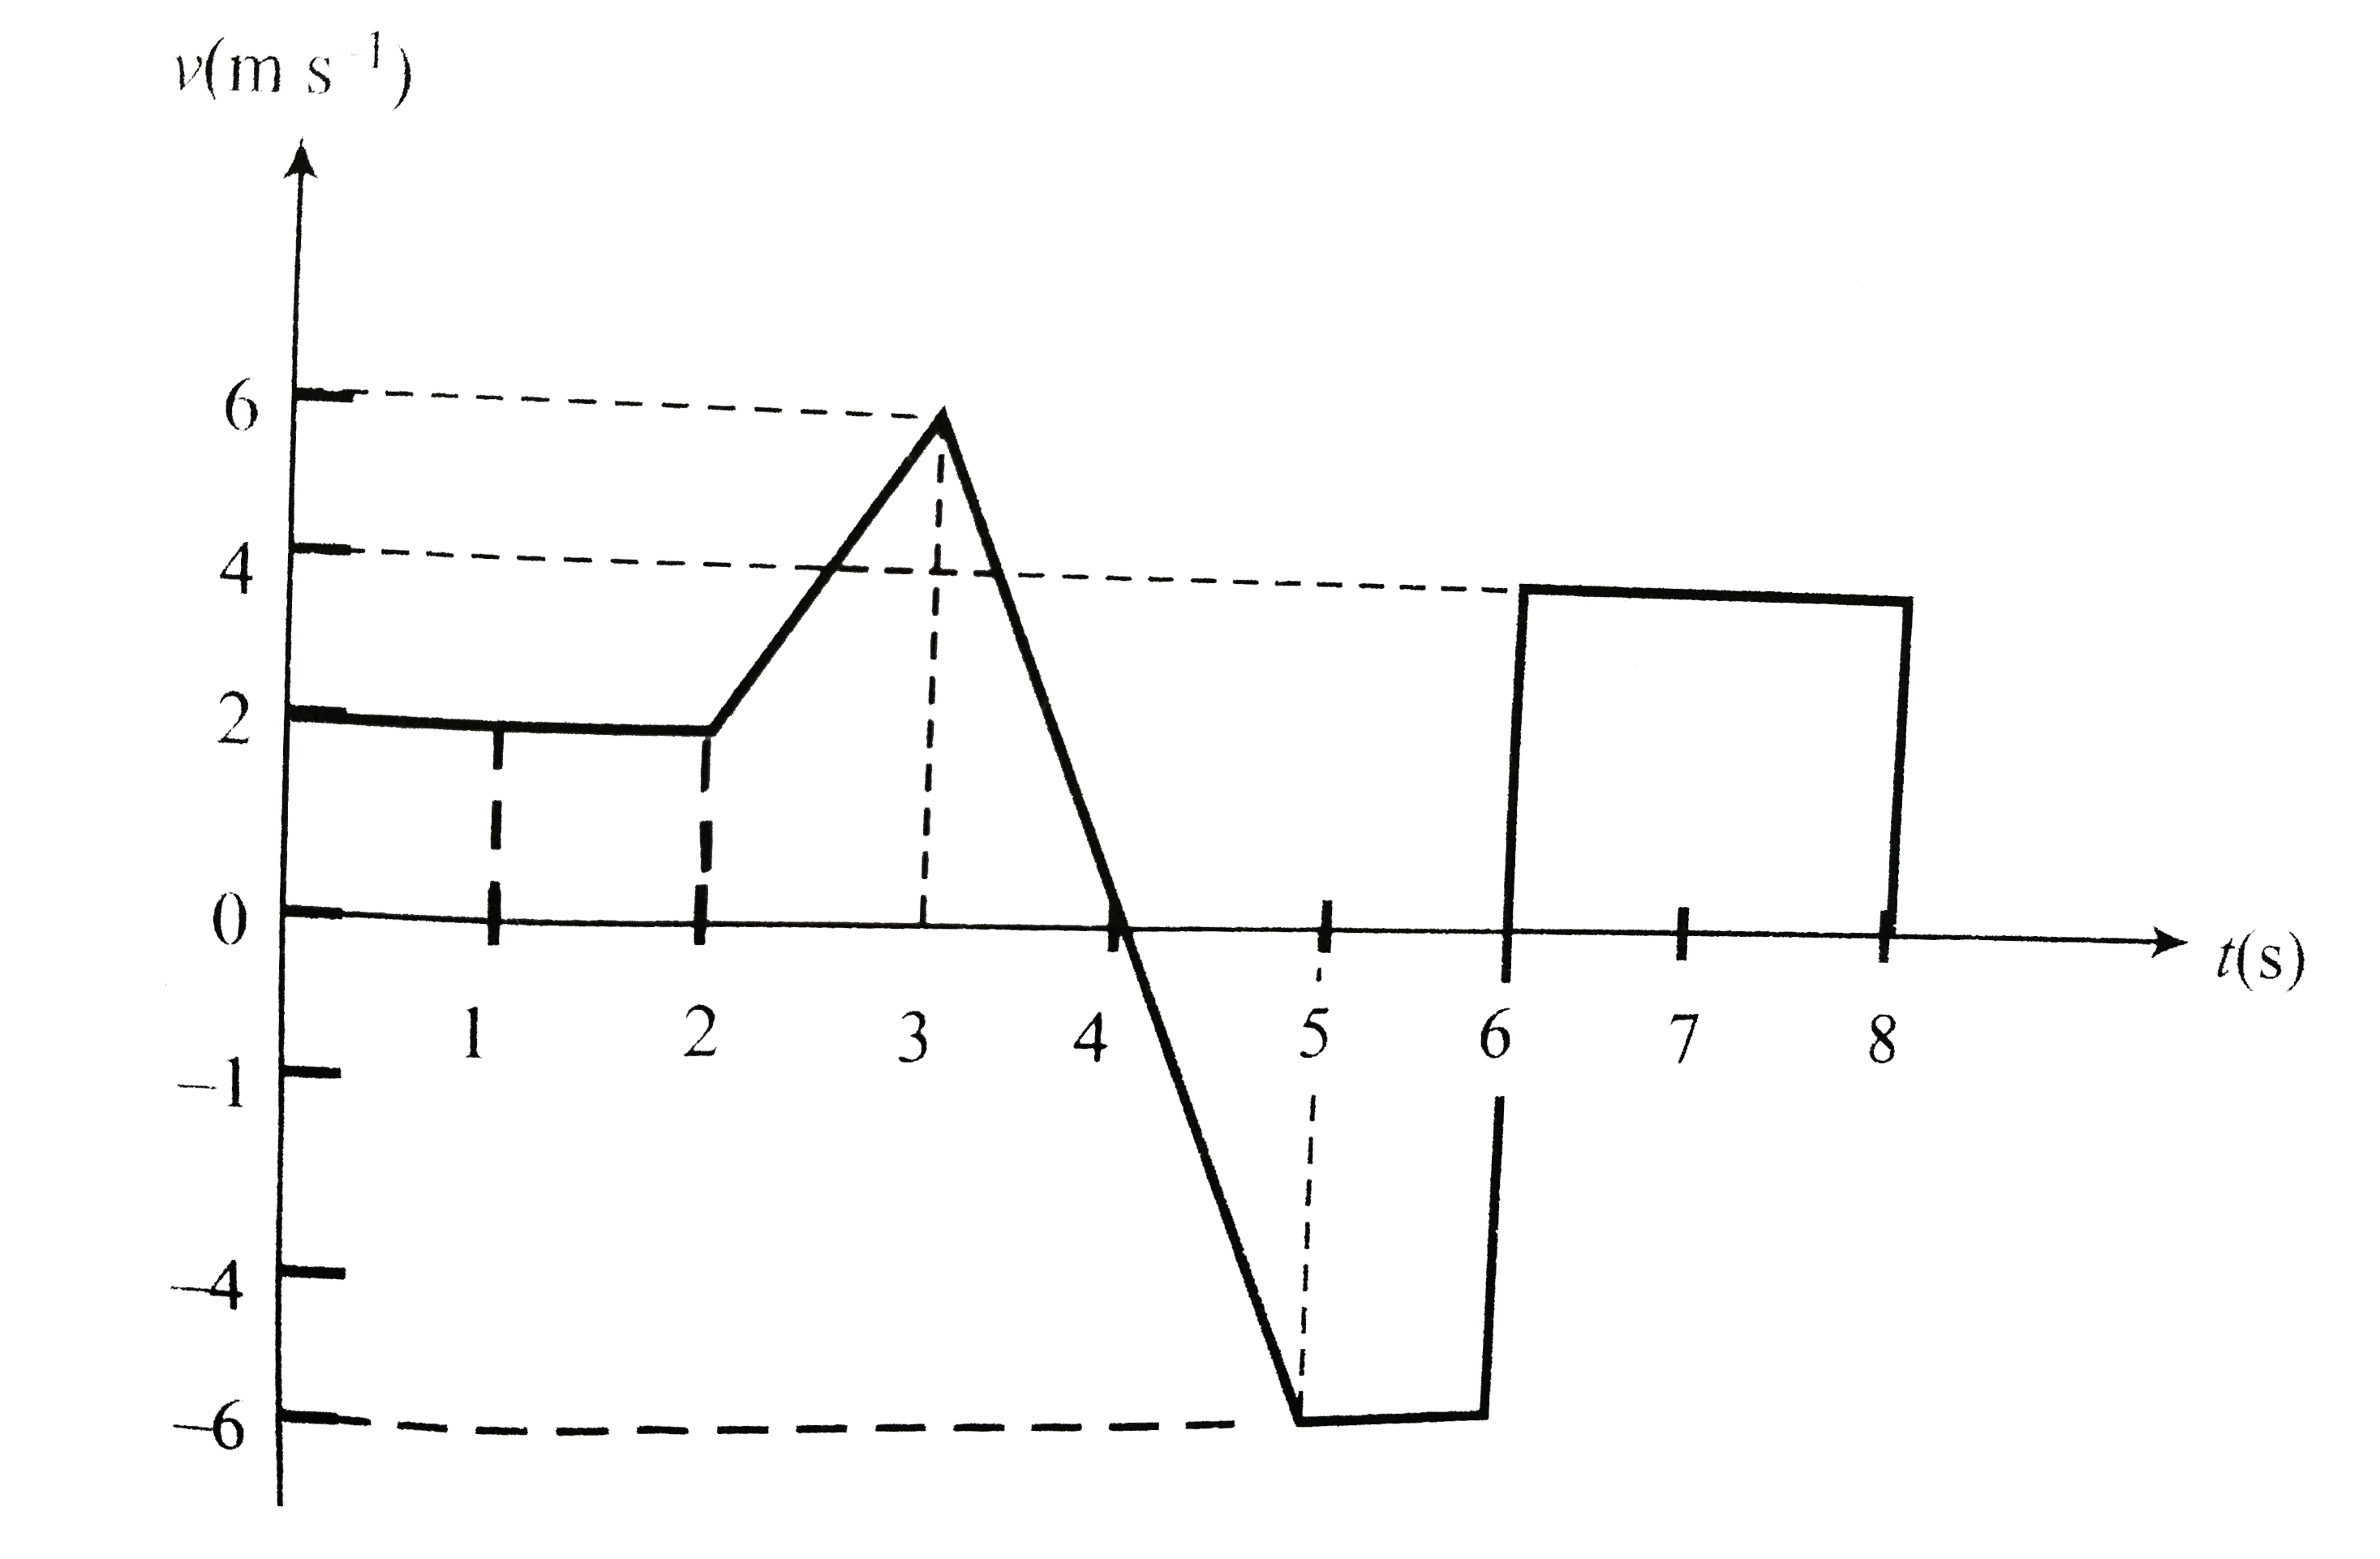
View SolutionThe velocity-time graph of a body is shown in .
The displacement of the body in 8s is.
 .
.
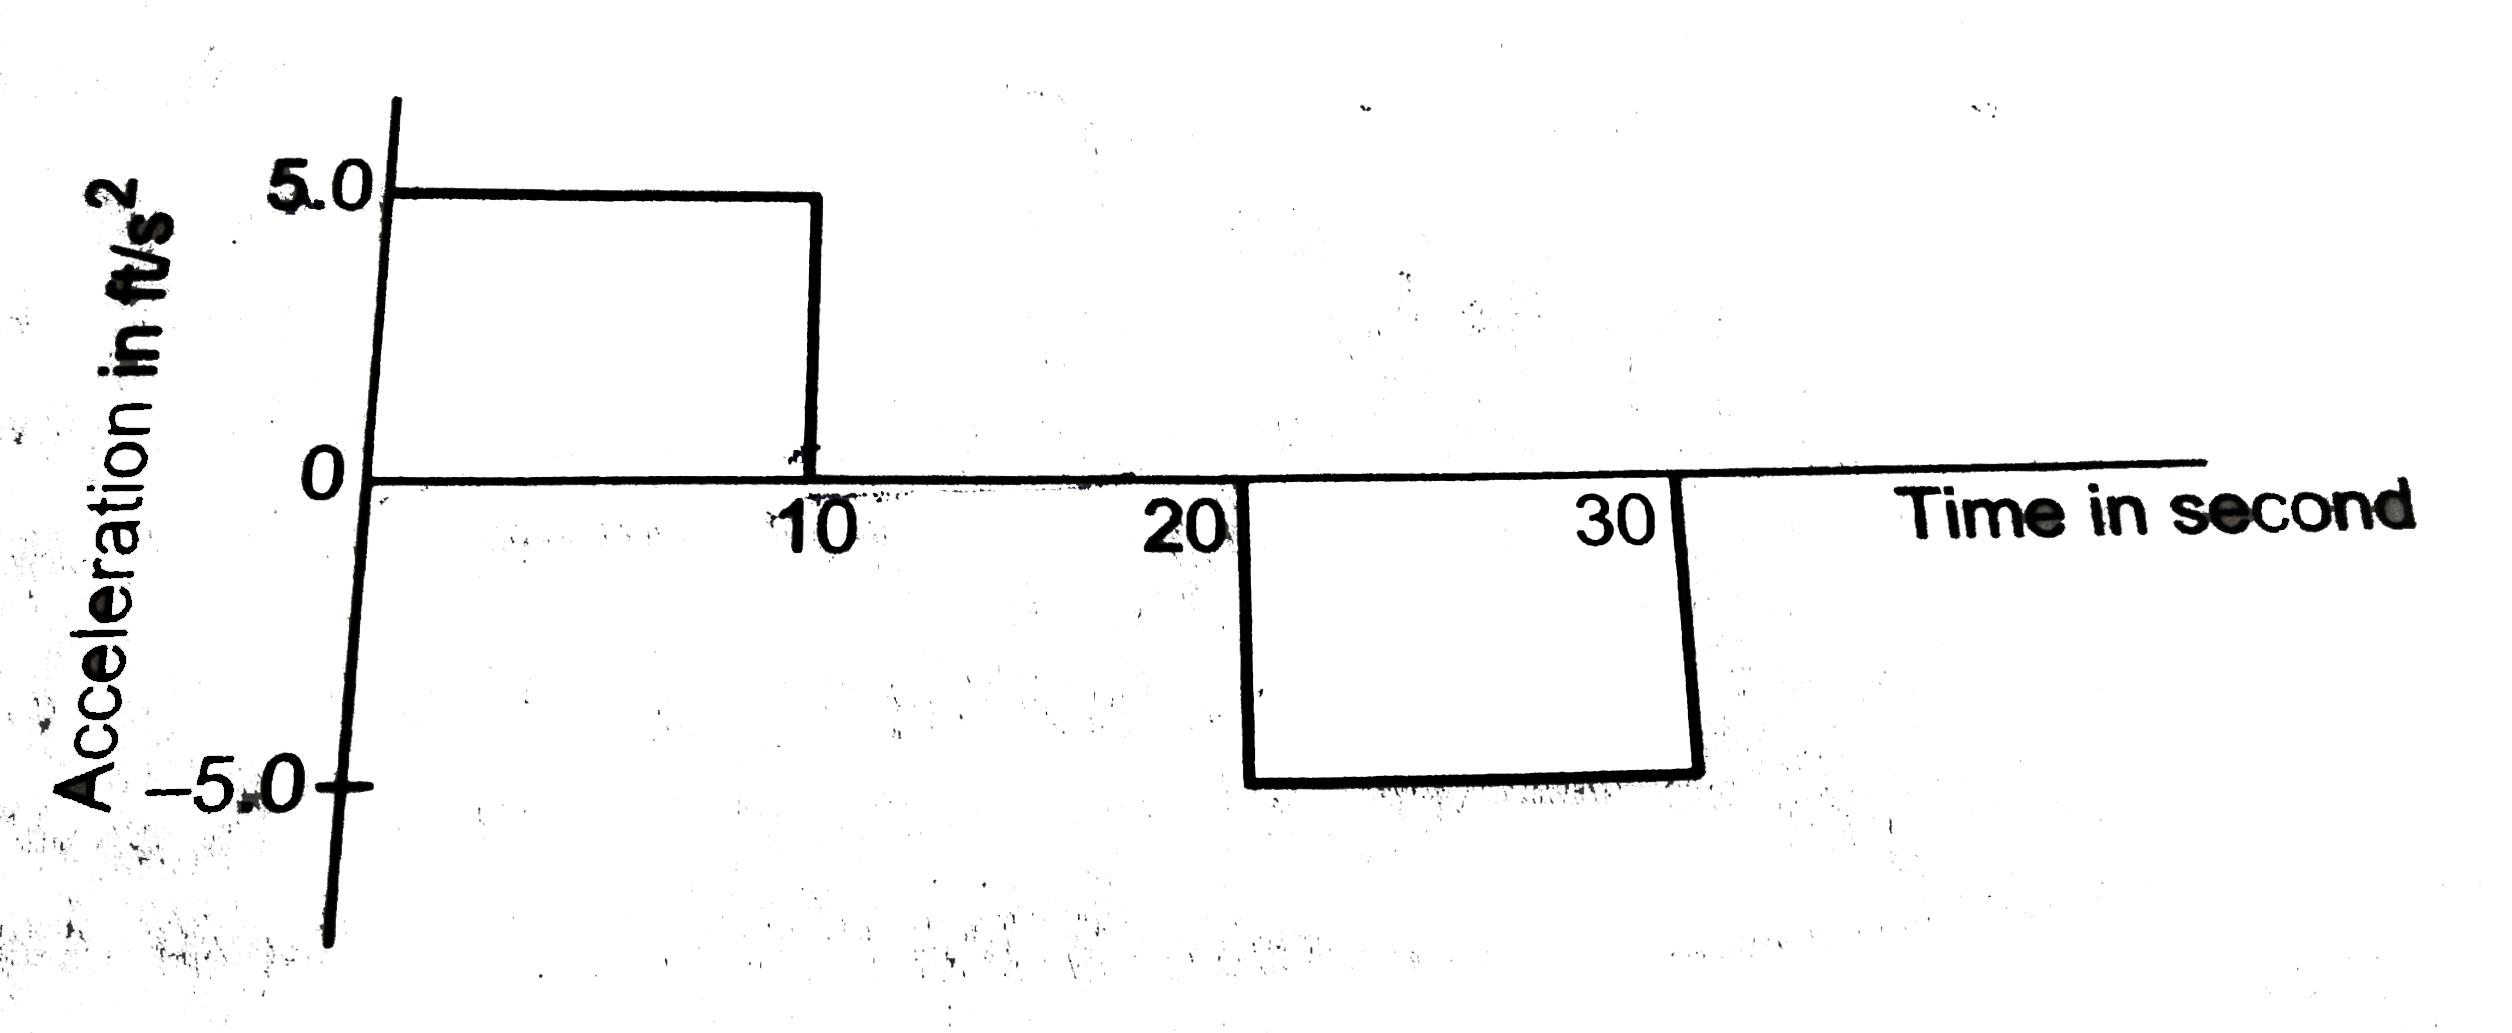
View SolutionThe acceleration of a cart started at t=0 varies with time as shown in figure. Find the distance travelled in 30 seconds and draw the position time graph.
View SolutionFor body of 50 kg. mass, the velocity time graph is shown in figure. Then force acting on the body is :-
View SolutionThe force(F) acting on a particle of mass m changing with time(t) is as shown in (F−t) graph. The change in linear momentum from t=0 to t=6 s (in kN s) is

View SolutionThe velocity-time graph of a car moving along a straight road is shown in figure. The average velocity of the car is first 25 seconds is
View SolutionThe velocity-time graph of a car moving along a straight road is shown in figure. The average velocity of the car in first 25 seconds is
View SolutionForce acting on a block versus time graph is as shown in figure Choose the correct options.(g=10m/s−2)
View Solution