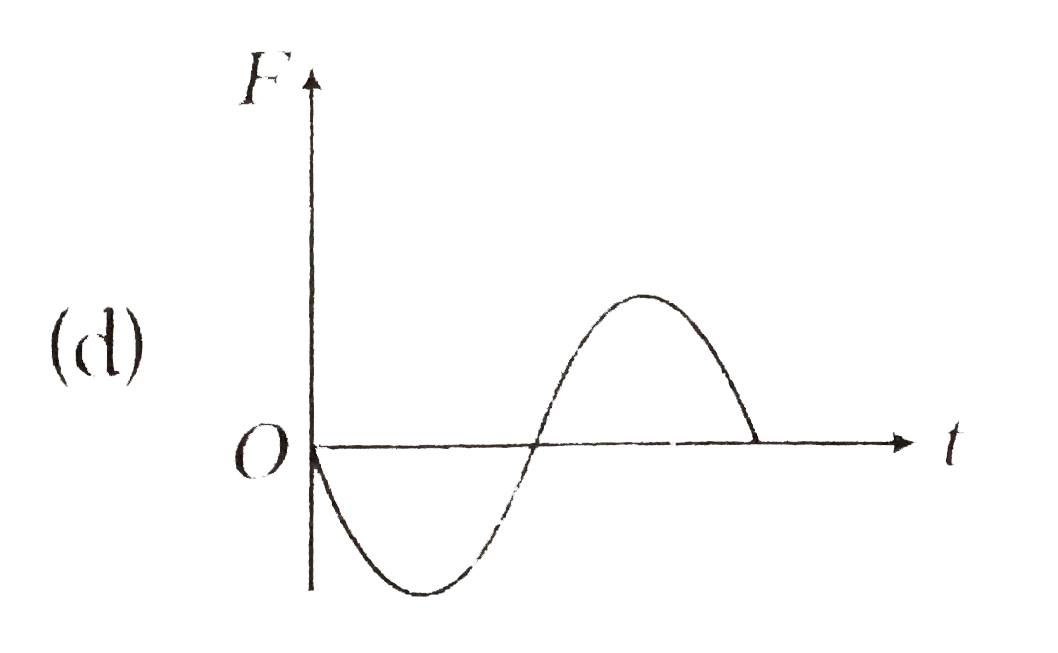
The momentum p of an object varies with time (t) as shown in figure. The corresponding force (F)- time (t) graph is -
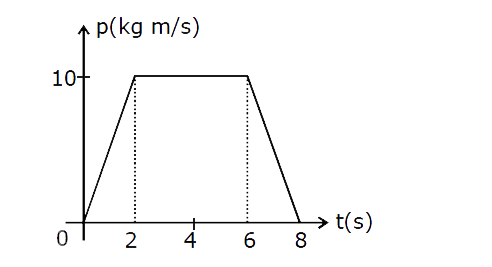
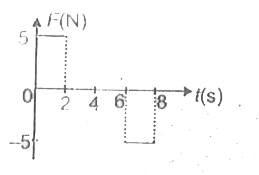
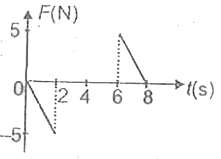
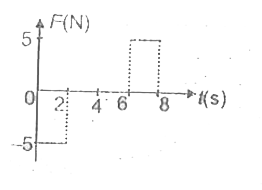
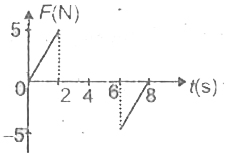
Step by step video & image solution for The momentum p of an object varies with time (t) as shown in figure. The corresponding force (F)- time (t) graph is - by Physics experts to help you in doubts & scoring excellent marks in Class 12 exams.
Updated on:21/07/2023Topper's Solved these Questions
- LAWS OF MOTIONBOOK - AAKASH INSTITUTE ENGLISHCHAPTER - LAWS OF MOTIONEXERCISE - Assignment (SECTION-C)
63 Videos
- LAWS OF MOTIONBOOK - AAKASH INSTITUTE ENGLISHCHAPTER - LAWS OF MOTIONEXERCISE - Assignment (SECTION-D) (Assertion-Reason Type Questions)
15 Videos
- LAWS OF MOTIONBOOK - AAKASH INSTITUTE ENGLISHCHAPTER - LAWS OF MOTIONEXERCISE - Assignment (SECTION-A)
65 Videos
- KINETIC THEORYBOOK - AAKASH INSTITUTE ENGLISHCHAPTER - KINETIC THEORYEXERCISE - EXERCISE (ASSIGNMENT) SECTION - D Assertion - Reason Type Questions
10 Videos
- MAGNETISM AND MATTER BOOK - AAKASH INSTITUTE ENGLISHCHAPTER - MAGNETISM AND MATTER EXERCISE - ASSIGNMENT (SECTION D)
26 Videos
Similar Questions
The displacement time graph of a particle executing S.H.M as shown in the figure.
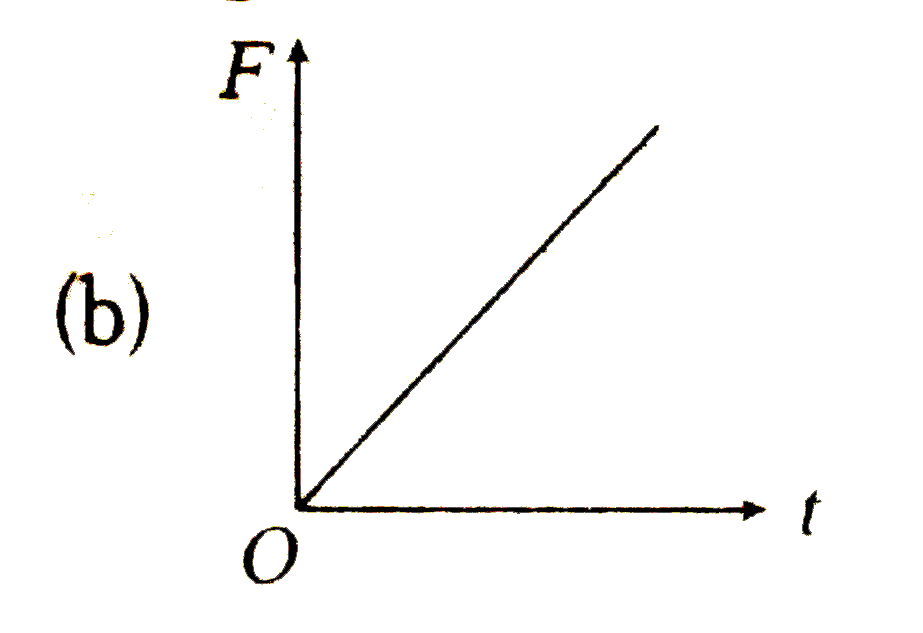
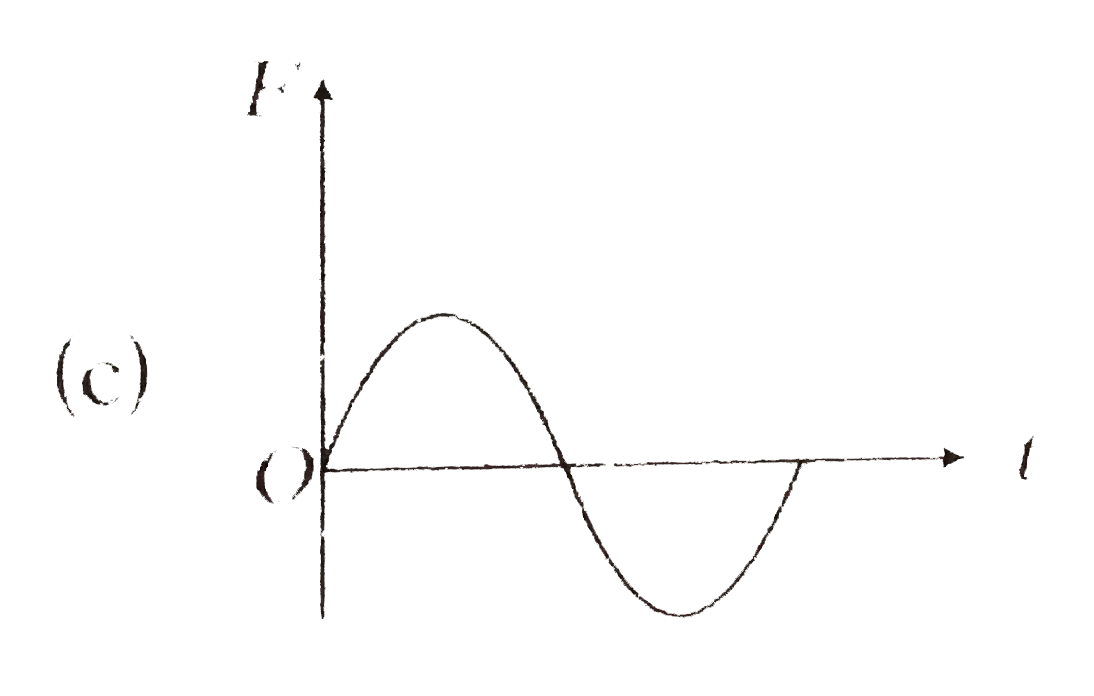
 The corresponding force-time graph of the partical will be
View SolutionThe displacement-time graph of a particle executing SHM is as shown in the figure.

The corresponding force-time graph of the particle is
(a)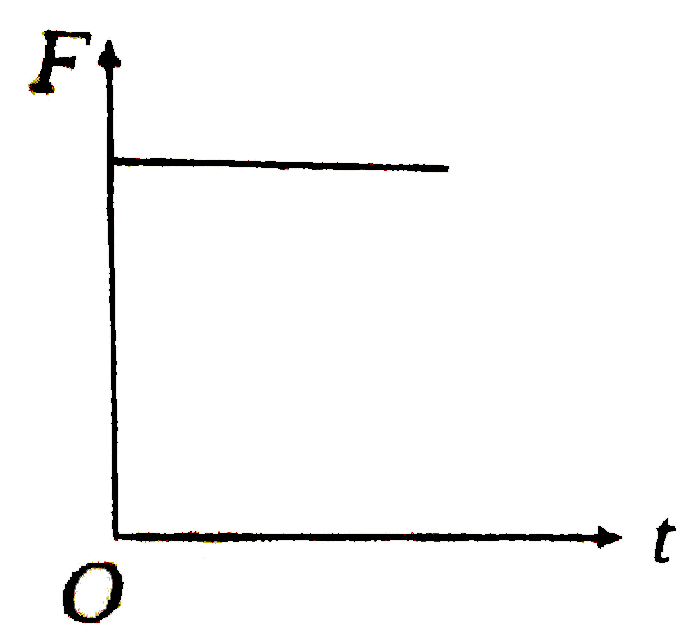
View Solution
Knowledge Check
A force F acting on an object varies with distance x as shown in the figure. The work done by the force in moving the object from x=0 to x = 20 m is
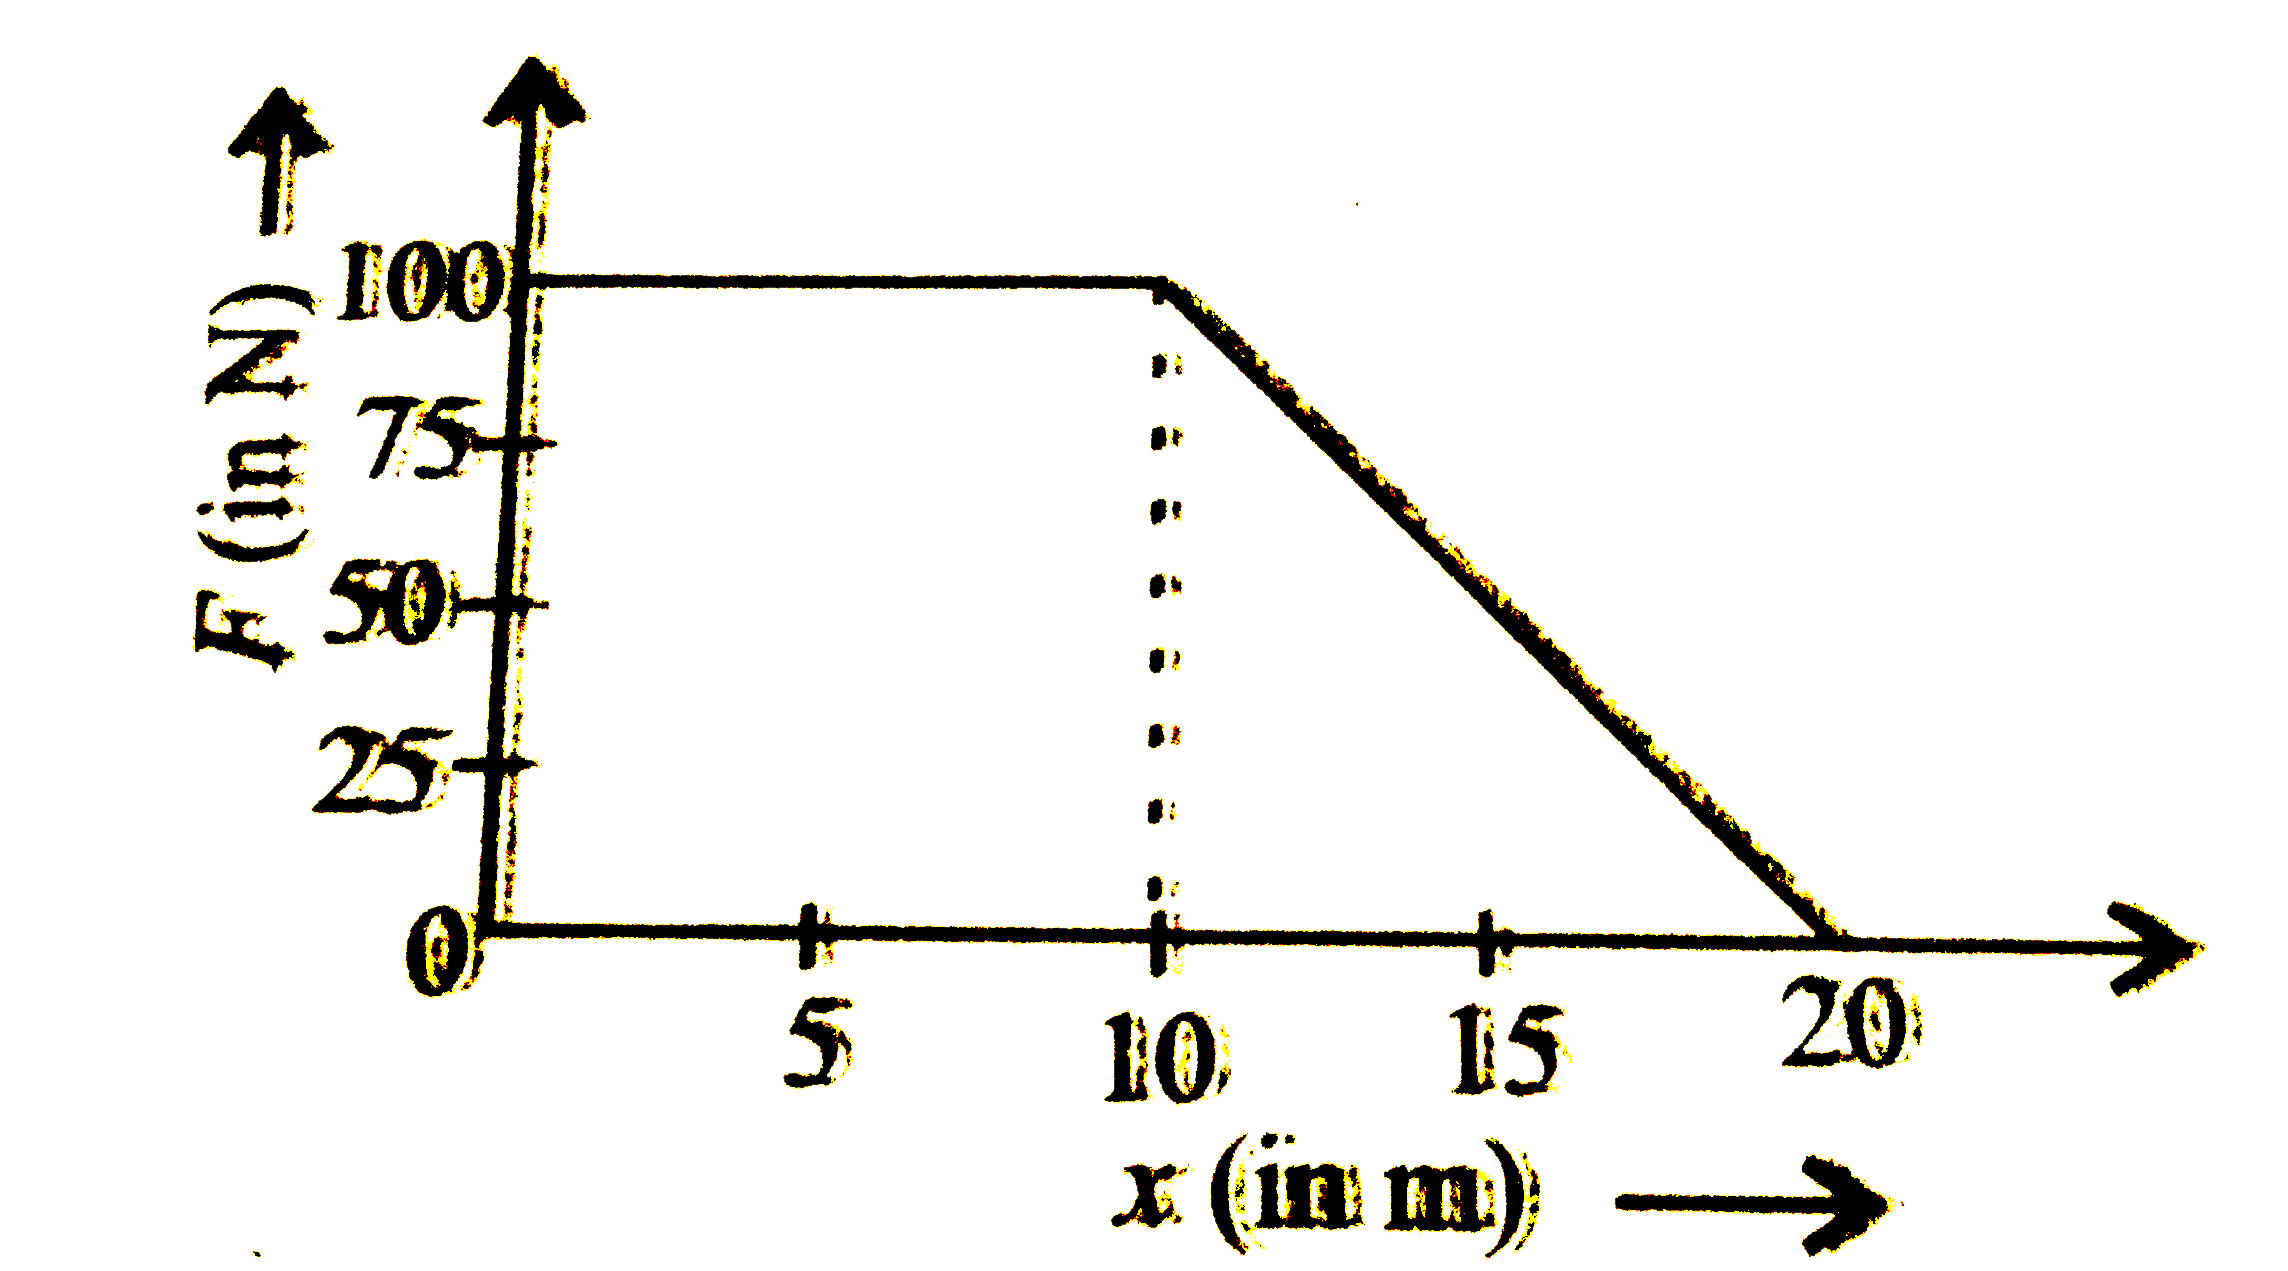 A500 JB1000 JC1500 JD2000 J
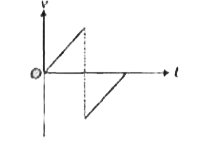
A baseball having a mass of 0.4kg is thrown such that the force acting on it varies with time as shown in the first graph. The correspondeng velocity time gragh is shown in the second graph. Detemine the power applied as a functon time and the work done till t=0.3s.

View SolutionThe velocity (v) - time (t) graph for a particle moving along x - axis is shown in the figure. The corresponding position (x) - time (t) is best represented by
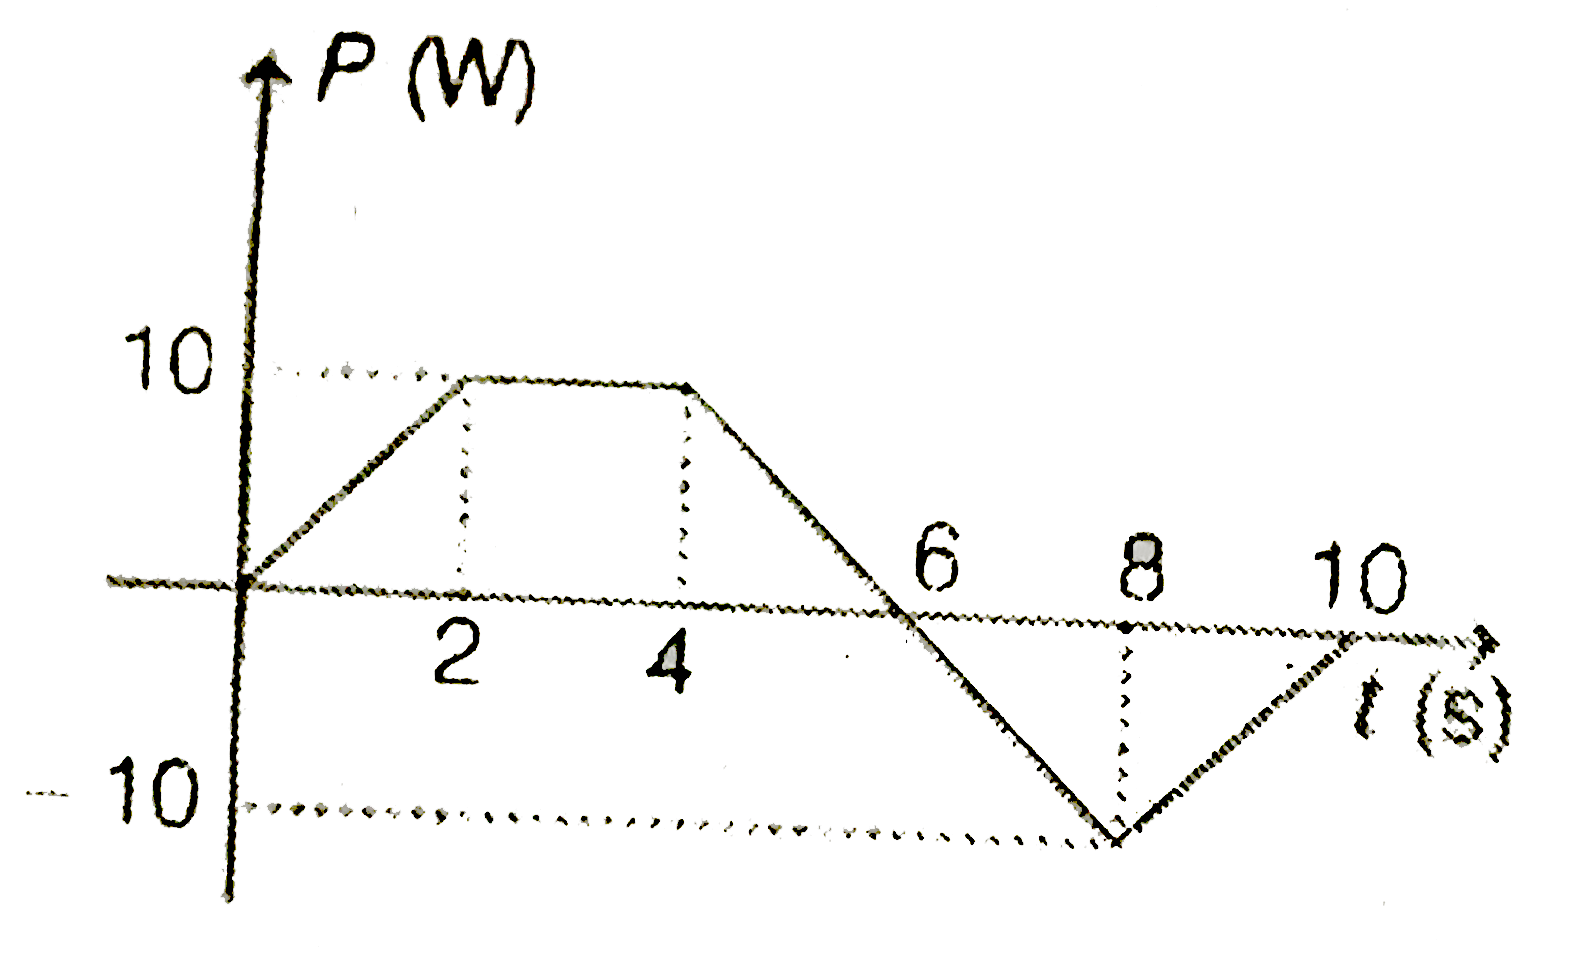
View SolutionPower of a force acting on a block varies with time t as shown in figure. Then, angle between force acting on the block and its velocity is
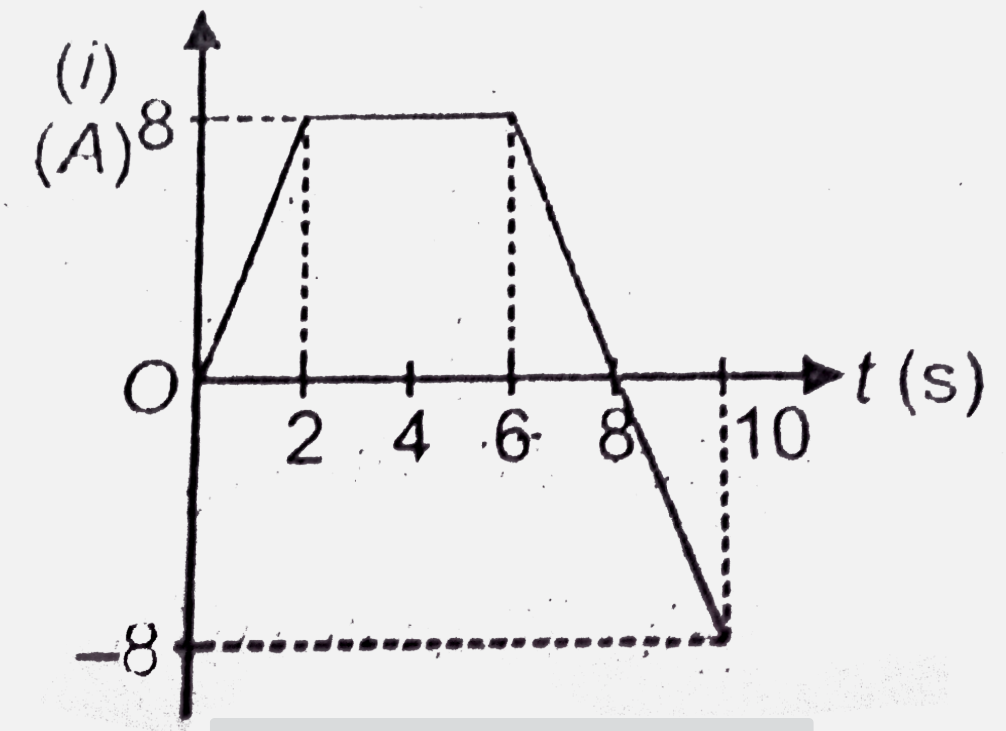
View SolutionThe current I through a conductor varies with time t as shown in figure. The average electric current during t=0 to t=10 s will be
View SolutionVelocity-time graph of a particle moving in a straight line is shown in figure. Plot the corresponding displacement-time graph of the particle if at time t=0, displacement s=0.
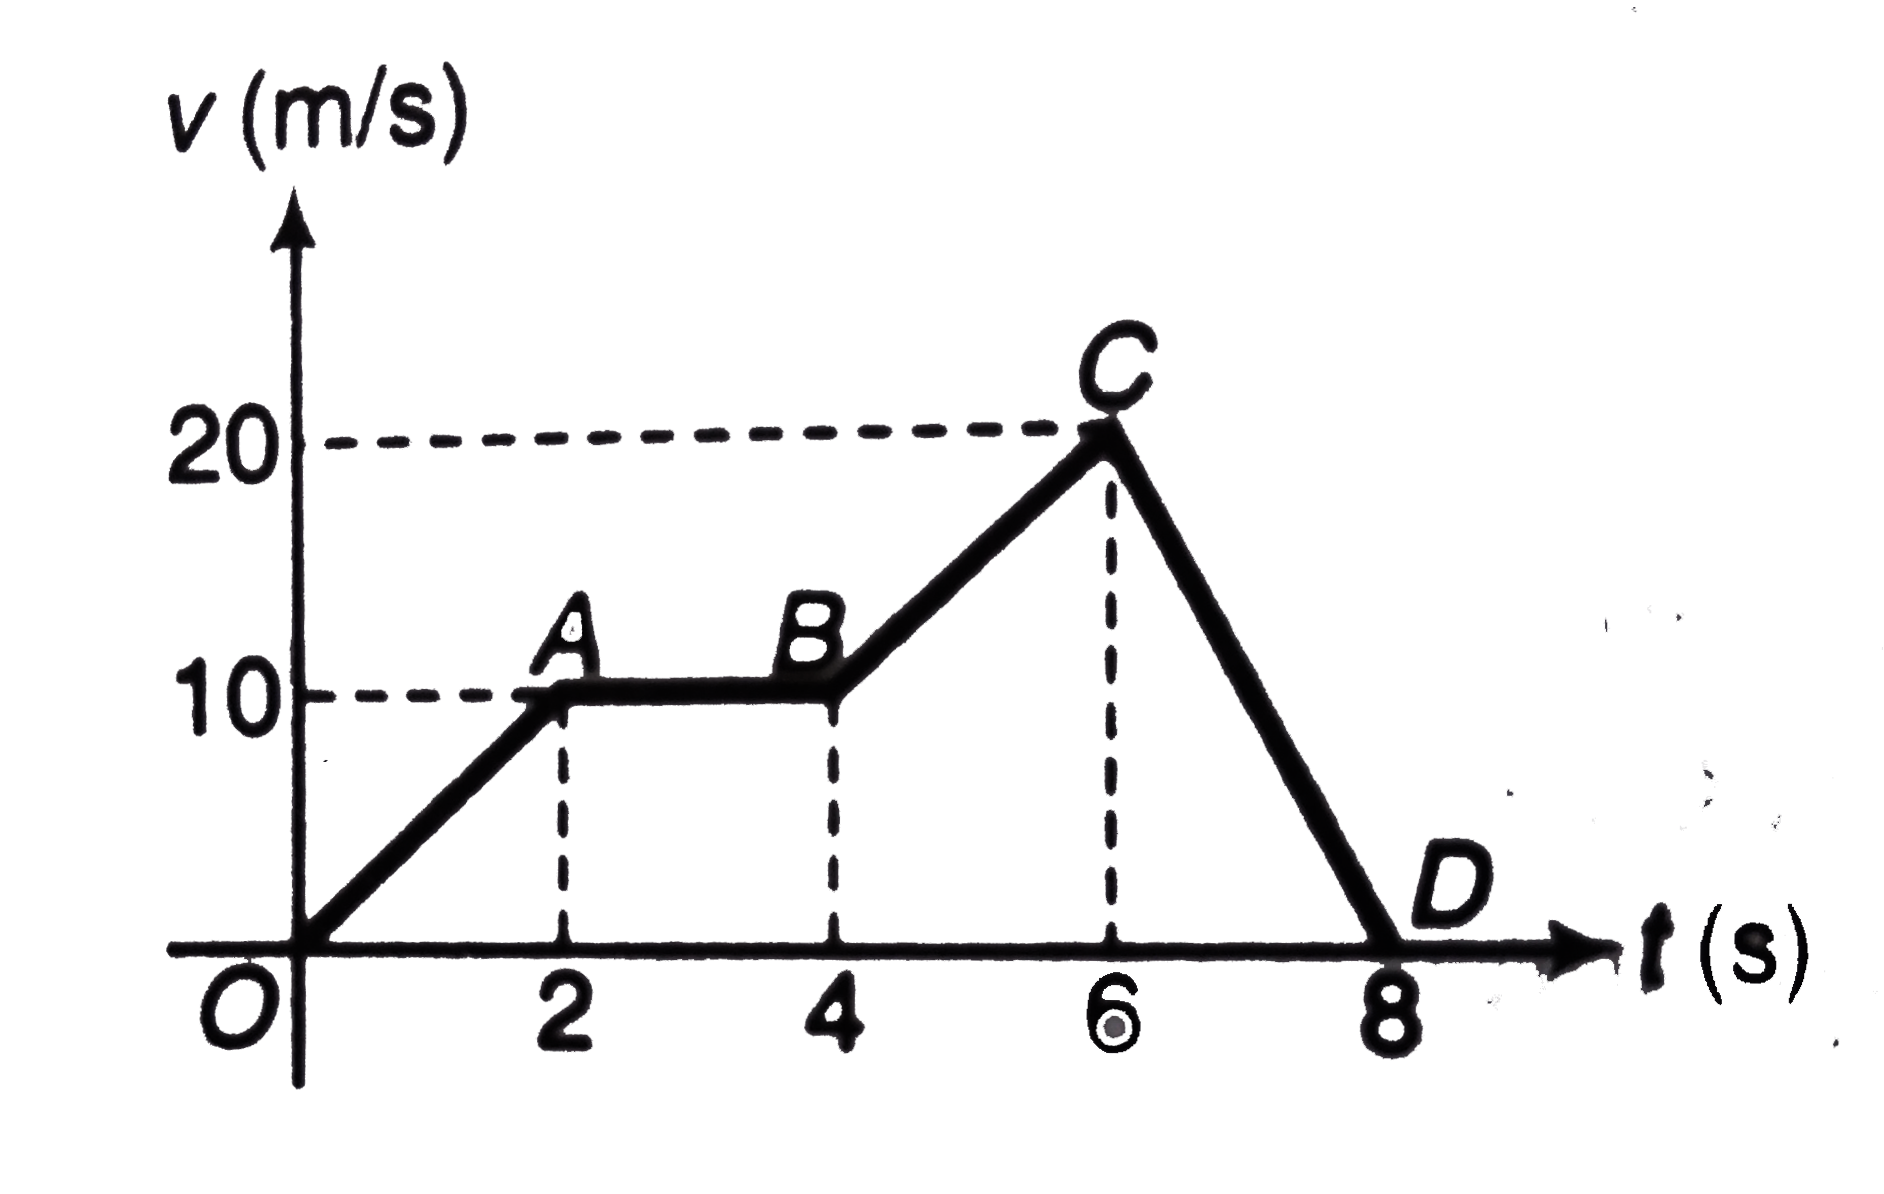
View SolutionVelocity-time graph of a particle moving in a straight line is shown in figure. Plot the corresponding displacement-time graph of the particle if at time t=0, displacement s=0.

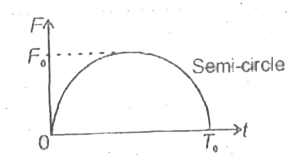
View SolutionThe magnitude of force acting on a particle moving along x-axis varies with time (t) as shown in figure. If at t = 0 the velocity of particle is v0, then its velocity at t=T0 will be
View Solution
