Force acting on a block versus time graph is as shown in figure Choose the correct options.(g=10m/s−2)
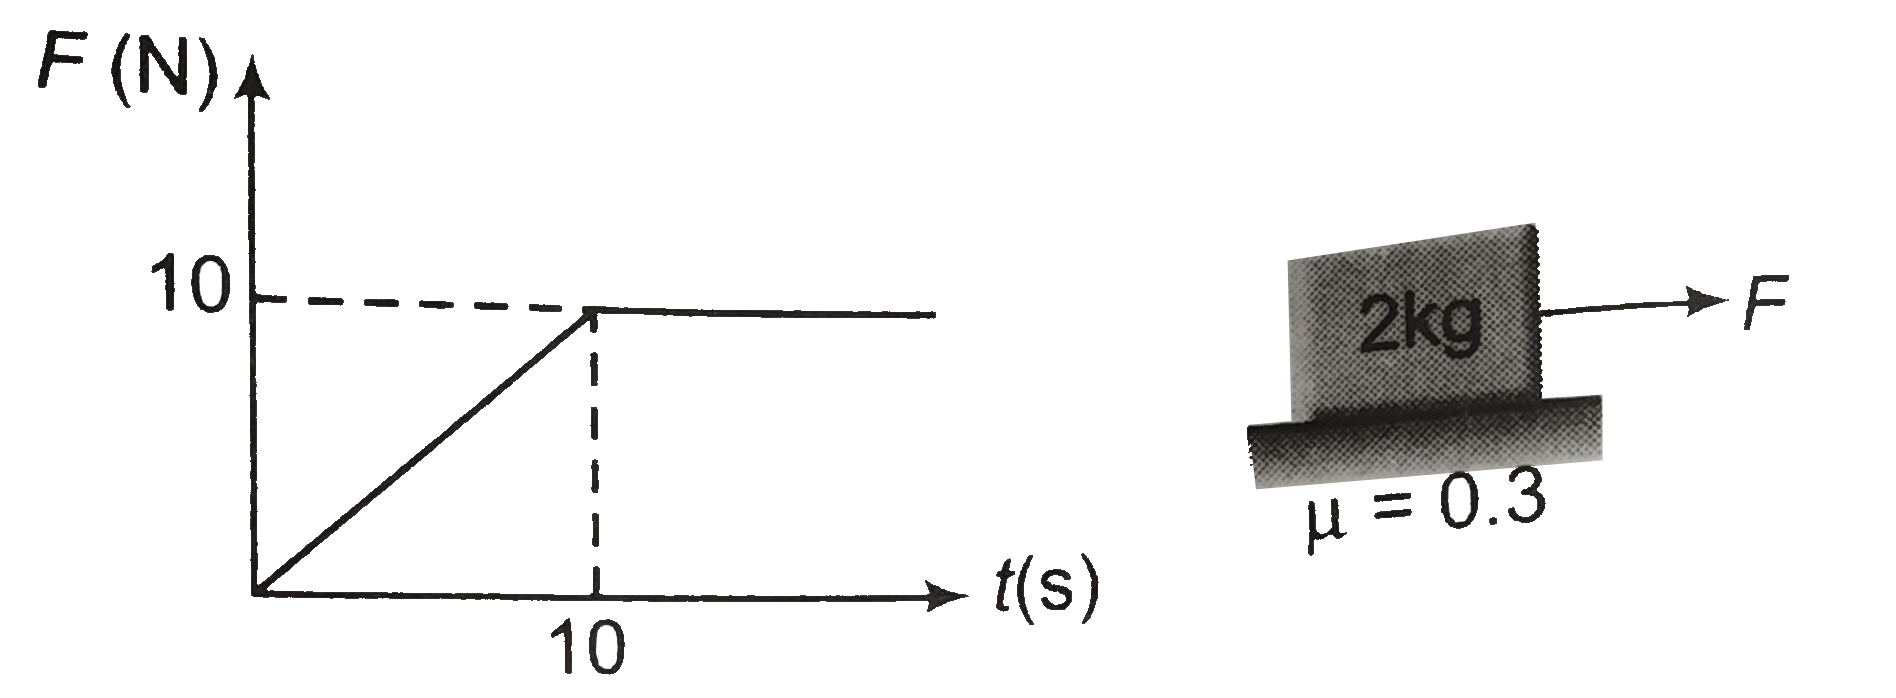
At t=2s, force of friction is 2N
At t=8s, force of friction is 6N
At t=10s, acceleration of block is 2ms−2
At t=12s, velocity of block is 8ms−1
The correct Answer is:A, B, C, D
fmax=0.3×2×10=6N
At t=2s,F=2N<fmax
∴f=F=2N
At t=8s,F=8N>fmax
∴f=6N
At t=10s,F=10N>fmax
∴f=6N
a=F−fm=10−62=2m/s2
F=fmax=6Nat6s
For 6s≤t≤10s
a=F−fm=t−62=0.5t−3
∫v0dv=∫adt=∫106(0.5t−3)dt
v=4m/s
After10s
a=F−fm=10−62=2m/s2
=constant
∴v'=v+at
=4+2(12−10)
=8m/s
Topper's Solved these Questions
- LAWS OF MOTIONBOOK - DC PANDEY ENGLISHCHAPTER - LAWS OF MOTIONEXERCISE - Comprehension
9 Videos
- LAWS OF MOTIONBOOK - DC PANDEY ENGLISHCHAPTER - LAWS OF MOTIONEXERCISE - Subjective Question
27 Videos
- LAWS OF MOTIONBOOK - DC PANDEY ENGLISHCHAPTER - LAWS OF MOTIONEXERCISE - Single Correct
90 Videos
- KINEMATICS 1BOOK - DC PANDEY ENGLISHCHAPTER - KINEMATICS 1EXERCISE - INTEGER_TYPE
15 Videos
- LAWS OF THERMODYNAMICSBOOK - DC PANDEY ENGLISHCHAPTER - LAWS OF THERMODYNAMICSEXERCISE - Level 2 Subjective
18 Videos
Similar Questions
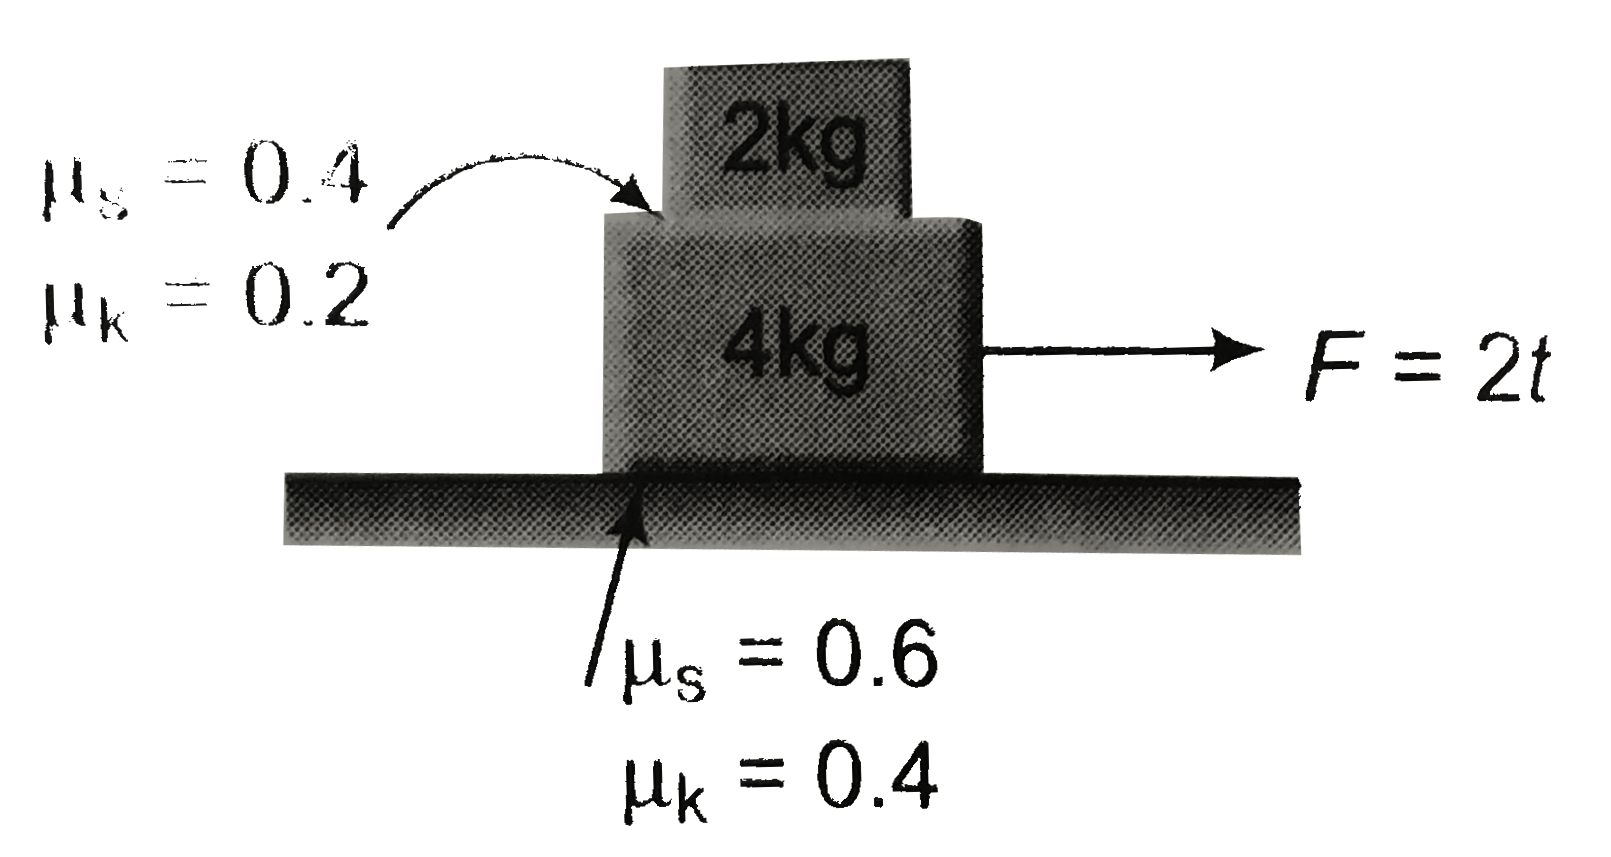
For the given situation shown in figure , choose the correct option (g=10m/s−2)
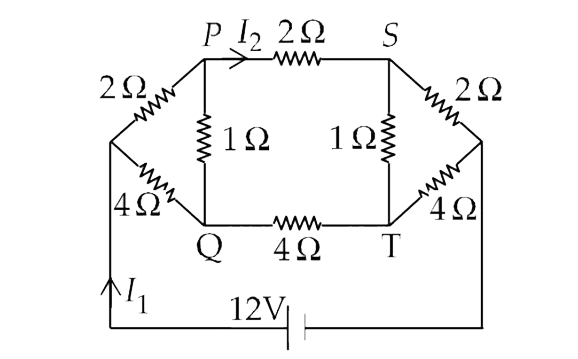
View SolutionFor the resistance network shown in the figure, choose the correct options (s)
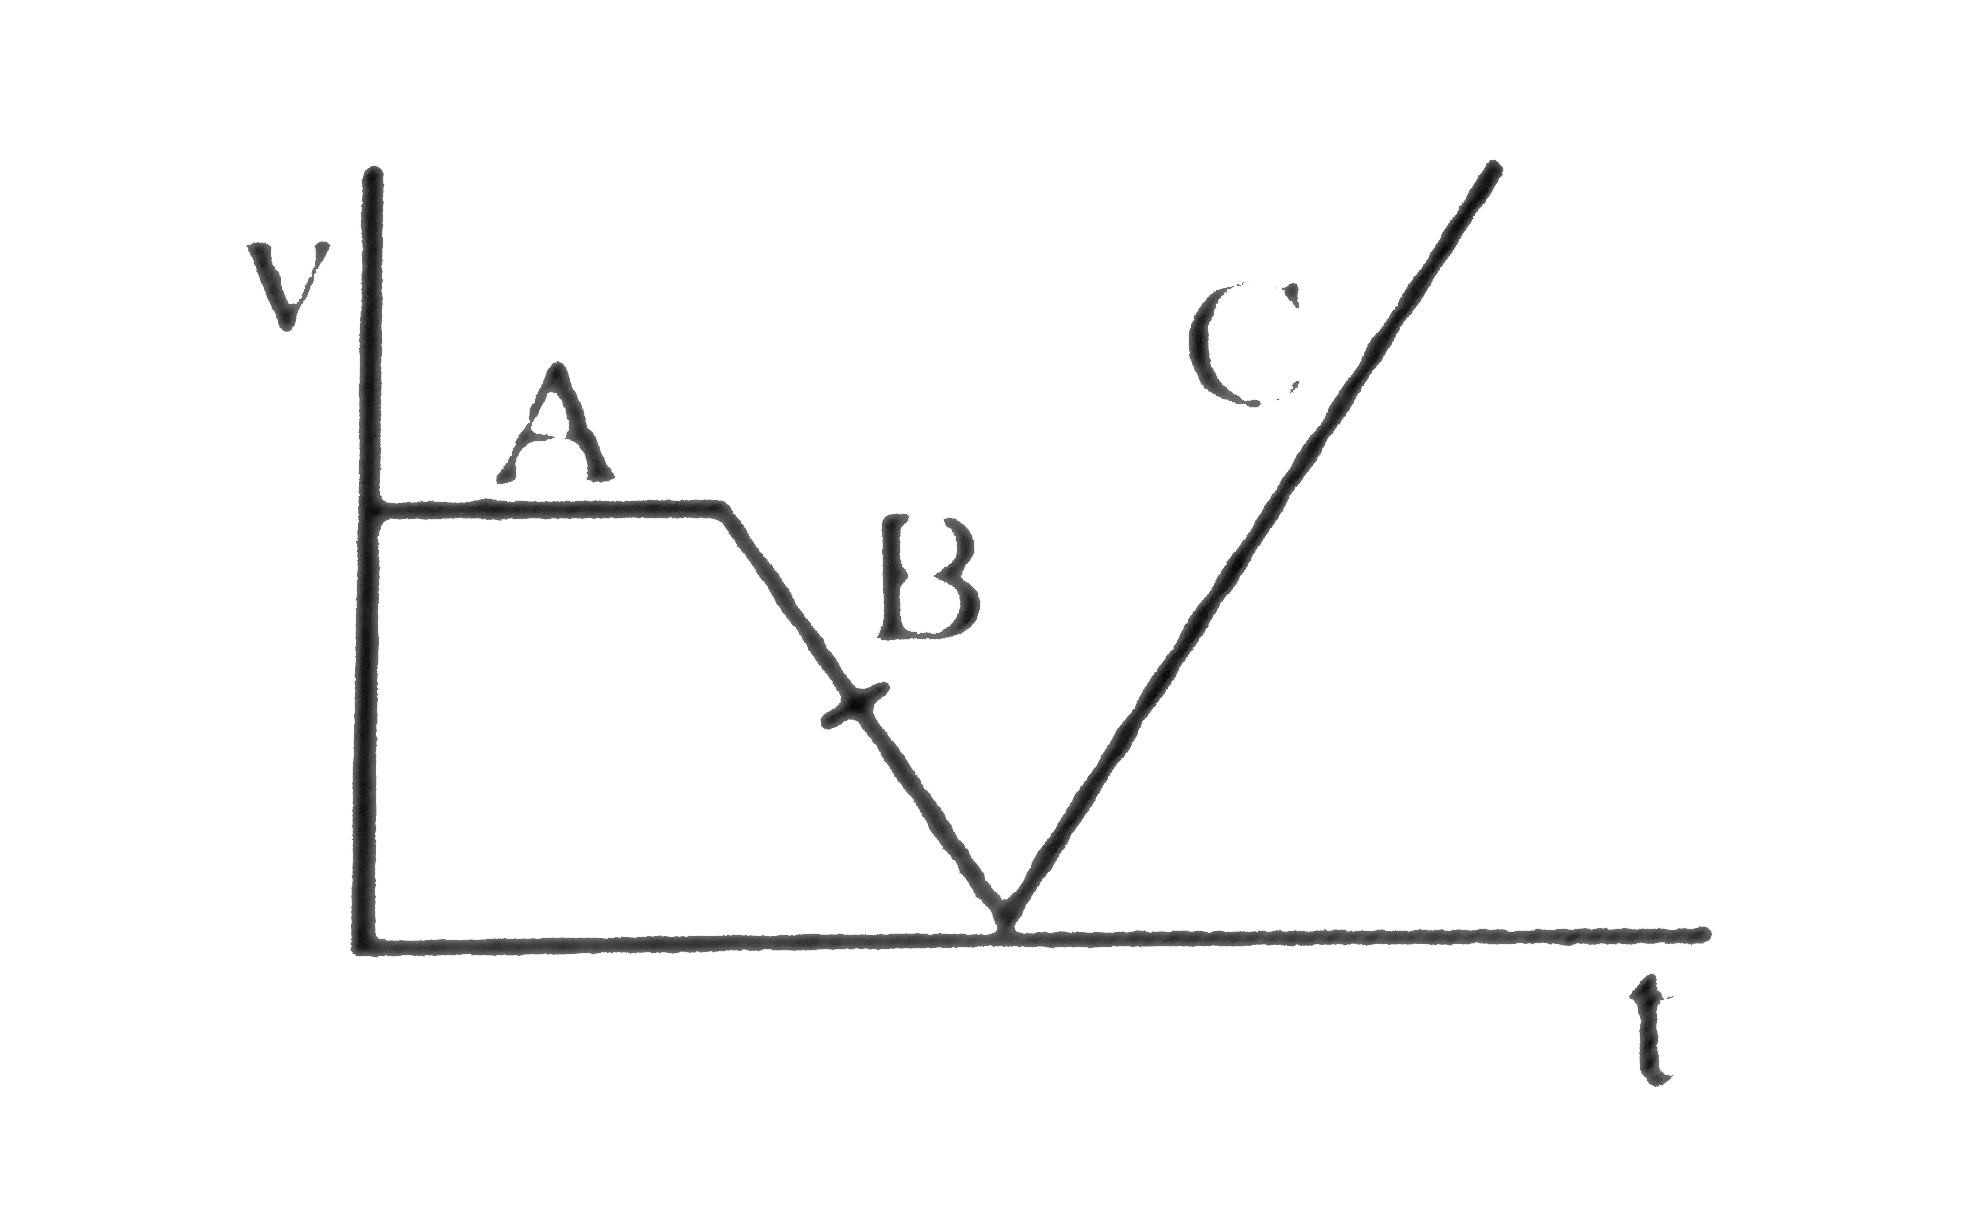
View SolutionVelocity versus time graph of a body is shown in figure. It explains that
View Solution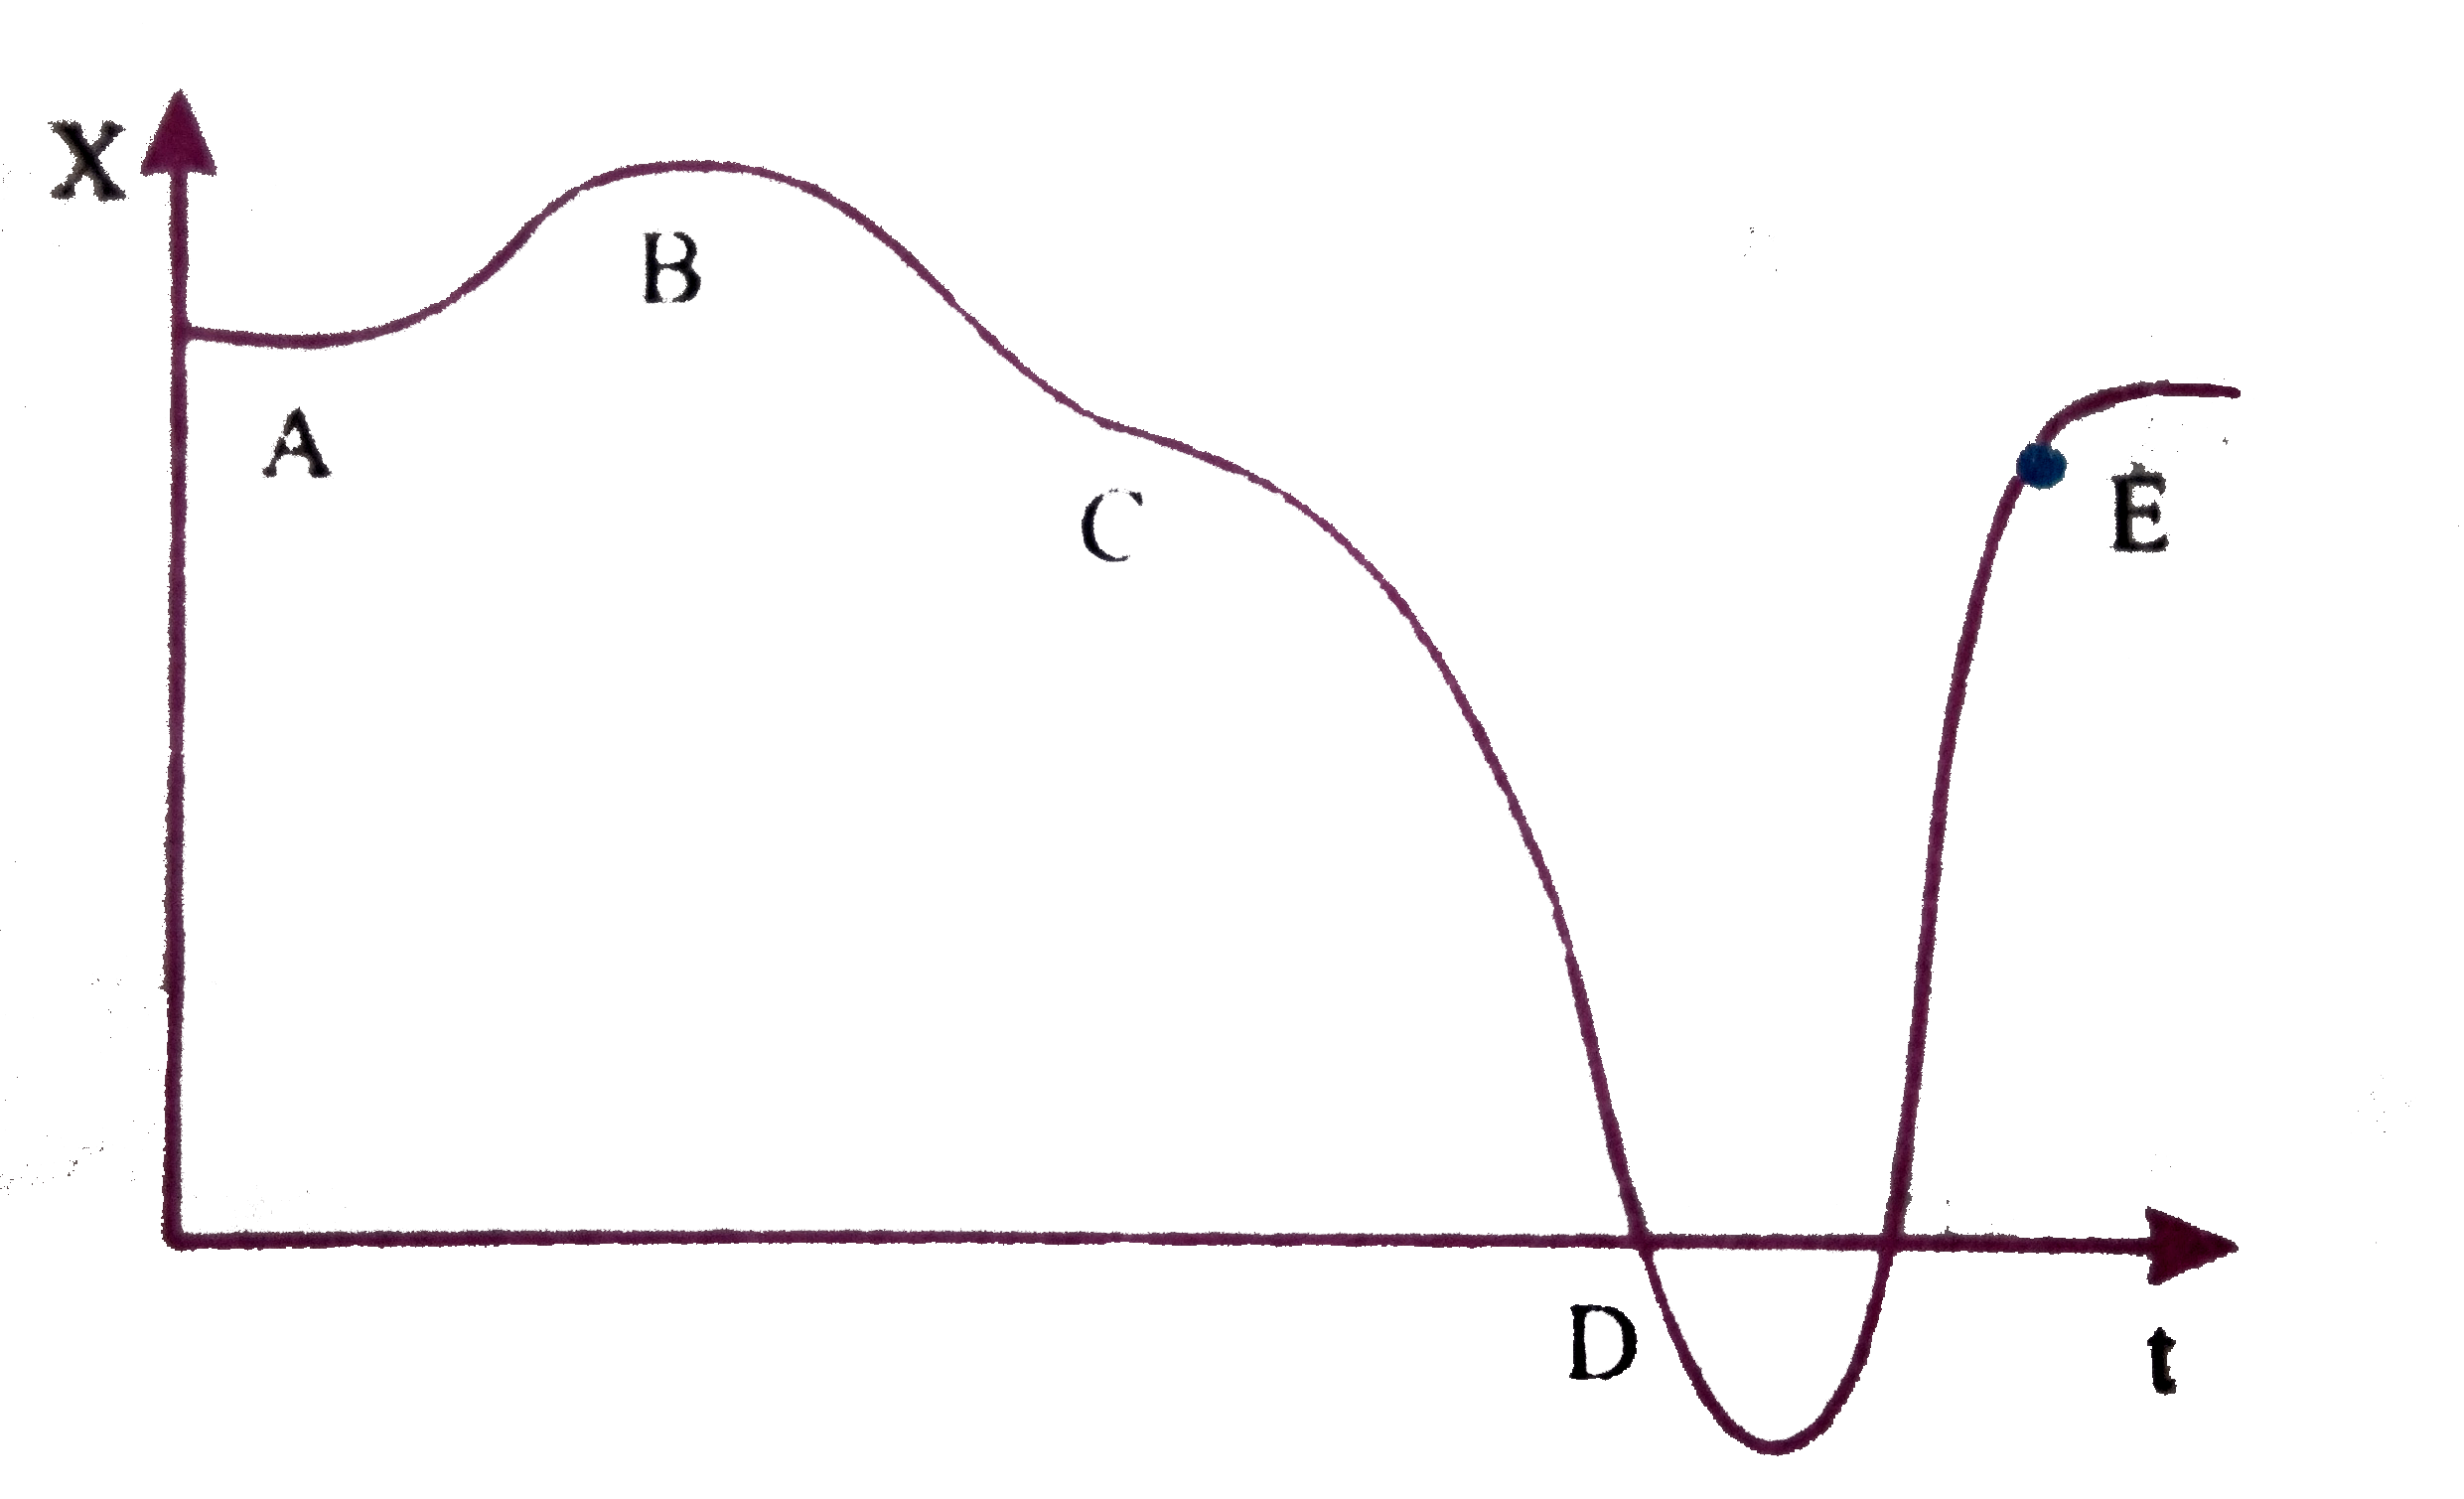
A graph of x versus t is shown in figure. Choose correct alternative from below.
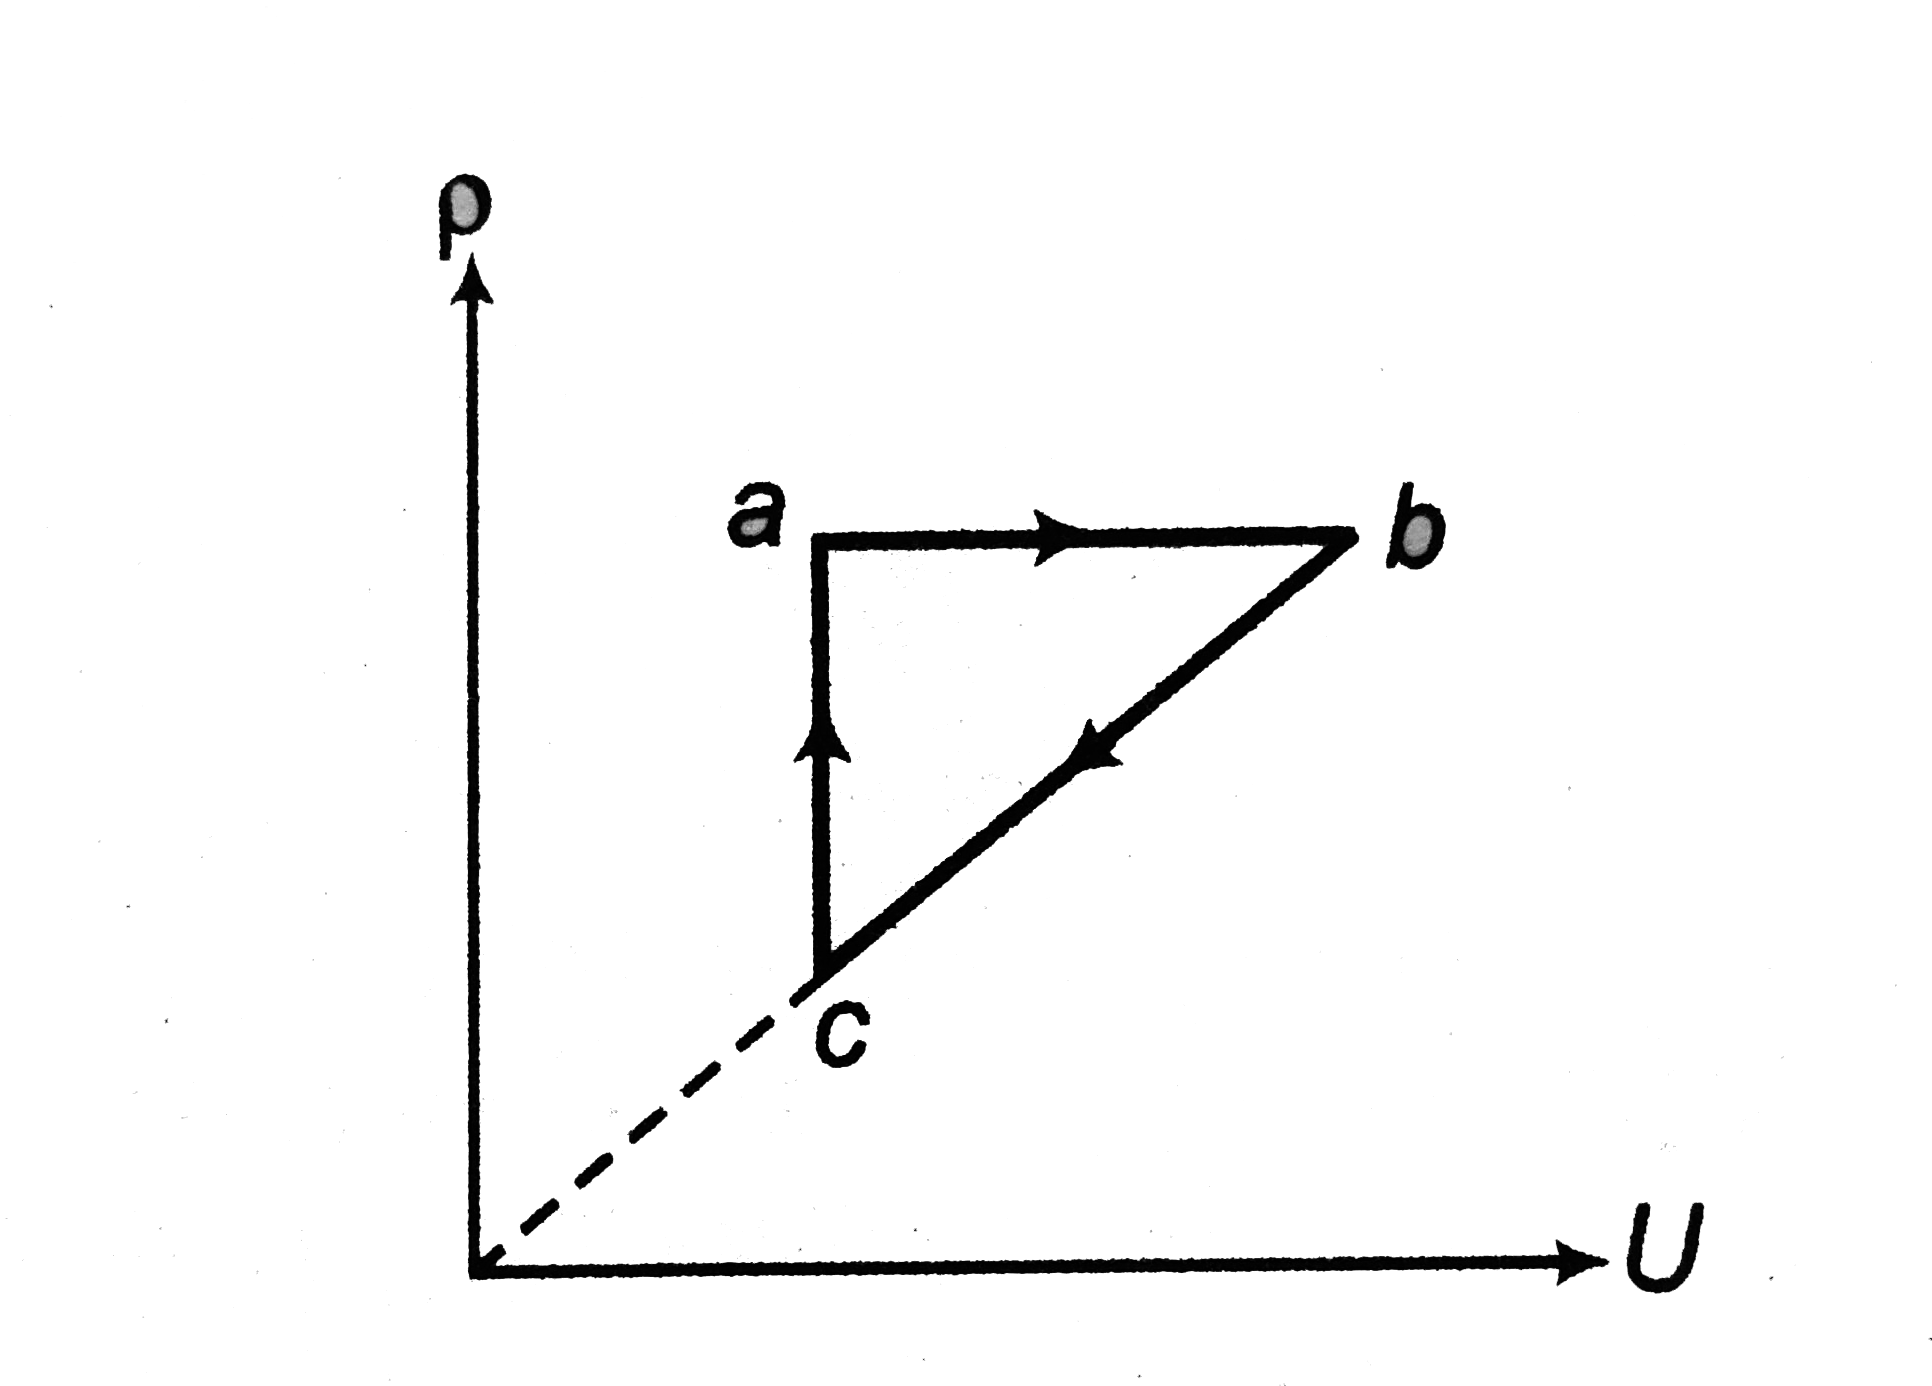
View SolutionDensity (ρ) versus internal energy (U) graph of a gas is as shown in figure. Choose the correct options.
Here, W is work done by gas and Q is heat given to the gas.
View SolutionConsidering the graph of 1s , choose the correct option:
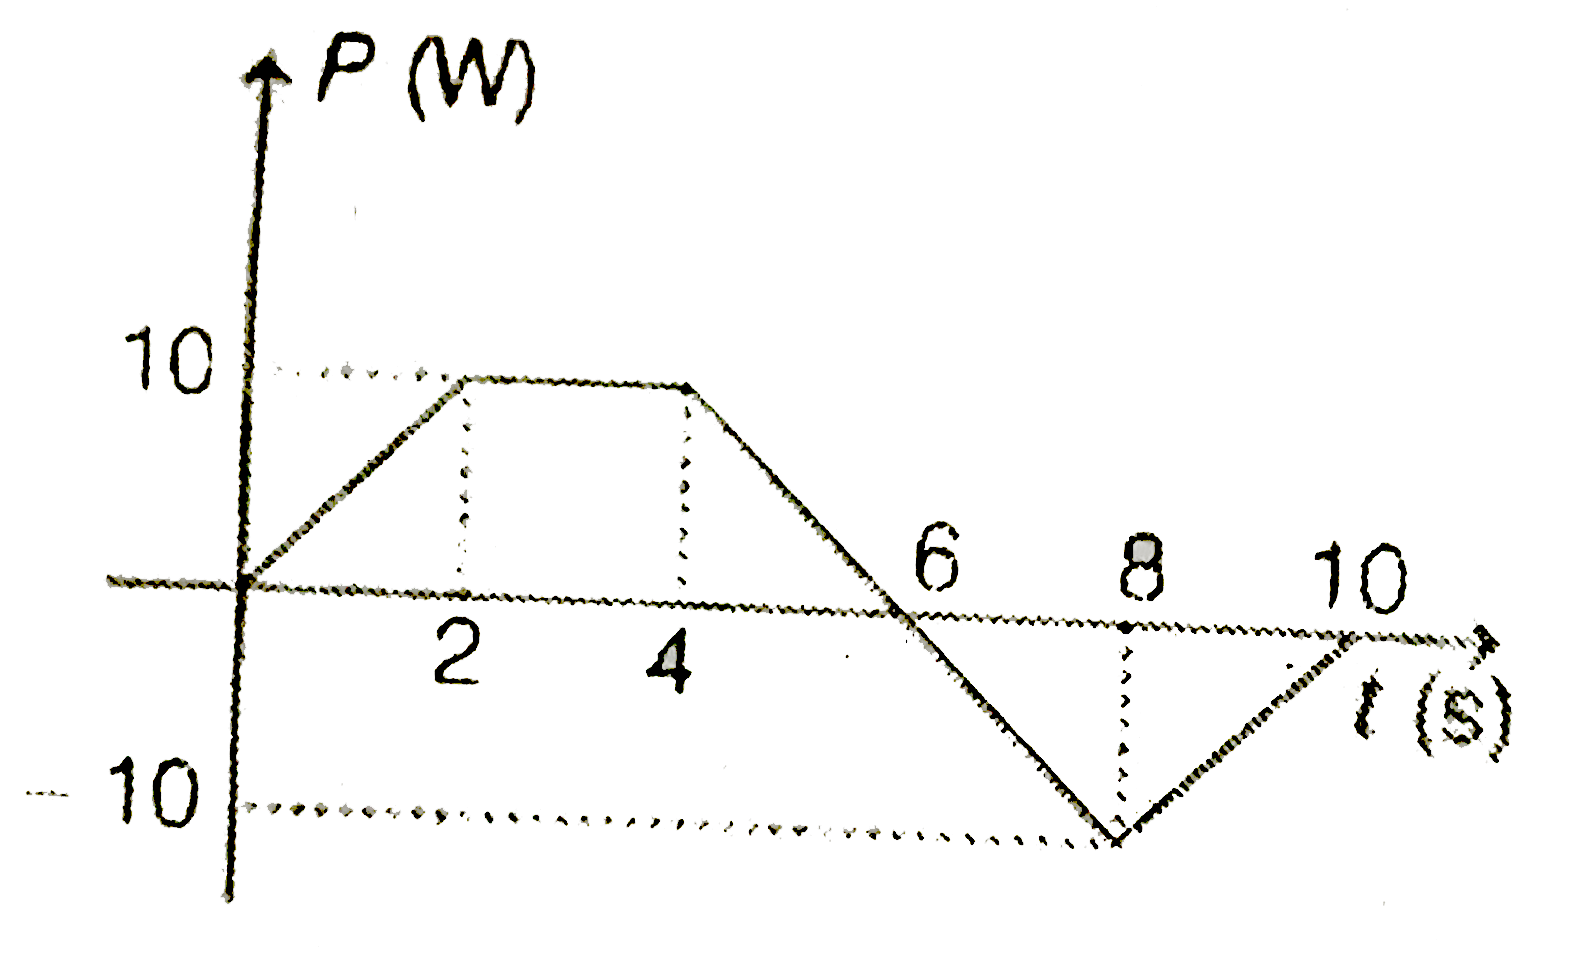
View SolutionPower of a force acting on a block varies with time t as shown in figure. Then, angle between force acting on the block and its velocity is
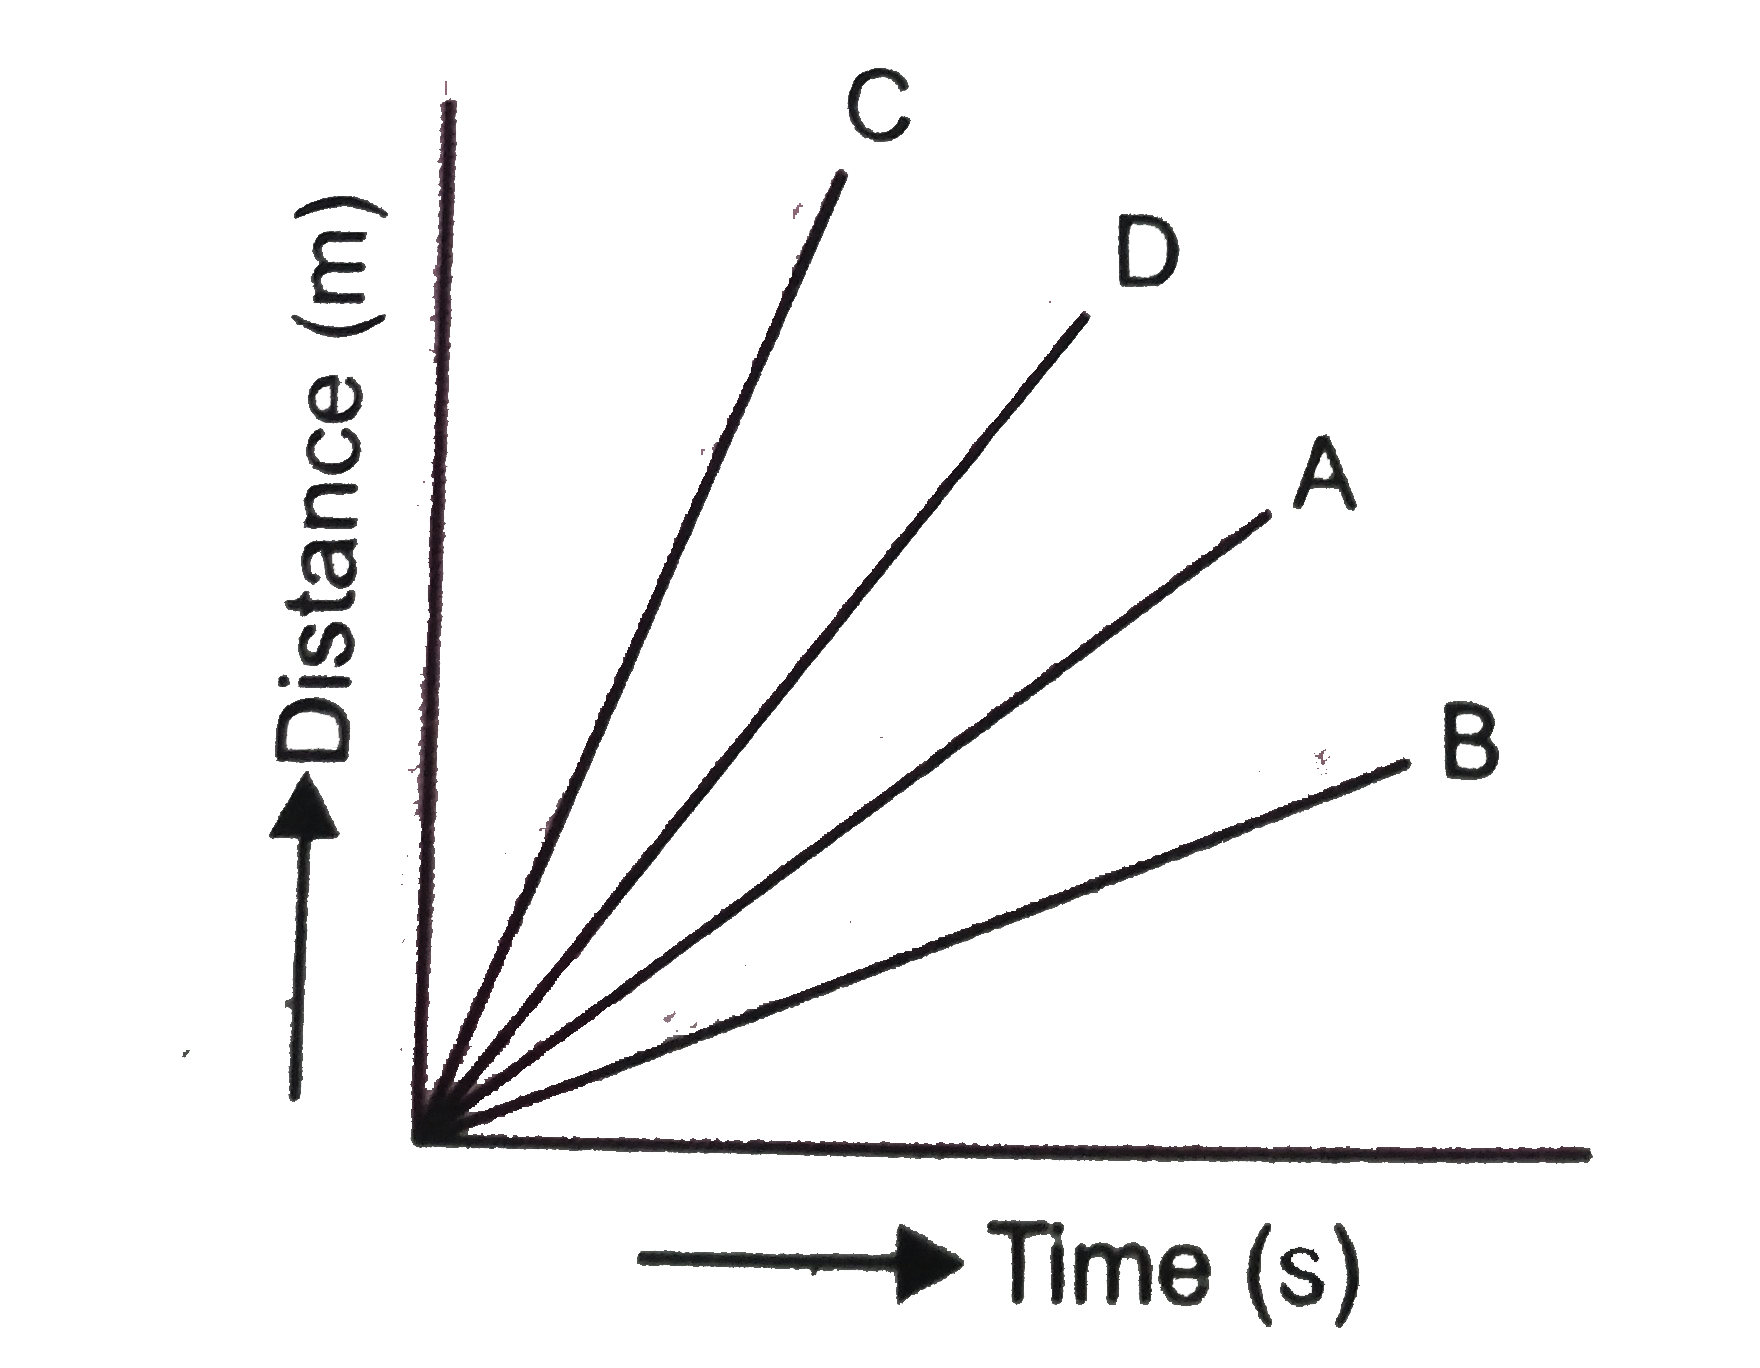
View SolutionFour cars A,B and C are moving on a levelled road. Their distance versus time graphs are shown in Fig. Choose the correct statement
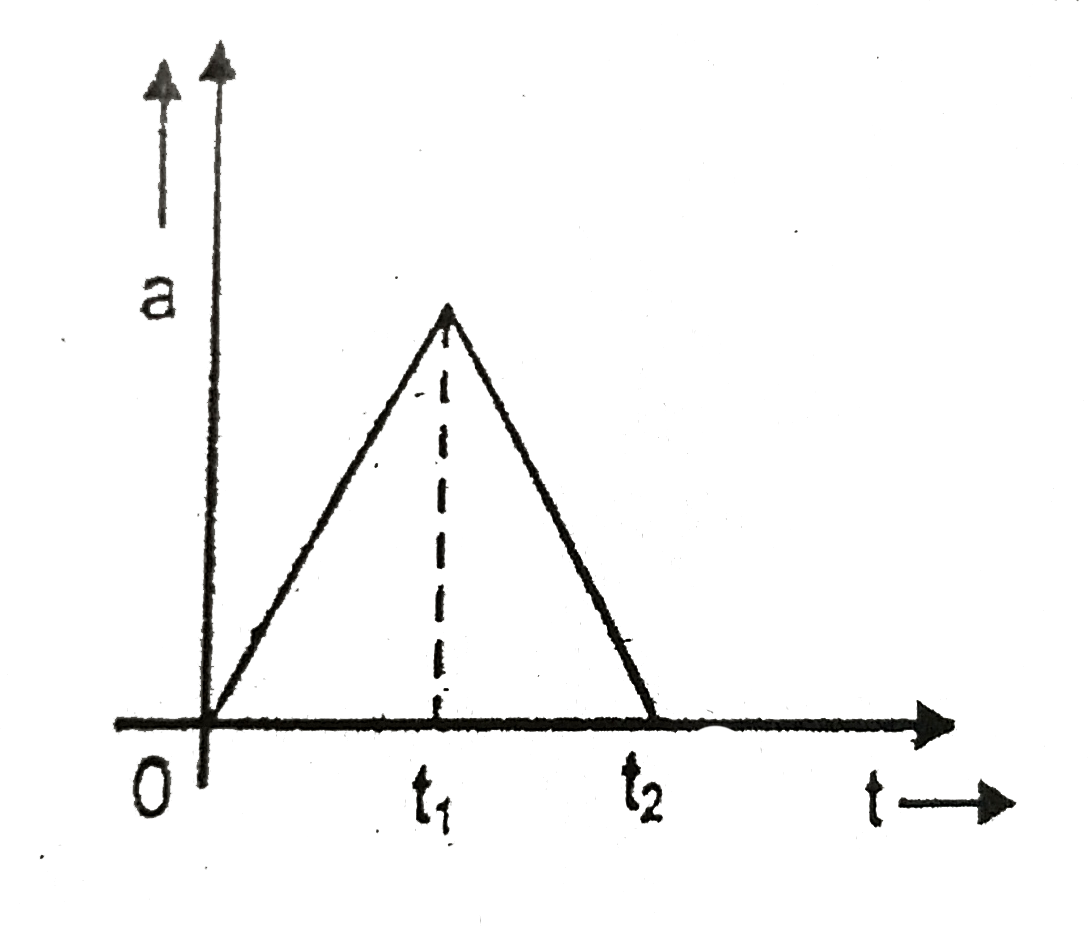
View SolutionA particle starts to move along a straight line. The acceleration versus time graph of particle is as shown in figure. The correct velocity versus time graph is :
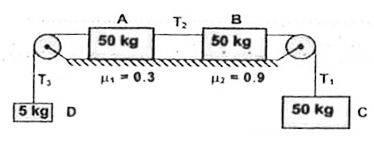
View SolutionA block pulley arrangement is shown in the figure. If f1andf2 represents frictional force acting on the block A and B respectively then choose the correct statement. (given g=10m/s2)
View Solution
