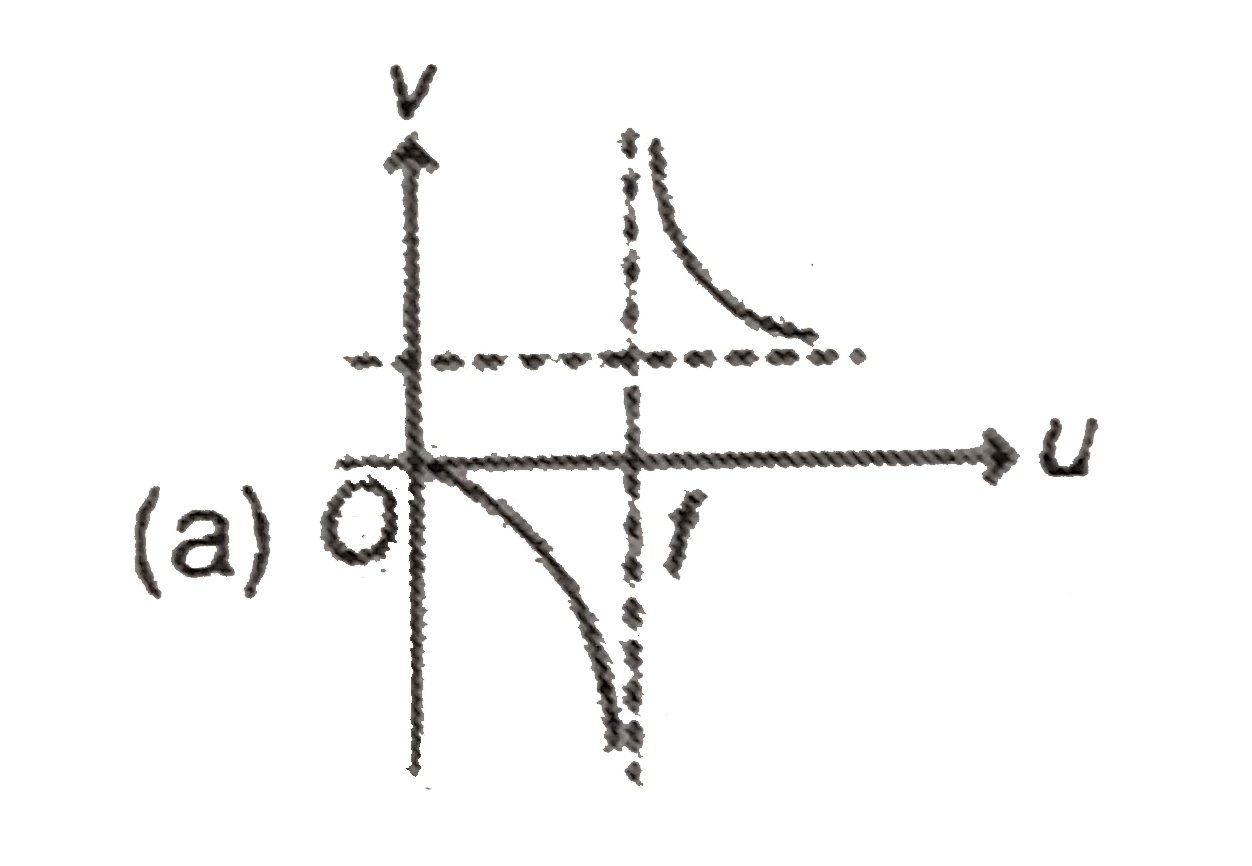
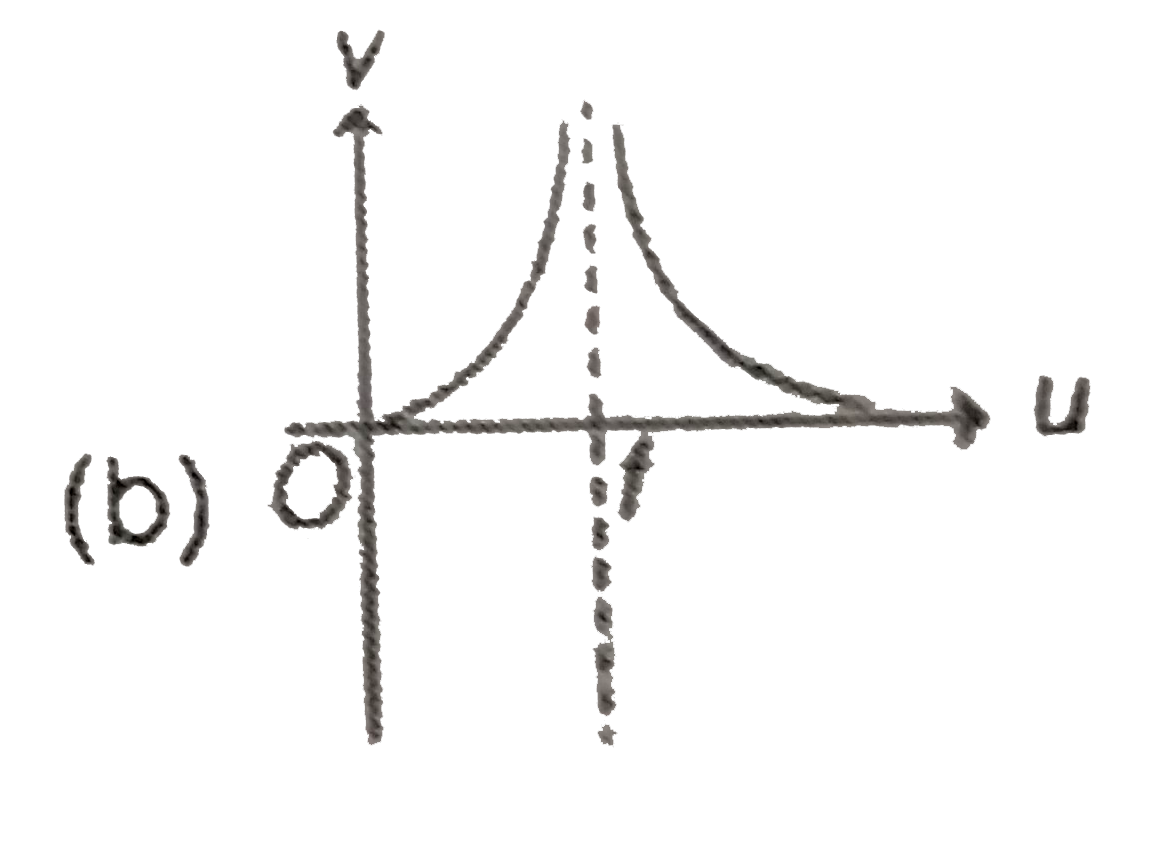
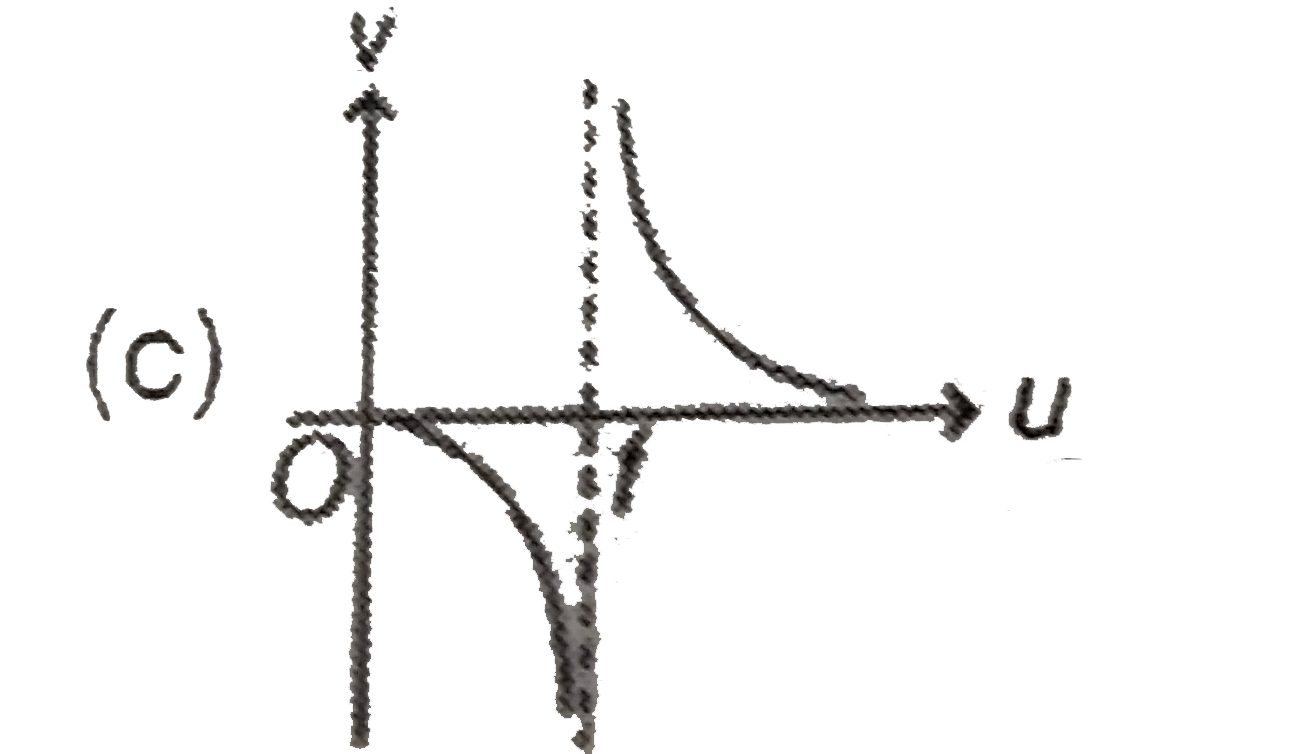
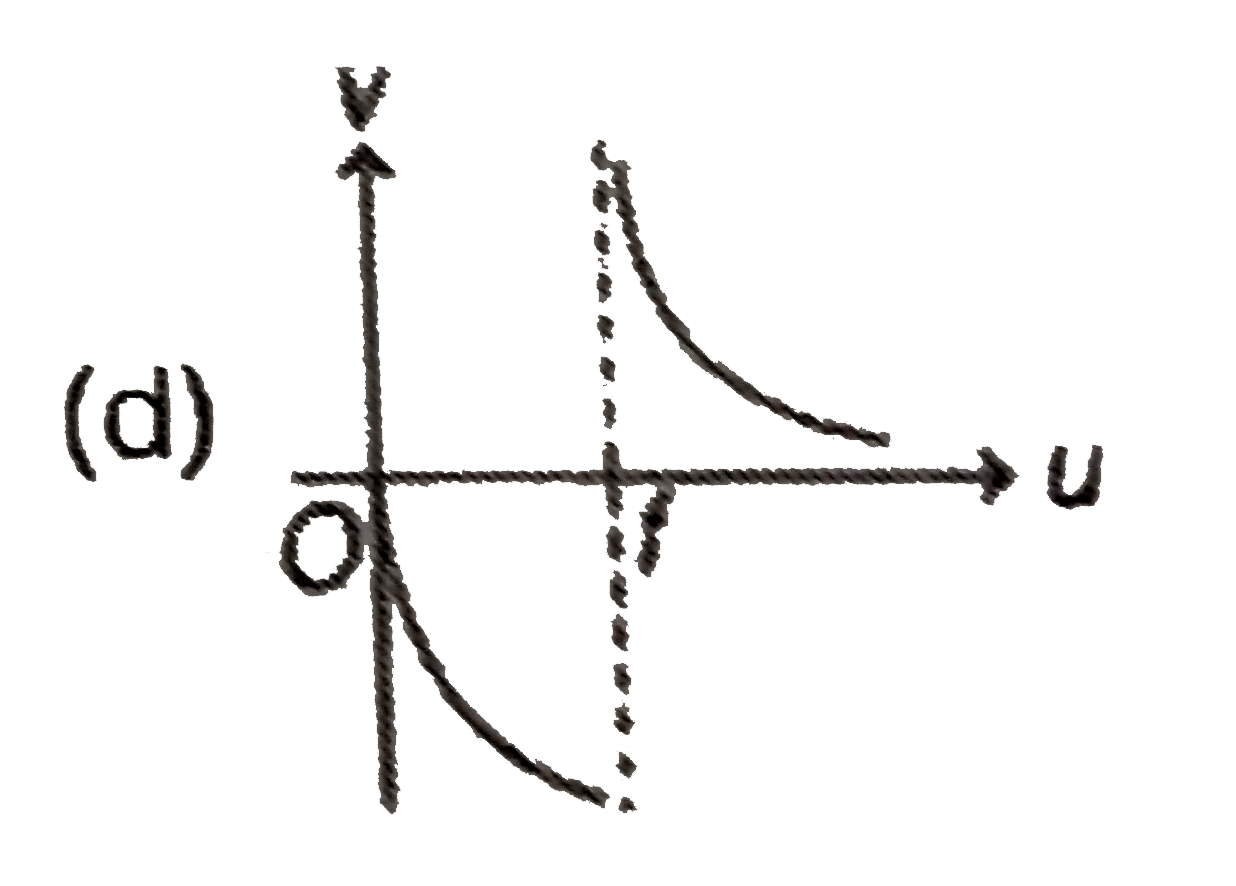
The graph showing correctly the variation of image distance (v) as a function of object distance (u) in case of a concave mirror is


The correct Answer is:A
To solve the problem of determining the correct graph that shows the variation of image distance v as a function of object distance u for a concave mirror, we can follow these steps:
Step 1: Understand the Mirror Formula
The mirror formula for a concave mirror is given by:
1f=1v+1u
Where:
- f is the focal length,
- v is the image distance,
- u is the object distance.
Step 2: Rearrange the Mirror Formula
We can rearrange the mirror formula to express v in terms of u:
1v=1f−1u
This can be rewritten as:
v=fuu−f
Step 3: Analyze the Behavior of v
Now, let's analyze the behavior of v as u changes:
- As u approaches infinity (u→∞):
v→f(the image distance approaches the focal length)
- As u approaches the focal point (u→f):
v→∞(the image distance becomes very large)
- As u approaches zero (u→0):
v→−f(the image distance becomes negative, indicating a virtual image)
Step 4: Sketch the Graph
Based on the analysis:
- The graph should start from negative values (when u is close to 0) and increase towards the focal length f as u increases.
- The graph should show that as u increases from 0 to infinity, v transitions from negative to positive values, eventually approaching f.
Step 5: Identify the Correct Option
From the options provided, we need to identify which graph correctly represents this behavior:
- The correct graph should show that v starts from a negative value (indicating a virtual image) and increases towards f as u increases.
Conclusion
Based on the analysis, the correct option is Option A, which accurately depicts the relationship between v and u for a concave mirror.
---
The mirror formula for a concave mirror is given by:
1f=1v+1u
Where:
- f is the focal length,
- v is the image distance,
- u is the object distance.
We can rearrange the mirror formula to express v in terms of u:
1v=1f−1u
This can be rewritten as:
v=fuu−f
Now, let's analyze the behavior of v as u changes:
- As u approaches infinity (u→∞):
v→f(the image distance approaches the focal length)
- As u approaches the focal point (u→f):
v→∞(the image distance becomes very large)
- As u approaches zero (u→0):
v→−f(the image distance becomes negative, indicating a virtual image)
Based on the analysis:
- The graph should start from negative values (when u is close to 0) and increase towards the focal length f as u increases.
- The graph should show that as u increases from 0 to infinity, v transitions from negative to positive values, eventually approaching f.
From the options provided, we need to identify which graph correctly represents this behavior:
- The correct graph should show that v starts from a negative value (indicating a virtual image) and increases towards f as u increases.
Based on the analysis, the correct option is Option A, which accurately depicts the relationship between v and u for a concave mirror.
Topper's Solved these Questions
- GENERAL PHYSICSBOOK - DC PANDEY ENGLISHCHAPTER - GENERAL PHYSICSEXERCISE - MCQ_TYPE
17 Videos
- GENERAL PHYSICSBOOK - DC PANDEY ENGLISHCHAPTER - GENERAL PHYSICSEXERCISE - MATCH THE COLUMN
6 Videos
- FLUID MECHANICSBOOK - DC PANDEY ENGLISHCHAPTER - FLUID MECHANICSEXERCISE - Medical entranes gallery
49 Videos
- GRAVITATIONBOOK - DC PANDEY ENGLISHCHAPTER - GRAVITATIONEXERCISE - (C) Chapter Exercises
45 Videos
Similar Questions
The minimum distance between the object and its real image for concave mirror is
View SolutionThe graph shown part of variation of v with change in u for a concave mirror. Points plotted above the point P on the curve are for values of v

View SolutionBy drawing a neat diagram show the formation of an image in a concave mirror when the object is between the pole and the principal focus of the mirror. State the characteristics of the image.
View SolutionA particle is moving at a constant speed V from a large distance towards a concave mirror of radius R along its principal axis. Find the speed of the image formed by the mirror as a function of the distance x of the particle from the mirror.
View SolutionWhich of the following graph represents relation between the image position (v) and object position (u) from the concave lens.
View SolutionThe graph between 1v and 1u for a concave mirror looks like.
View SolutionThe graph between 1v and 1u for a concave mirror looks like.
View SolutionThe minimum sum of the distances of a real object and a real image from a concave mirror of radius of curvature 20cm is:
View SolutionA convex mirror offocal length fforms an image which is 1/n times the object. The distance of the object from the mirror is:
View SolutionWhen an object is placed at a distance of 40 cm from a concave mirror, the size of image is one fourth that of the object. A. Calculate the distance of image from the mirror b. What will be the focal length of the mirror?
View Solution
