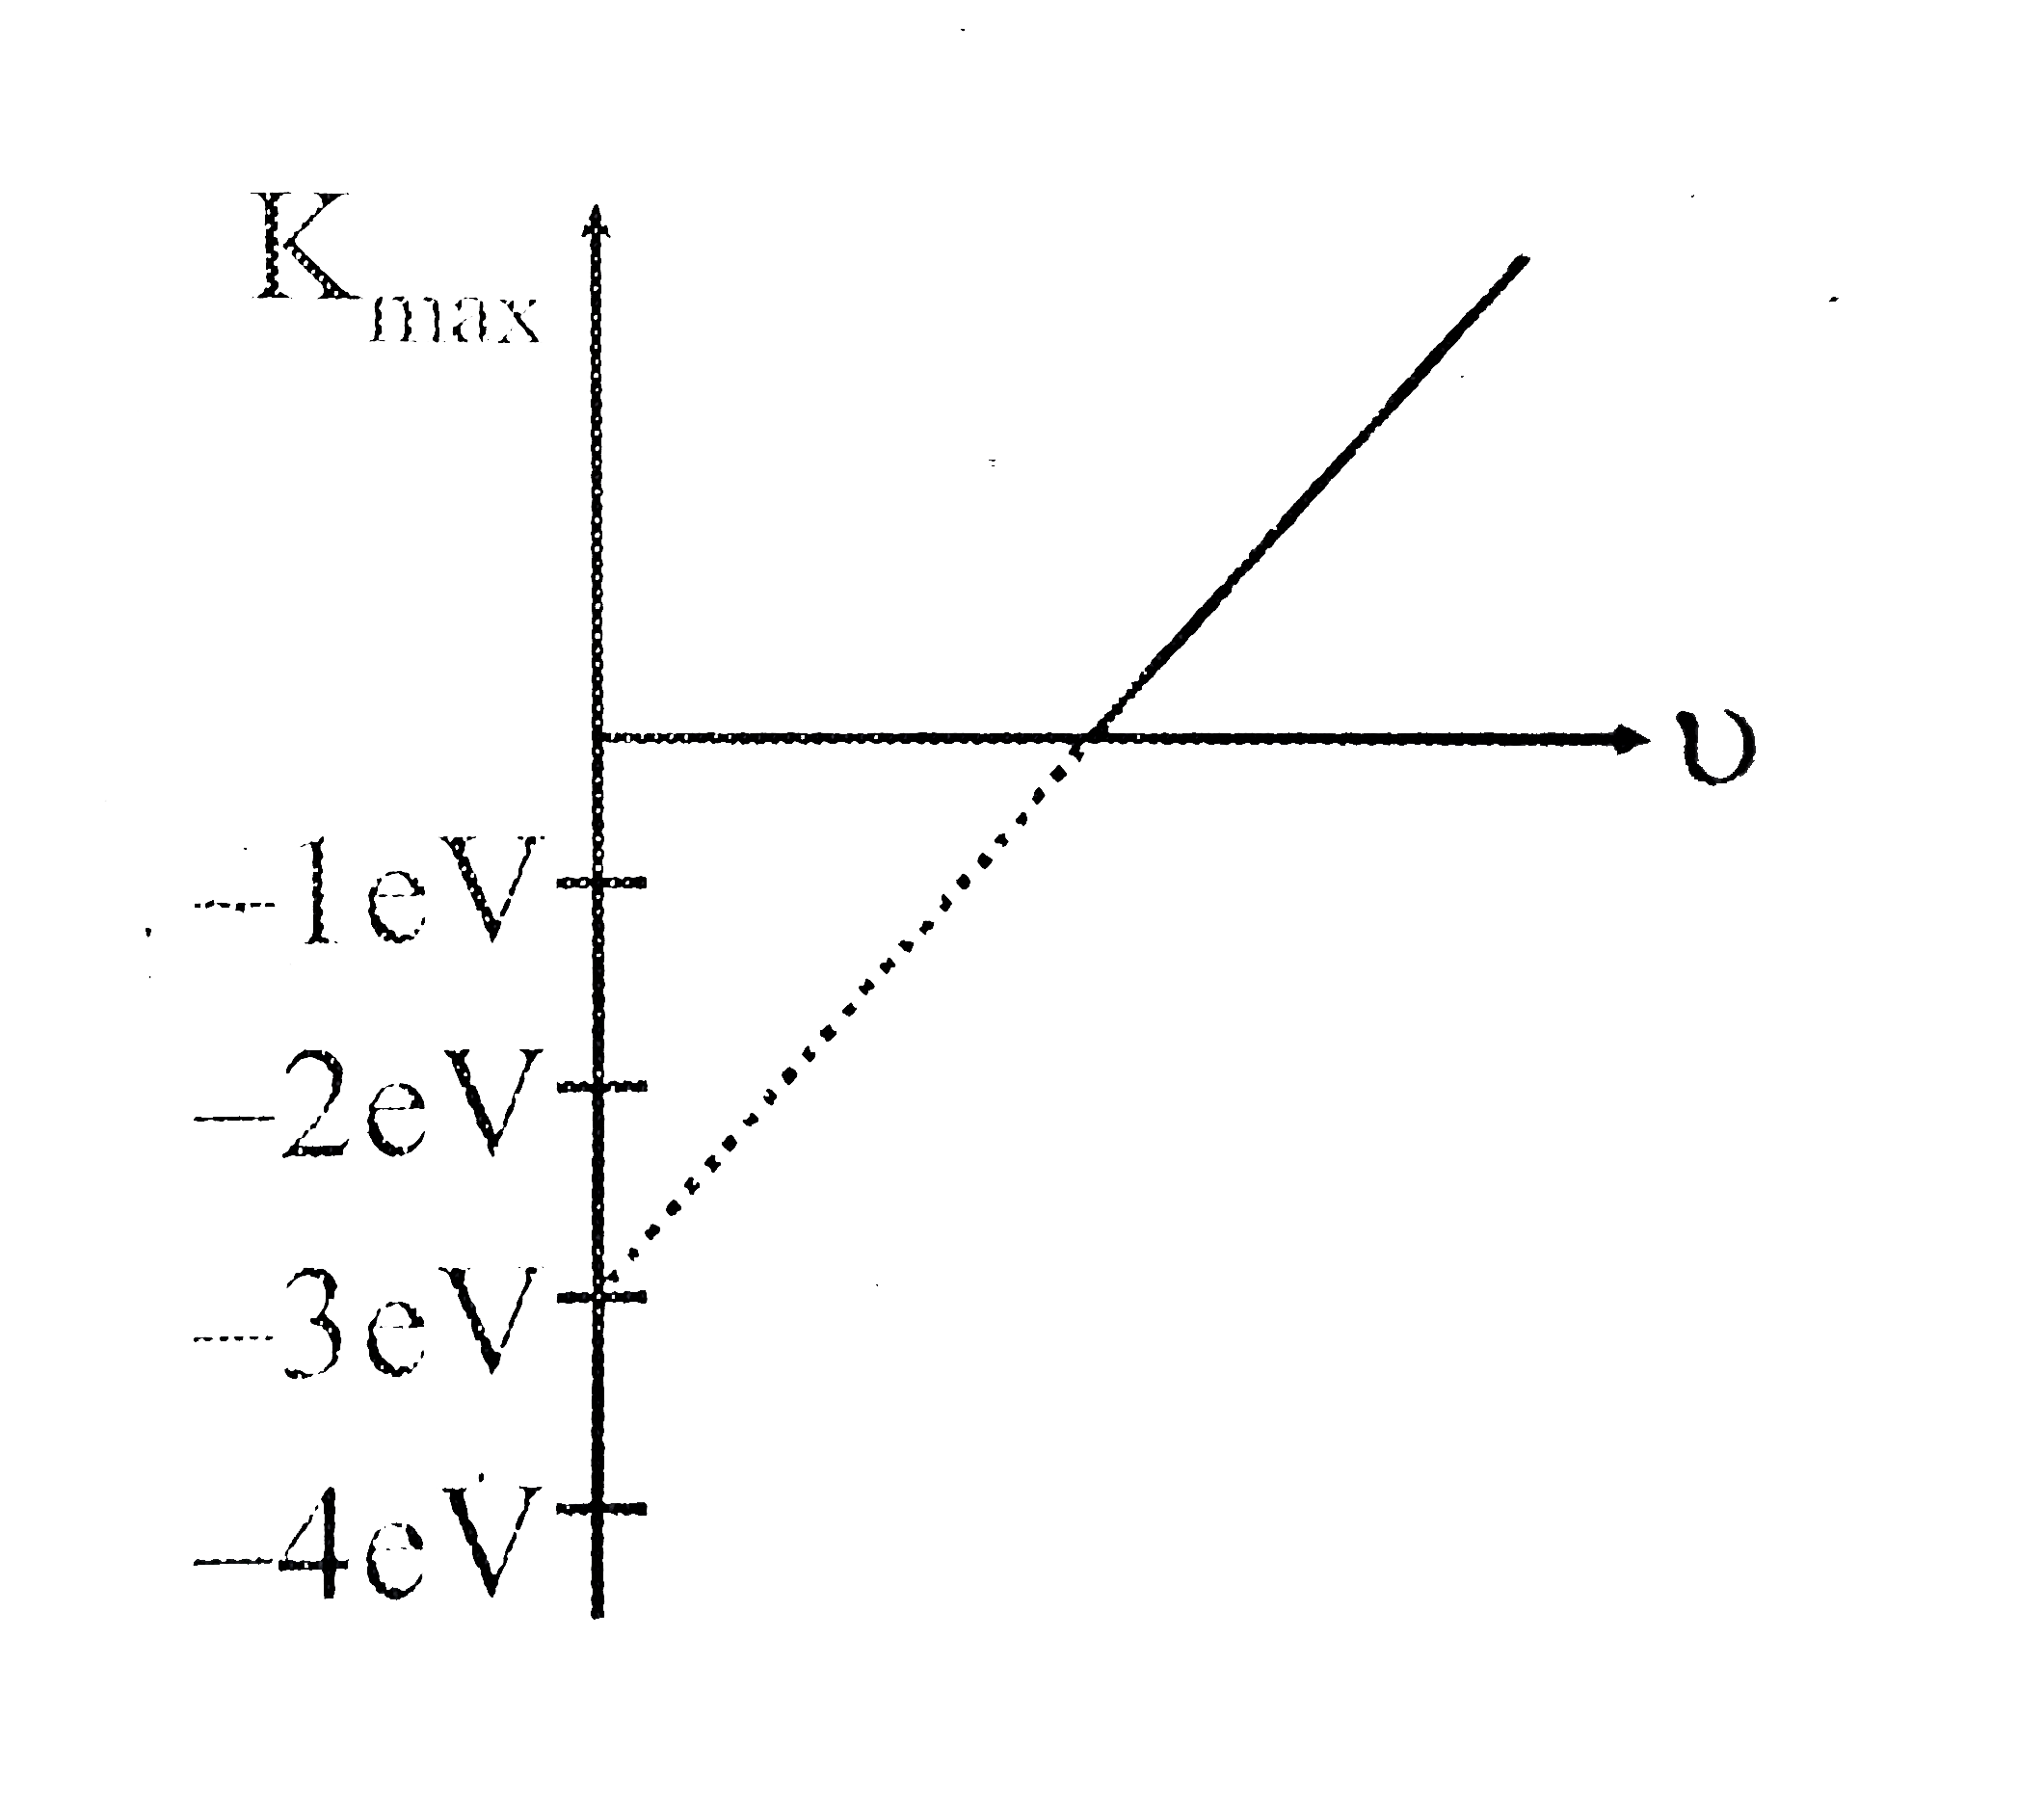
For a photoelectric experiment graph between kinetic energy of fastest electron and frequency of light is plotted find threshold wavelength of metal.
4133Å
5313Å
5424Å
5123Å
The correct Answer is:A
Step by step video & image solution for For a photoelectric experiment graph between kinetic energy of fastest electron and frequency of light is plotted find threshold wavelength of metal. by Physics experts to help you in doubts & scoring excellent marks in Class 12 exams.
Updated on:21/07/2023Topper's Solved these Questions
Similar Questions
According to Einstein's photoelectric equation, the graph between kinetic energy of photoelectrons ejected and the frequency of the incident radiation is :
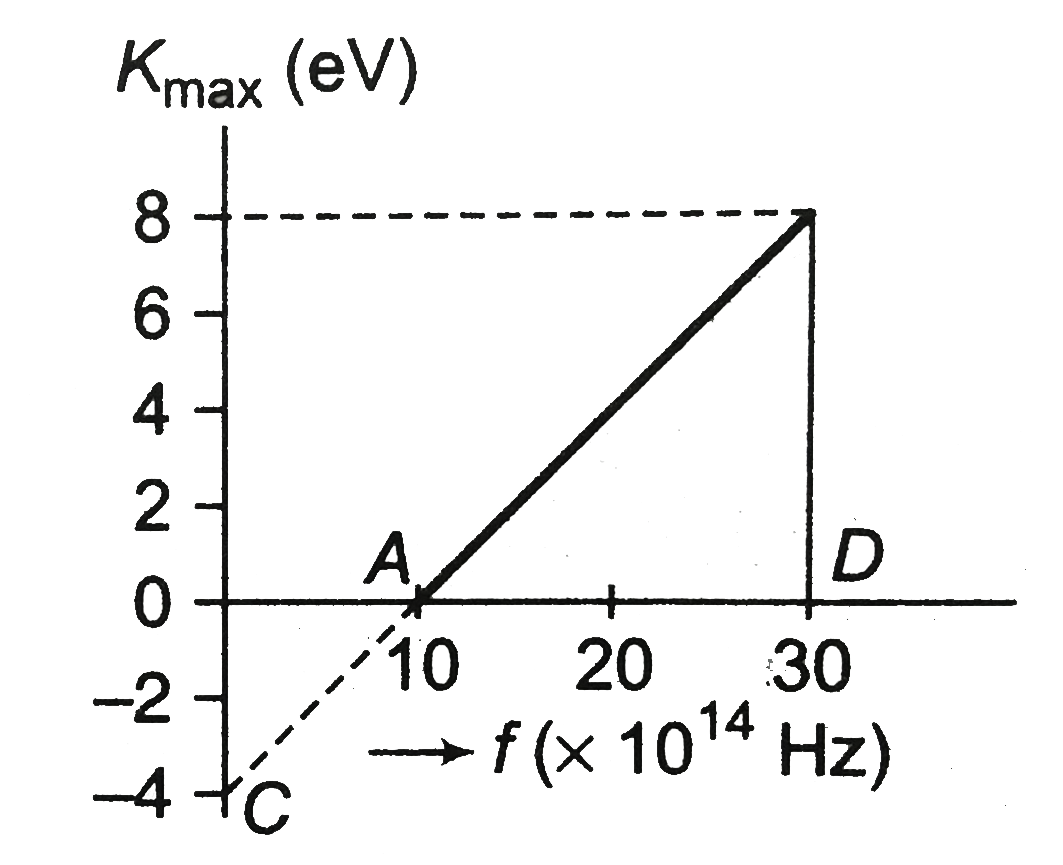
View SolutionA graph regarding photoelectric effect is shown between the maximum kinetic energy of electrons and the frequency of the incident light. On the basis of data as shown in the graph, calculate (a) threshold frequency , (b) work- function, (c ) planck constant
View Solution
Knowledge Check
According to Einstein's photoelectric equation , the graph between the kinetic energy of photoelectrons ejected and the frequency of incident radiation is
A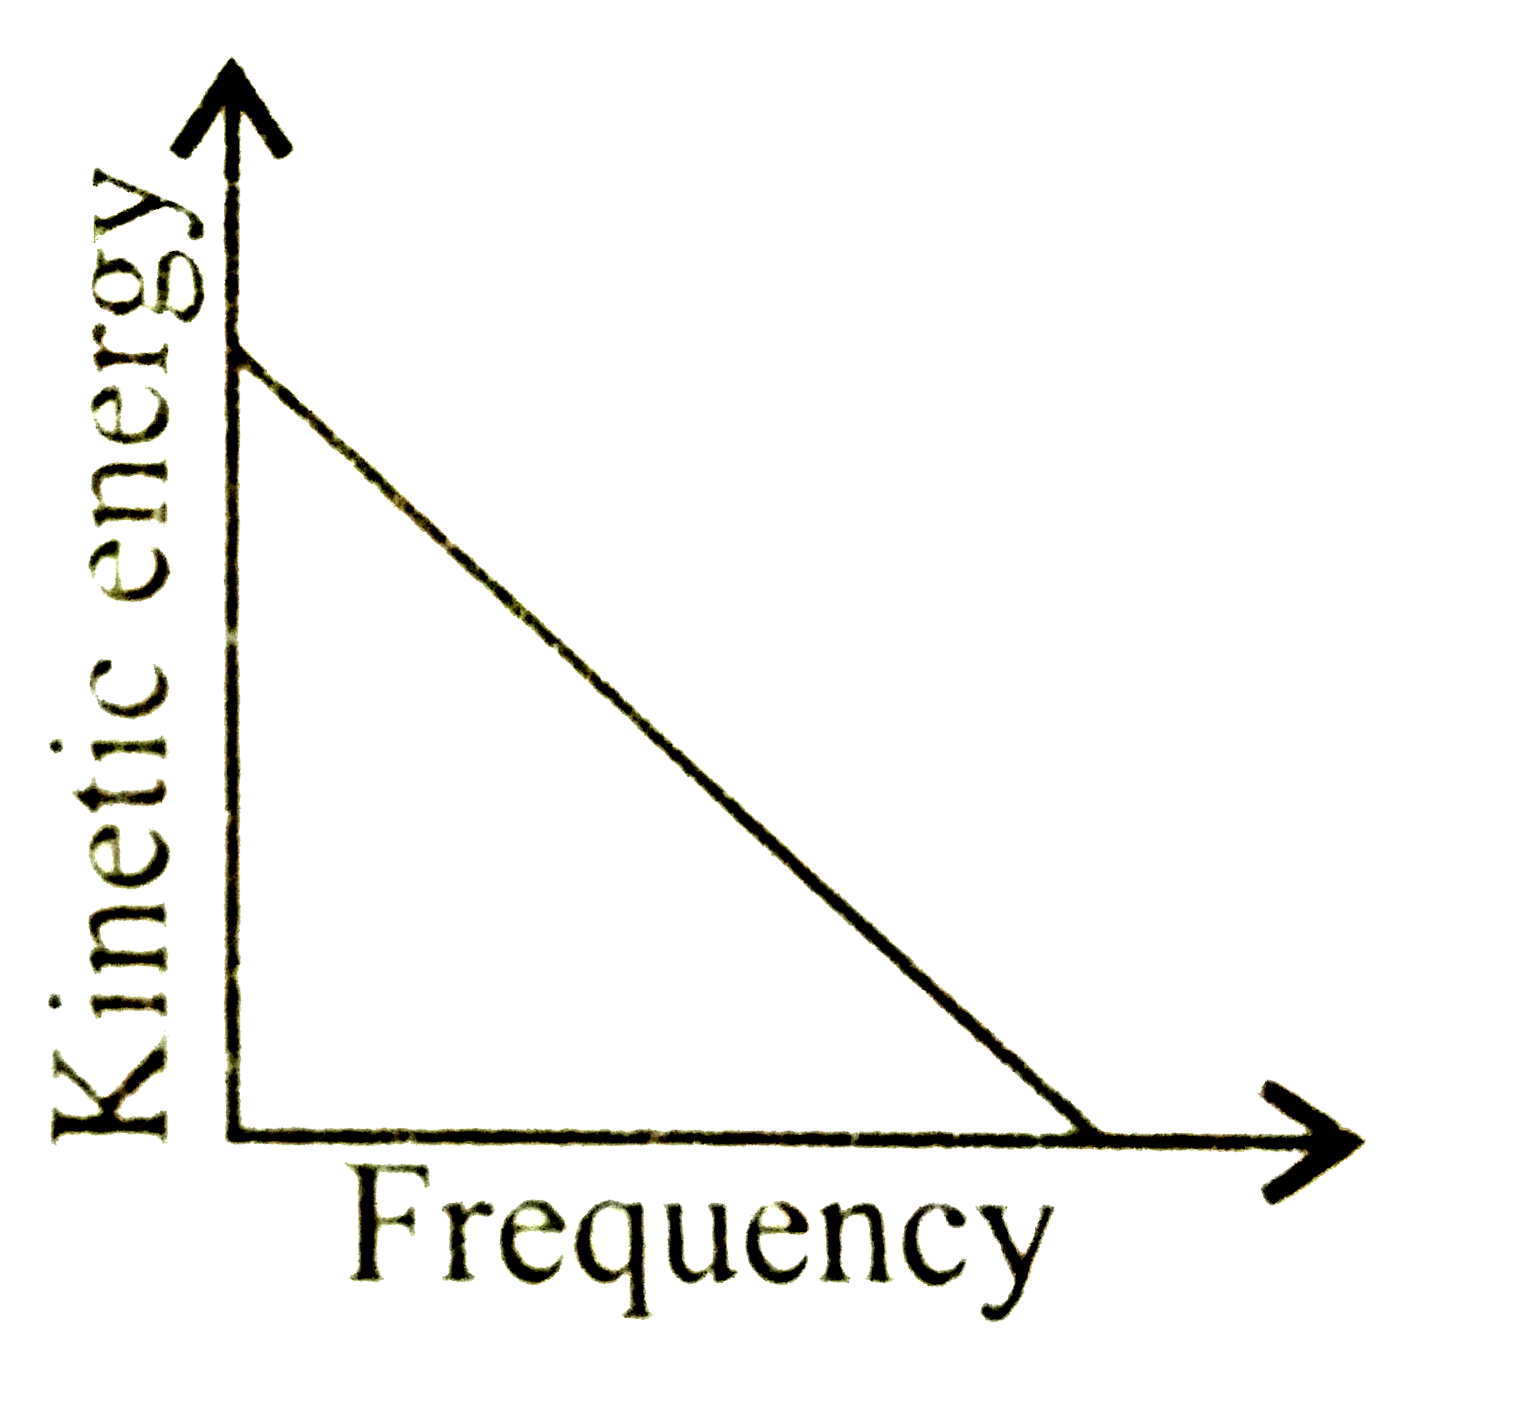 B
B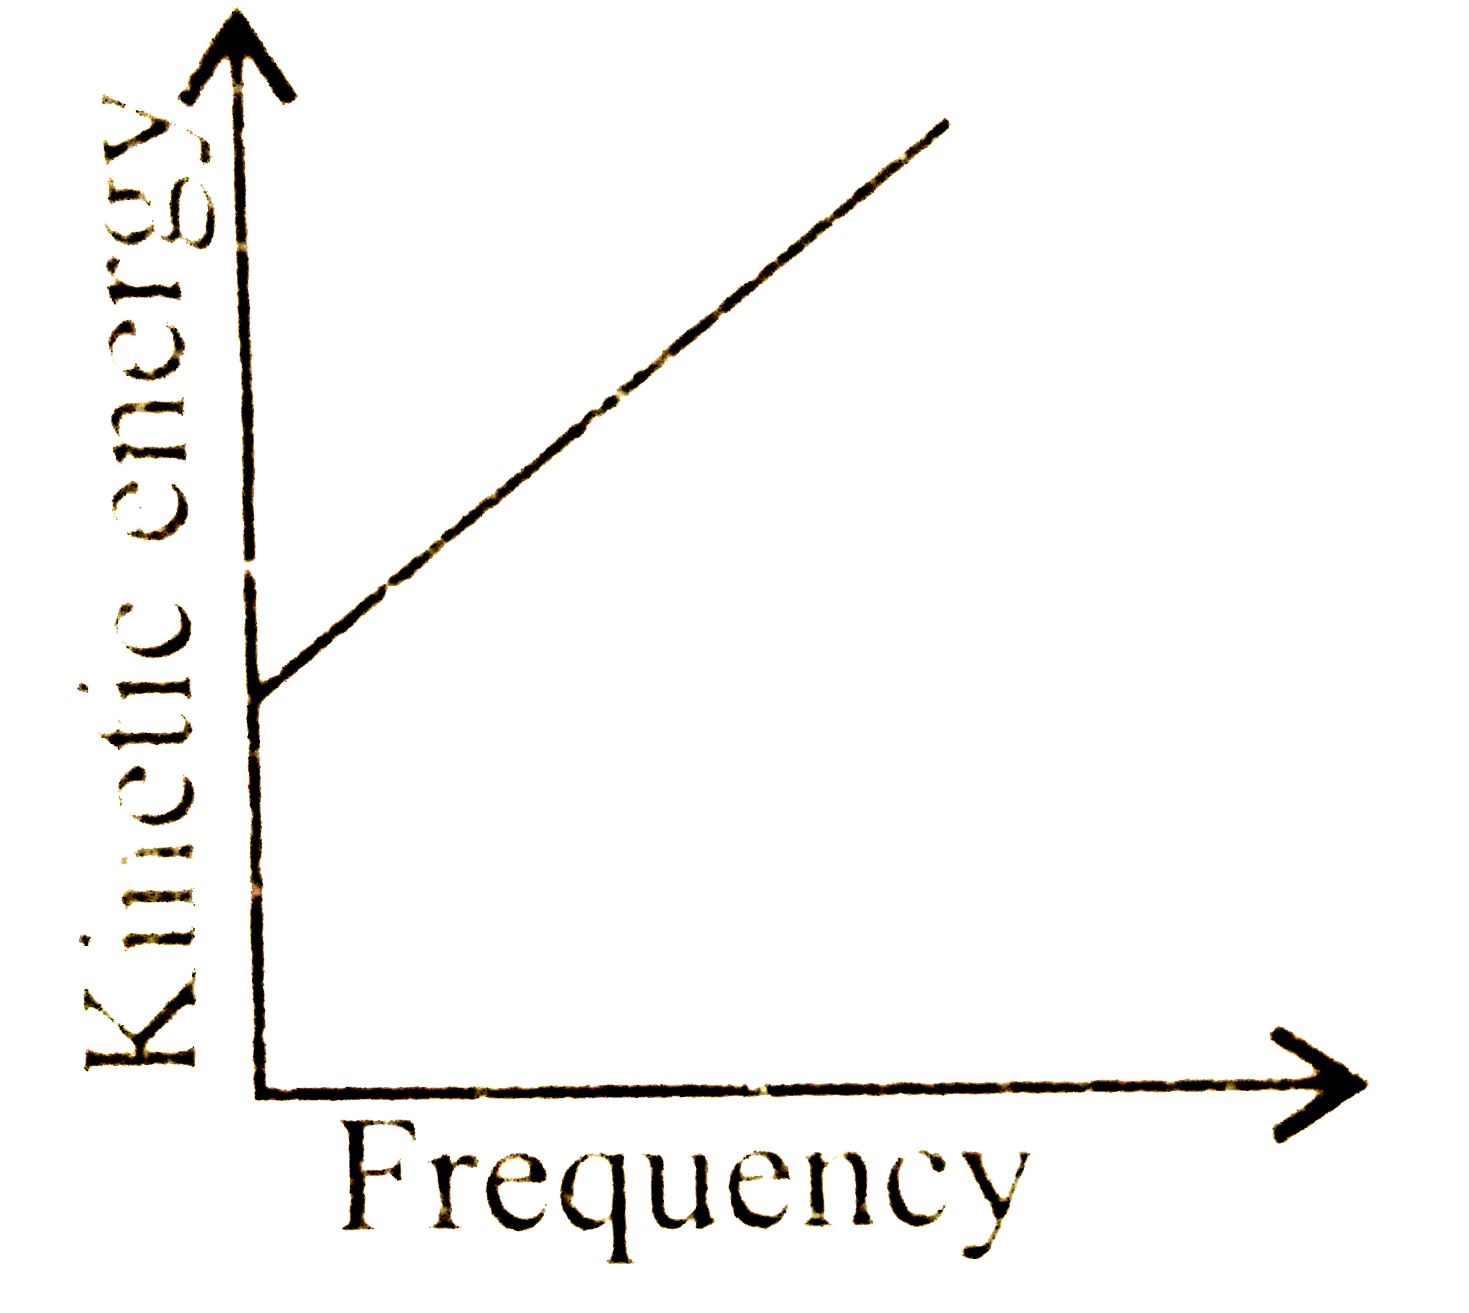 C
C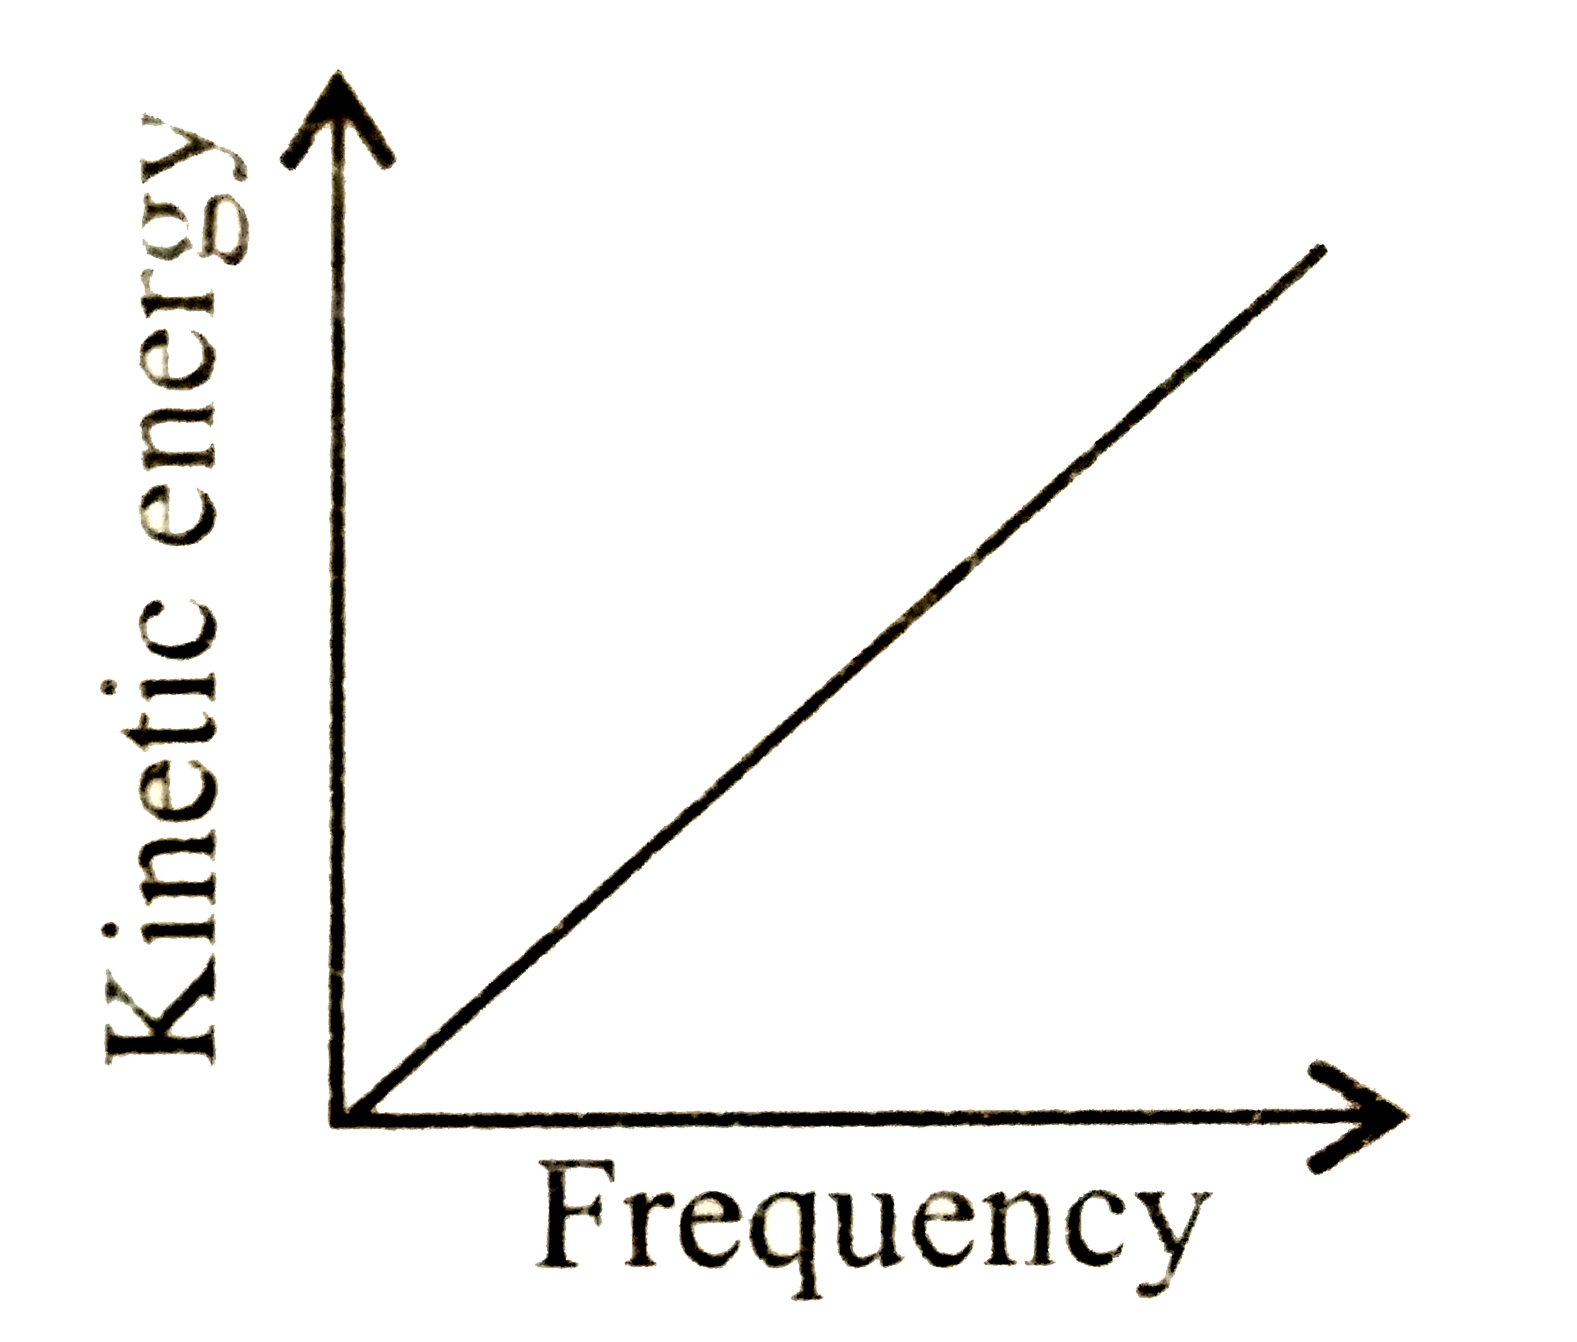 D
D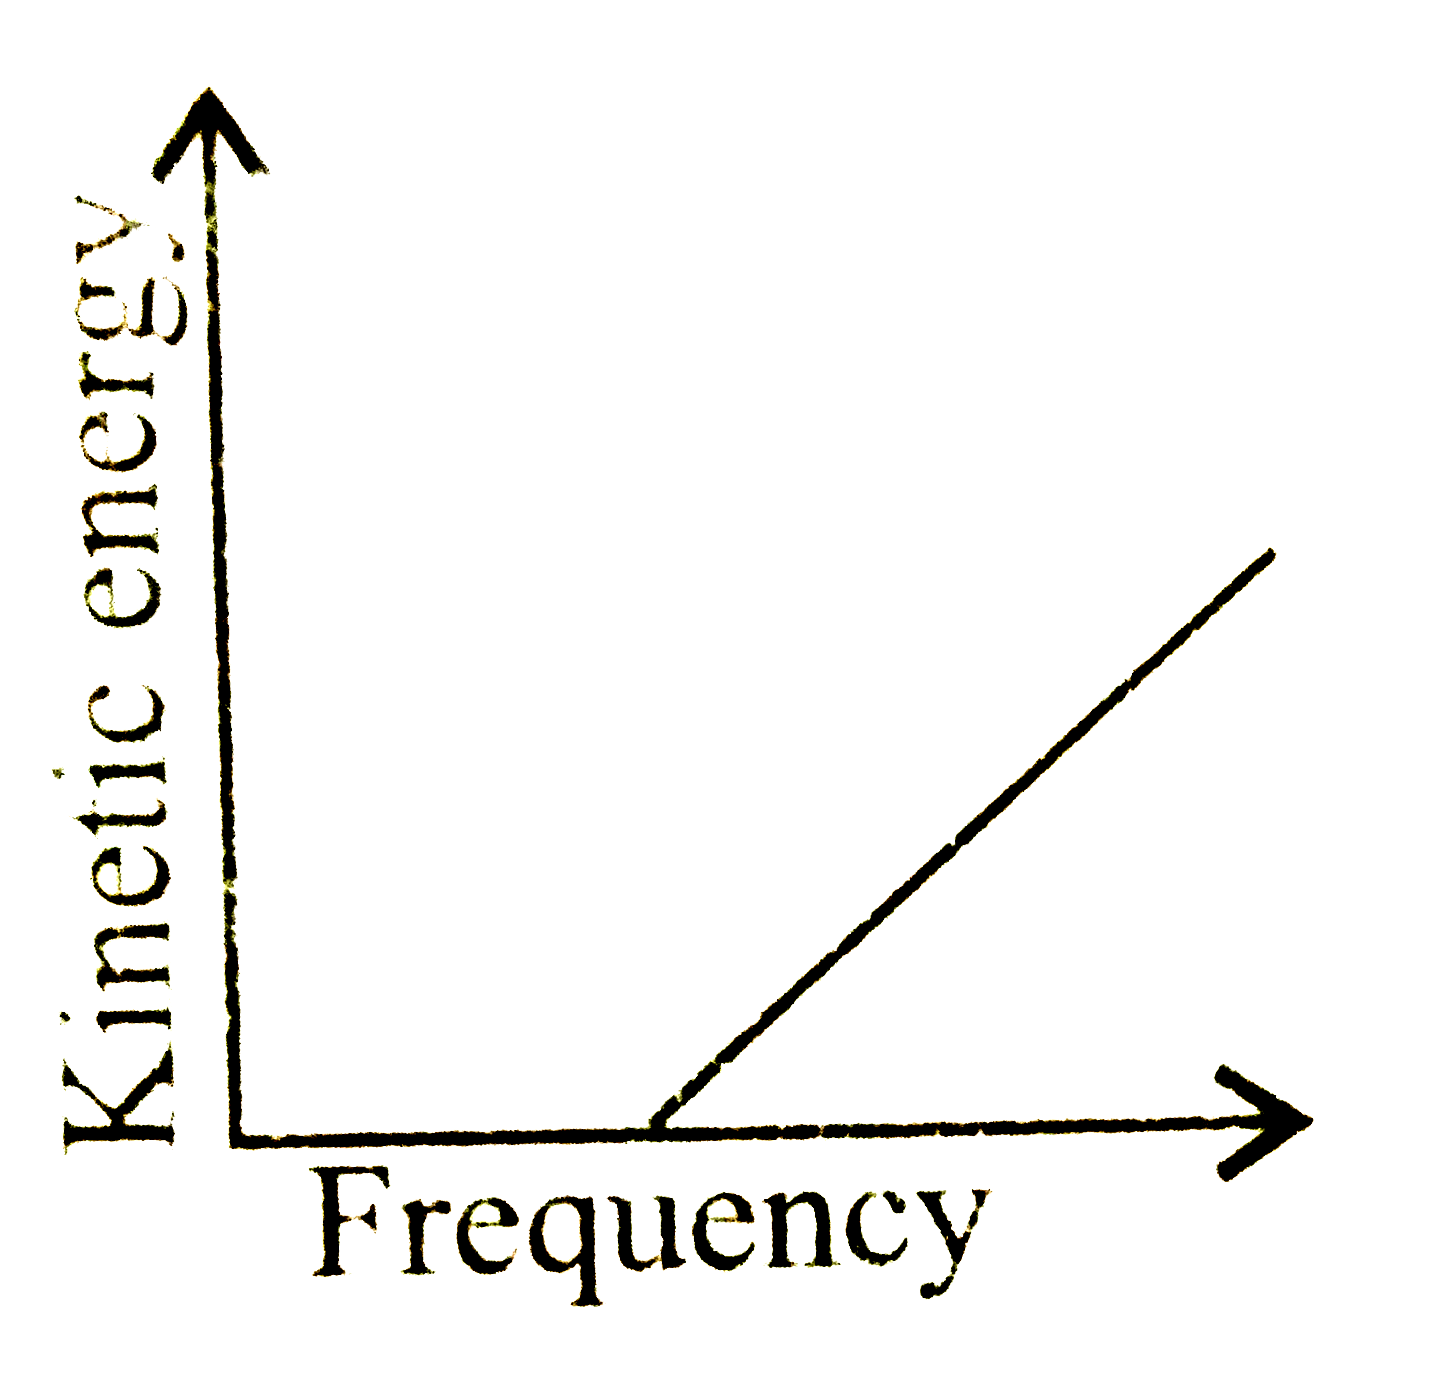
In a photoelectric experiment, if both the intensity and frequency of the incident light are doubled, then the saturation photoelectric current
Aremains constantBis halvedCis doubledDbecomes four times
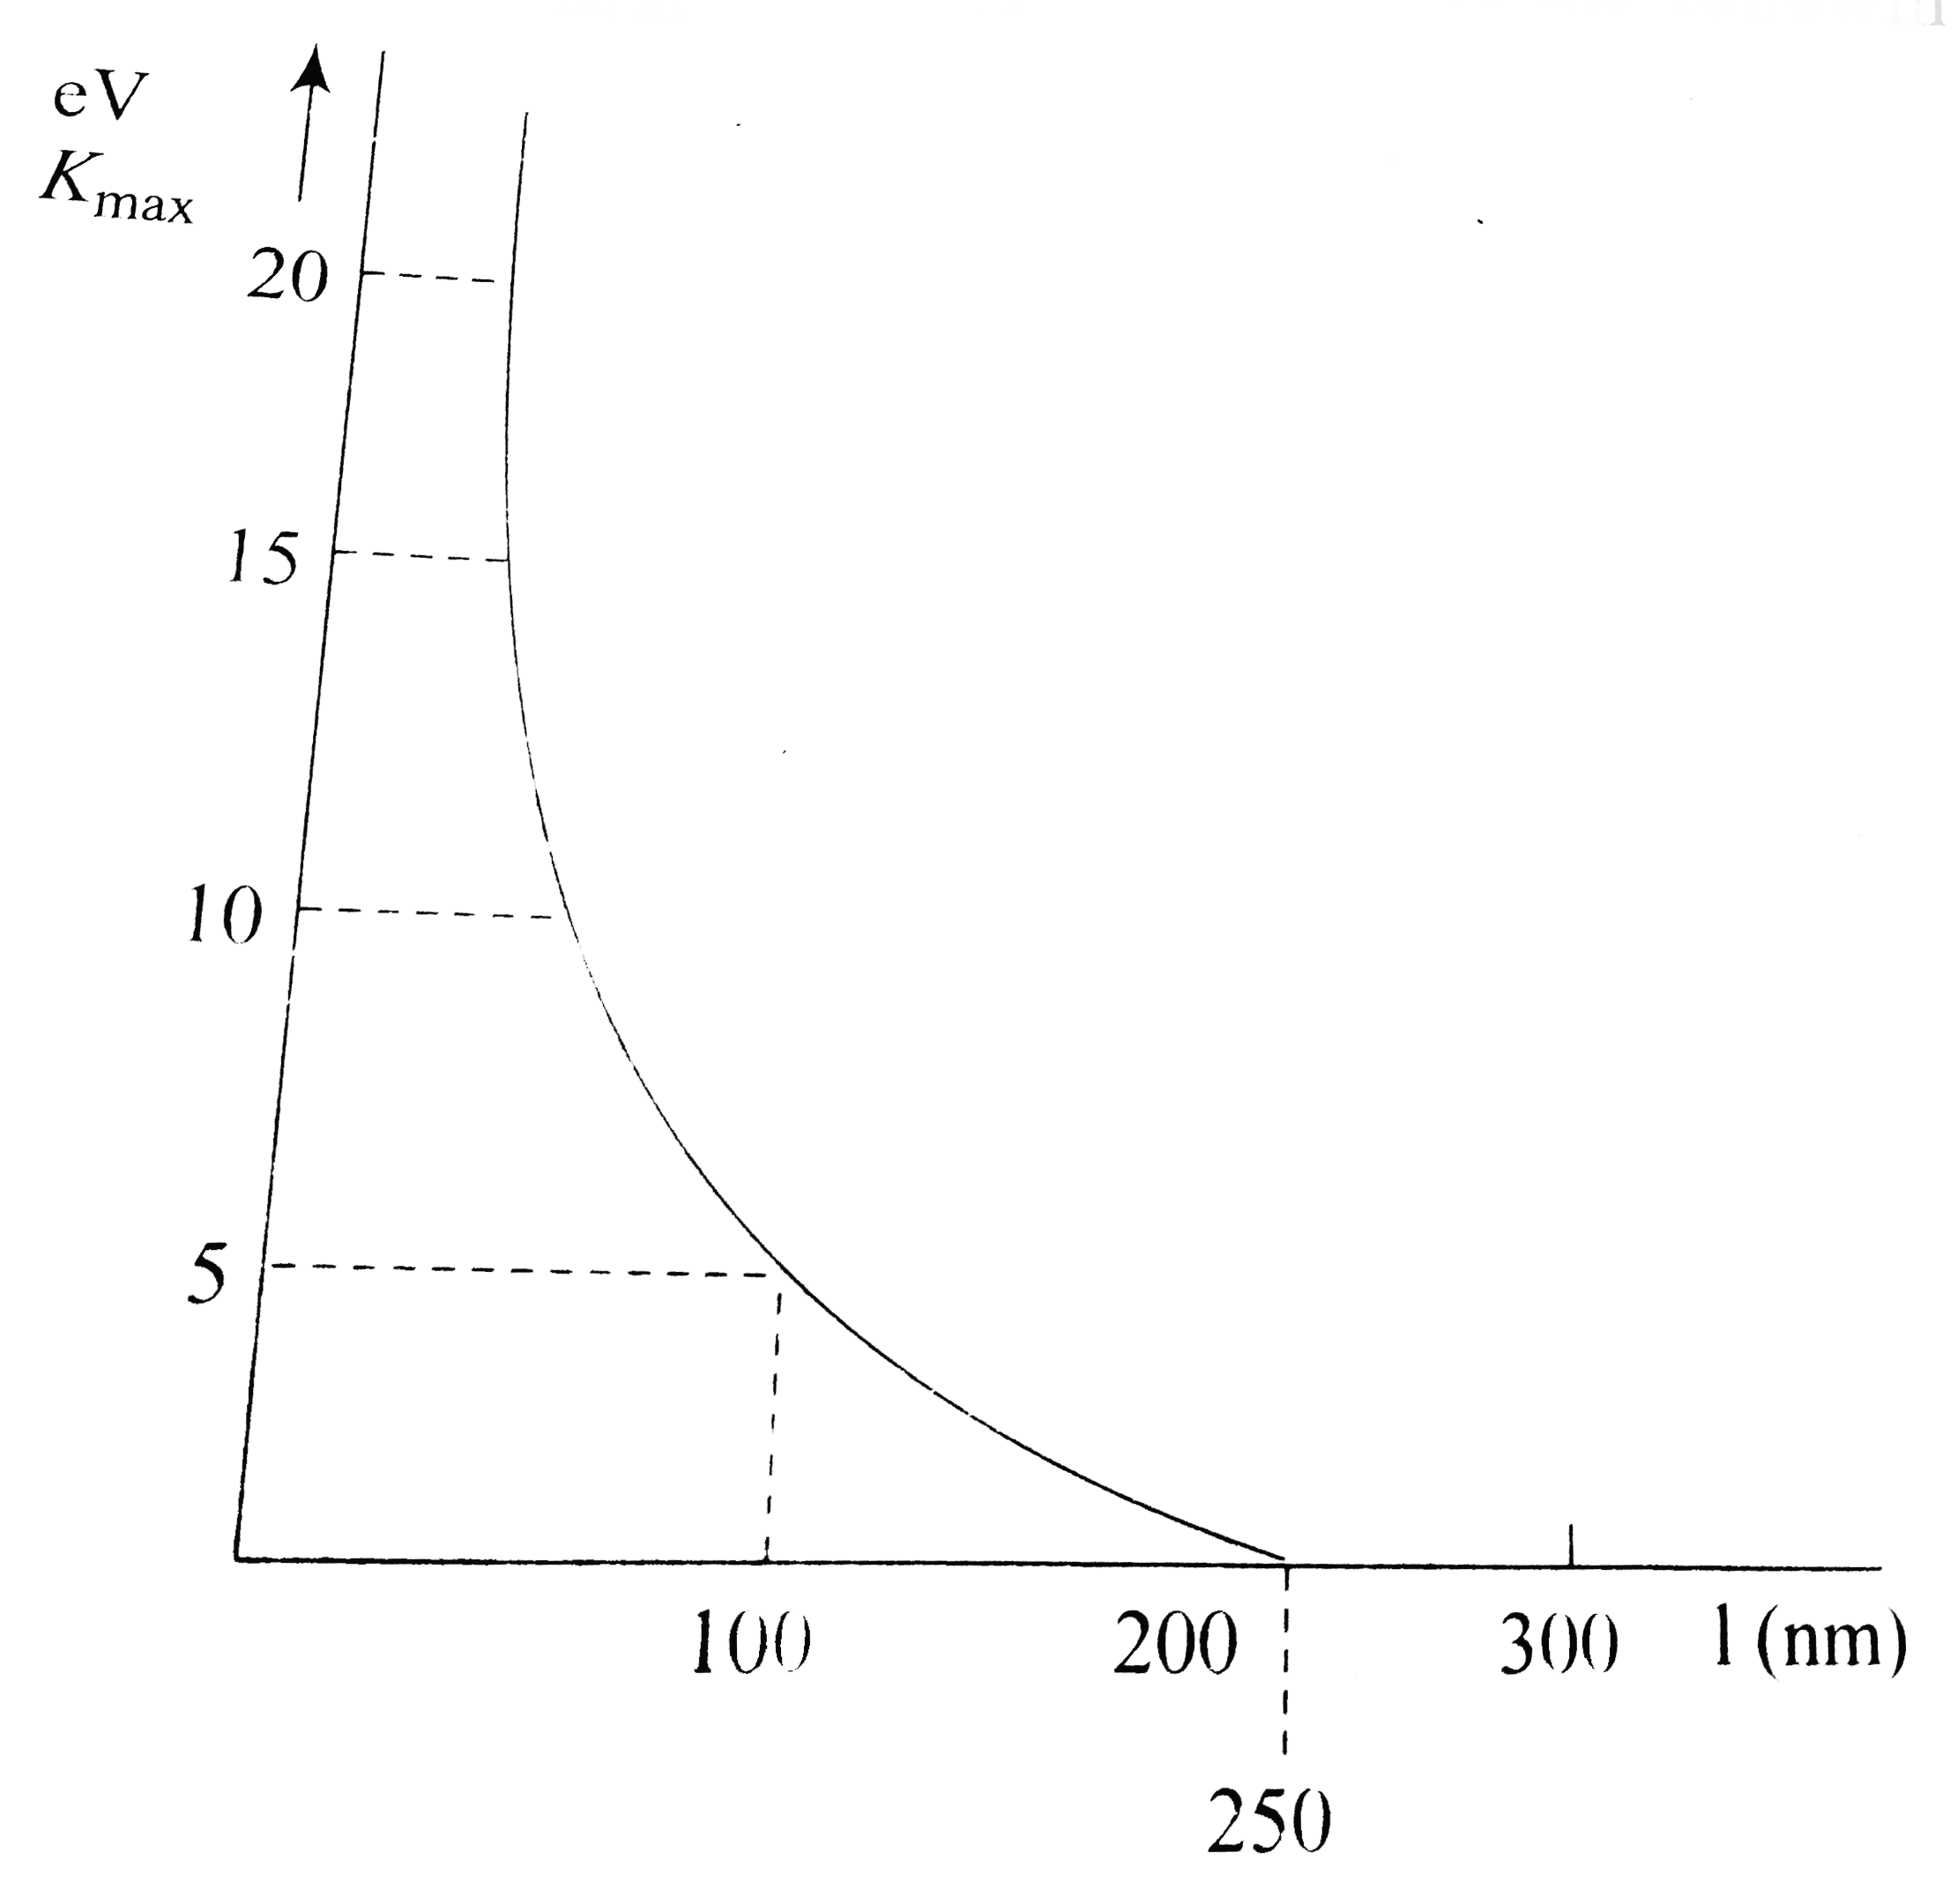
In a photoelectric effect experiment , the maximum kinetic energy of the ejected photoelectrons is measured for various wavelength of the incident light. Figure shows a graph of this maximum kinetic energy Kmax as a function of the wavelength λ of the light falling on the surface of the metal. Which of the following statement/i is/ are correct?
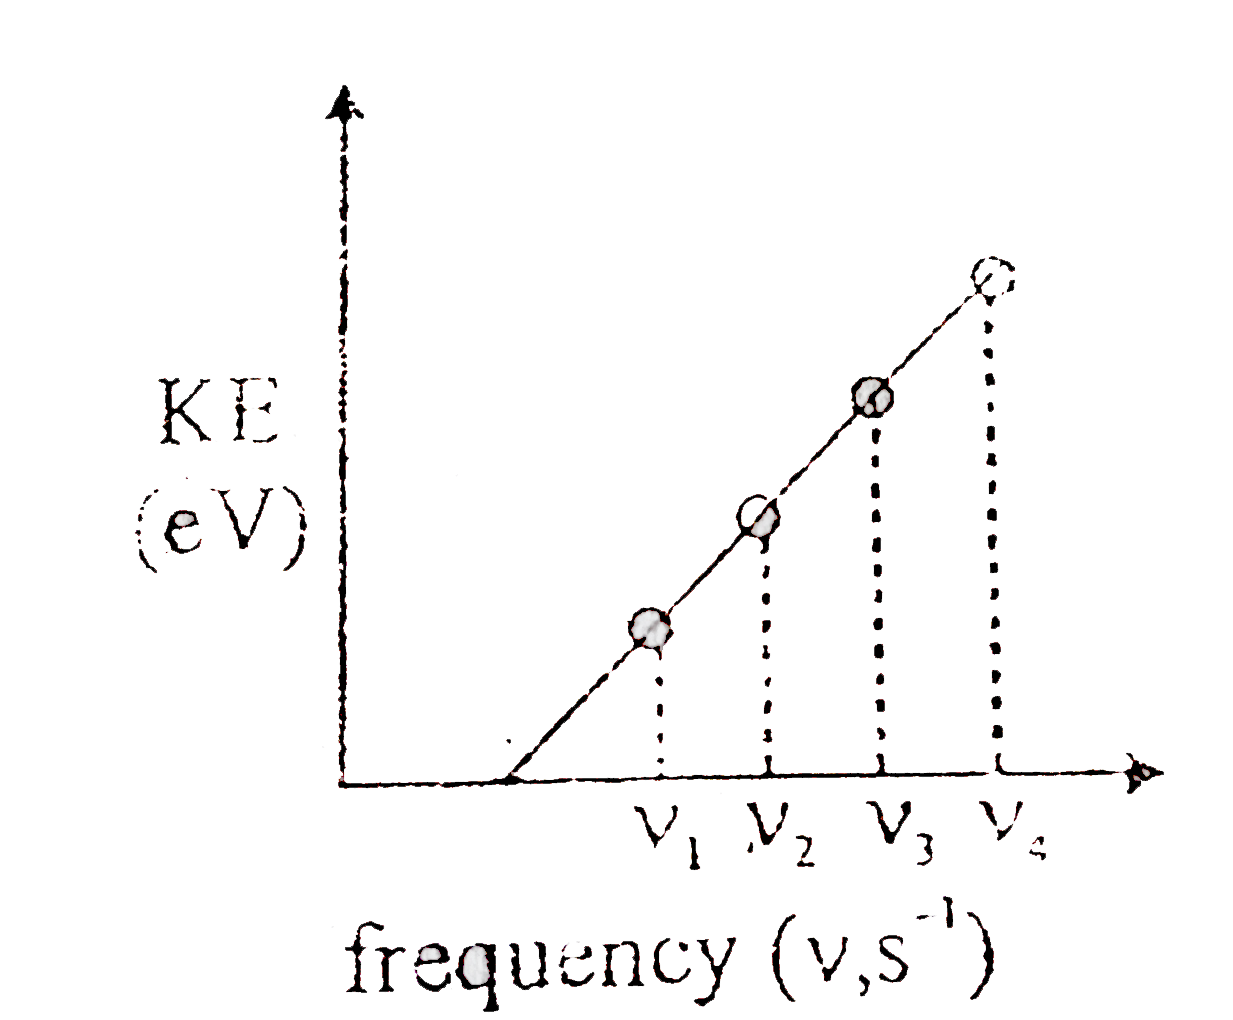
View SolutionIn a photoelectric experiment, kinetic energy of photoelectrons was plotted against the frequency of incident radition (v), as show in figure. Which of the following statements is correct ?
View SolutionIn an experiment of photo-electric effect, the graph of maximum kinetic energy Ek of the emitted photoelectrons versus the frequency v of the incident light is a straight line AB as shown in figure below :
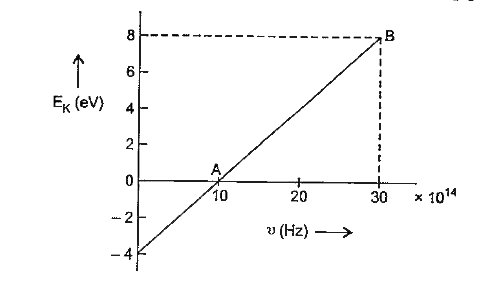
Threshold frequency of the metal.
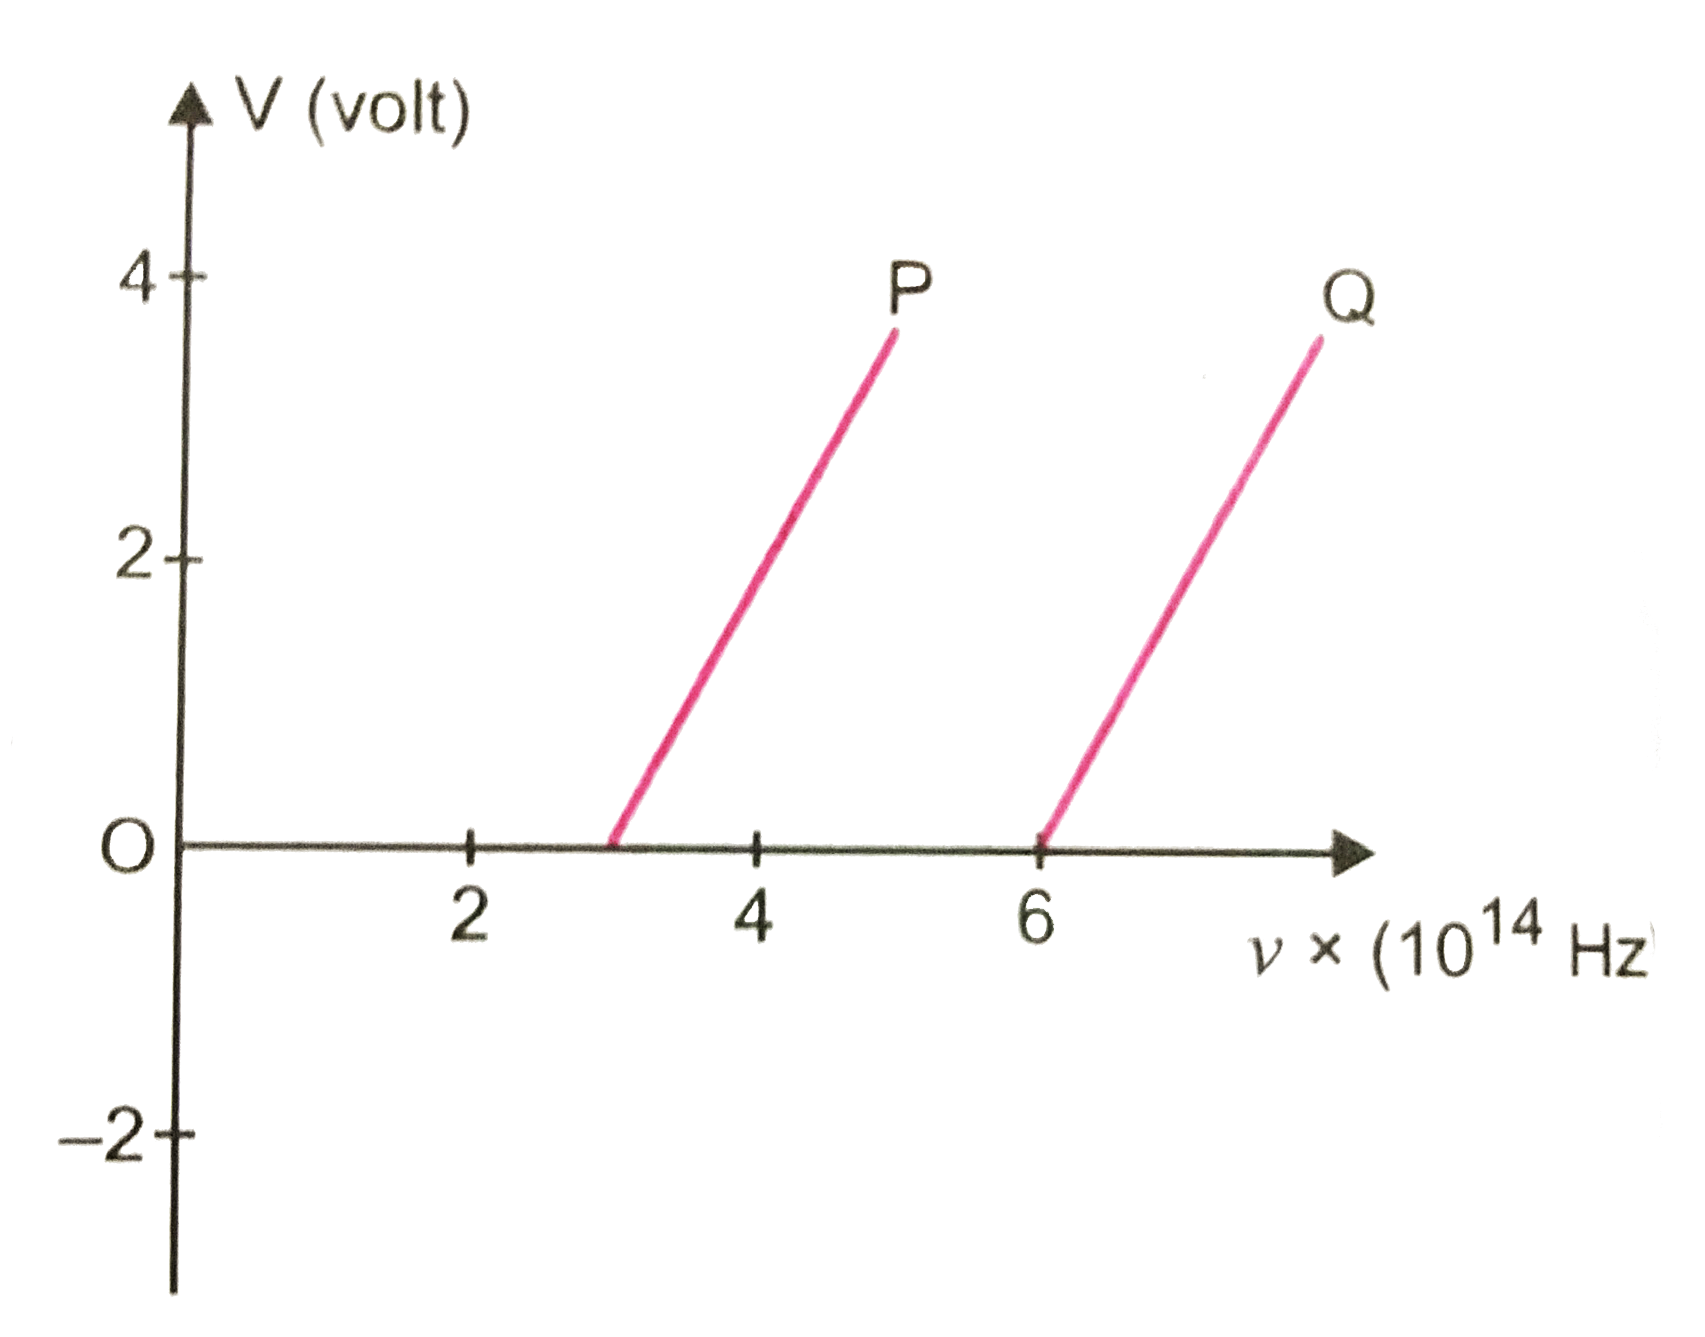
View SolutionIn the study of a photoelectric effect the graph between the stopping potential V and frequency ν of the incident radiation on two different metals P and Q is shown in fig.
(i) which one of two metals have higher threshold frequency
(ii) Determine the work function of the metal which has greater value
(iii) Find the maximum kinetic energy of electron emitted by light of frequency 8×10¹⁴Hz for this metal.
View SolutionIn an experiment of photoelectric effect, the graph of maximum kinetic energy EK of the emitted photoelectrons versus the frequency v of the incident light is a straight line AB as shown in Figure below:
Find : (i) Threshold frequency of the metal.
(ii) work function of the metal
(iii) Stopping potential for the photoelectrons emitted by the light of frequency v=30×1014 Hz.
View SolutionIn Searl's experiment a graph is plotted between
View Solution
