Comprehension # 6
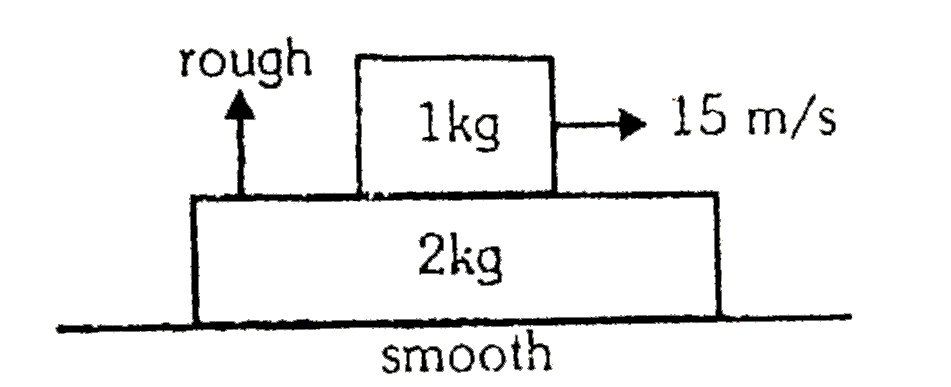
A 1kg block is given a velocity of 15m/s towards right over a very long rough plank of mass 2kg as shown in figure.
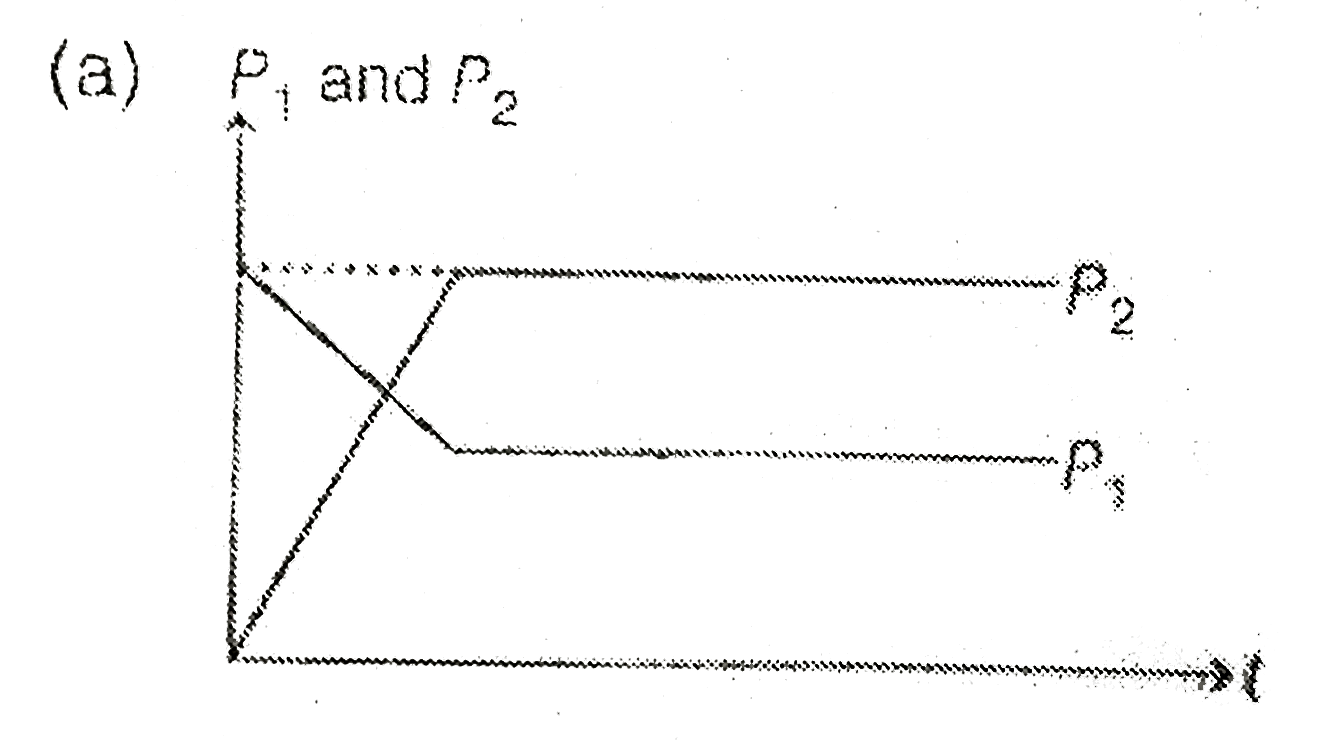
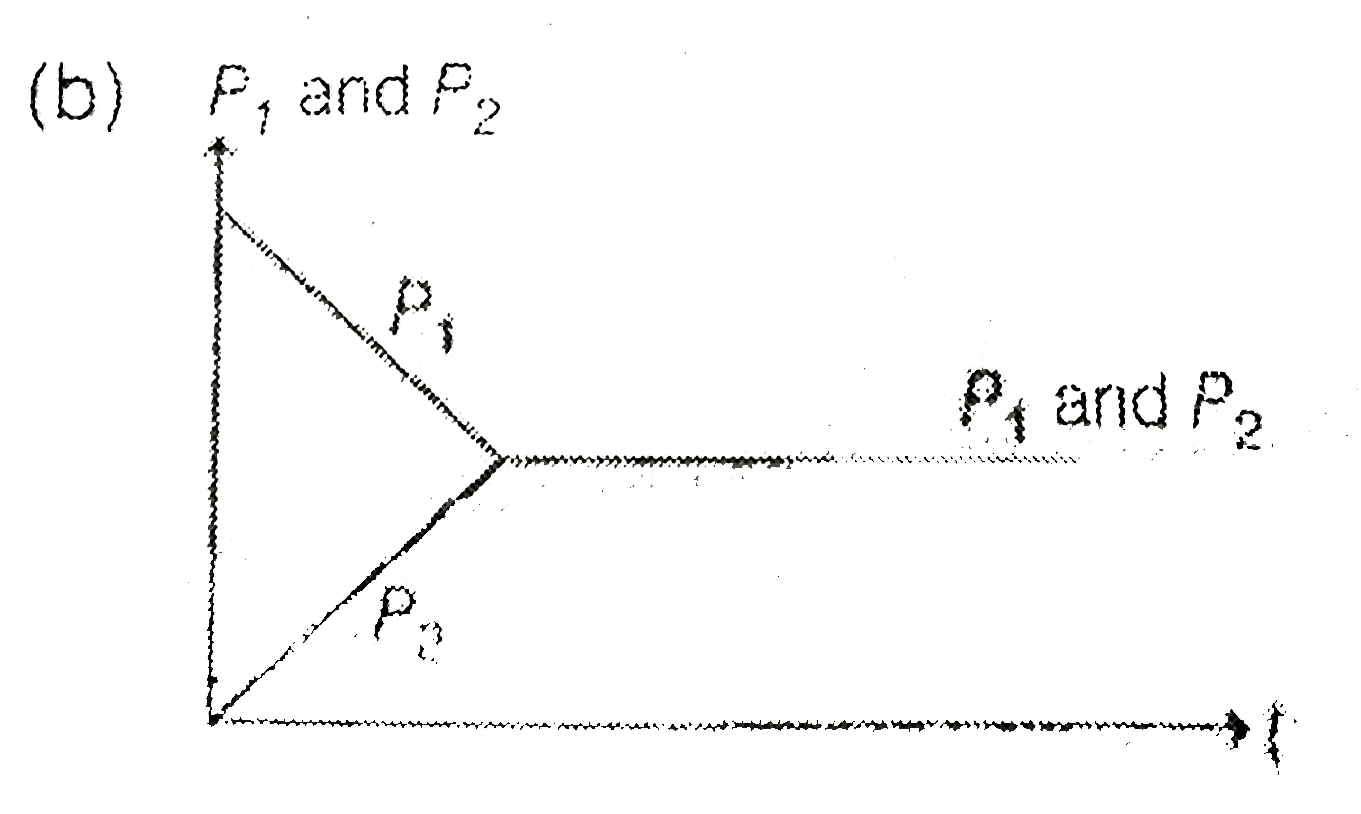
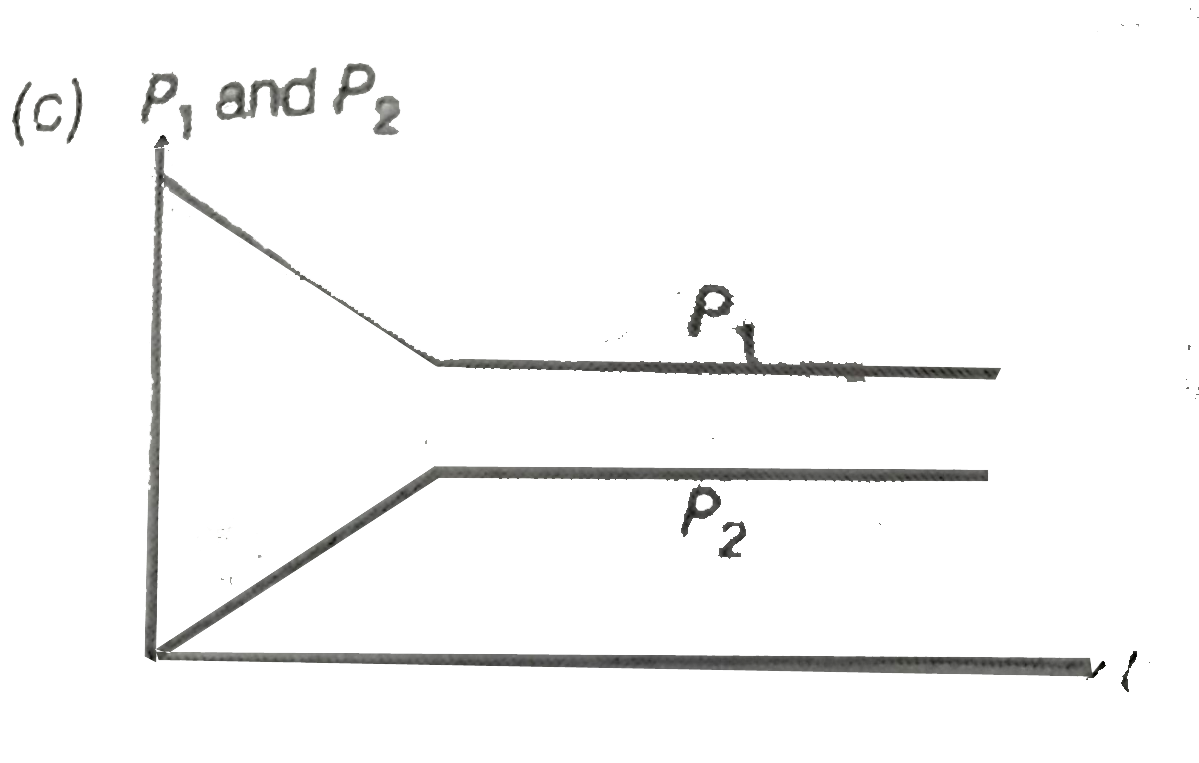
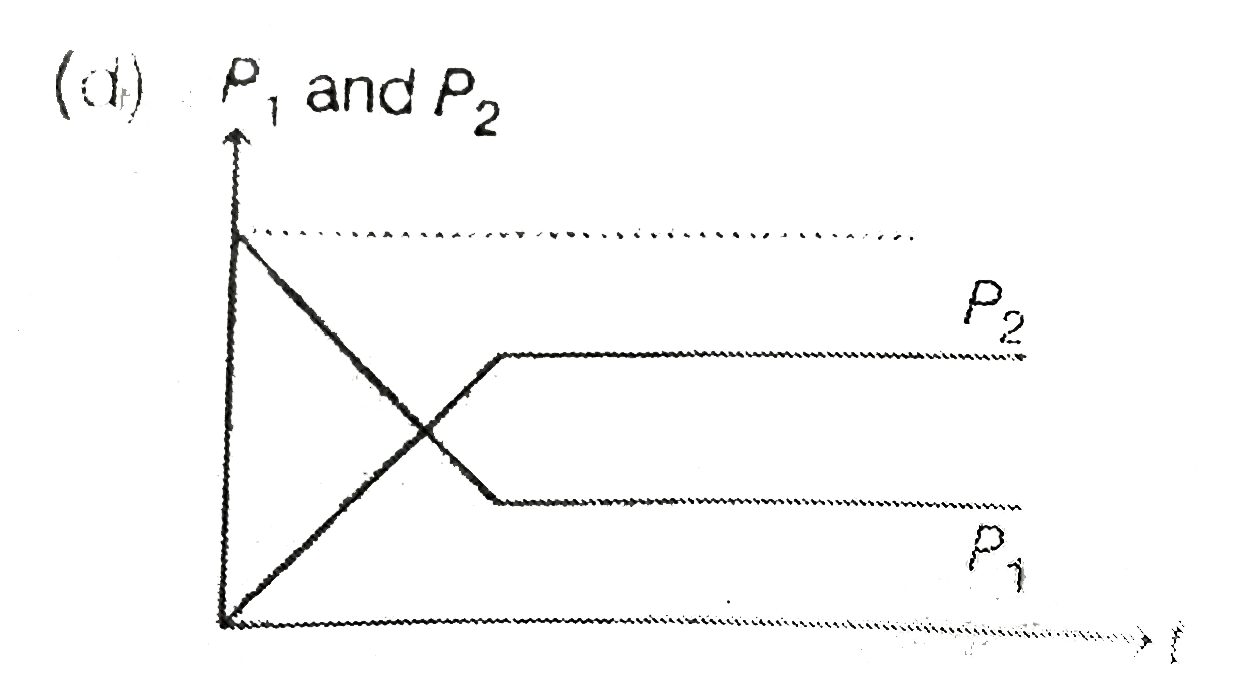
The correct graph showing linear momentum of 1kg (i.e. p1 ) and of 2kg (i.e. p2 ) versus time is :
To solve the problem, we need to analyze the motion of the two blocks and their respective momenta over time. Here's a step-by-step breakdown:
Step 1: Understand the Initial Conditions
- We have a 1 kg block moving with an initial velocity of 15 m/s towards the right.
- The 2 kg block is initially at rest.
Step 2: Identify the Forces Acting on the Blocks
- The 1 kg block experiences a frictional force acting to the left (opposite to its motion).
- The 2 kg block will start moving to the right due to the frictional force exerted by the 1 kg block.
Step 3: Calculate the Frictional Force
- The frictional force can be expressed as Ff=μN, where N is the normal force.
- For the 1 kg block, N=mg=1×g (where g is the acceleration due to gravity).
- Thus, the frictional force acting on the 1 kg block is Ff=μ×1×g.
Step 4: Analyze the Motion Over Time
- Initially, the momentum of the 1 kg block (p1) is p1=m1⋅v1=1⋅15=15kg m/s.
- The momentum of the 2 kg block (p2) is p2=0 since it is at rest.
Step 5: Conservation of Momentum
- When both blocks start moving together, we can apply the conservation of momentum:
m1u1+m2u2=m1v1+m2v2
where u2=0 (initial velocity of the 2 kg block).
- Plugging in the values:
1⋅15+2⋅0=1⋅v+2⋅v
15=3v⟹v=5m/s
Step 6: Calculate Final Momentums
- After some time, when both blocks are moving together:
- The momentum of the 1 kg block becomes p′1=1⋅5=5kg m/s.
- The momentum of the 2 kg block becomes p′2=2⋅5=10kg m/s.
Step 7: Plot the Graphs
- Initially, p1=15 and p2=0.
- After some time, p′1=5 and p′2=10.
- The graph should show p1 decreasing from 15 to 5 and p2 increasing from 0 to 10.
Step 8: Identify the Correct Graph
- Based on the analysis, we need a graph where:
- p1 starts at 15 and decreases to 5.
- p2 starts at 0 and increases to 10.
- The correct graph will reflect these changes over time.
Final Answer
The correct graph showing the linear momentum of the 1 kg block and the 2 kg block versus time is option D.
---
- We have a 1 kg block moving with an initial velocity of 15 m/s towards the right.
- The 2 kg block is initially at rest.
- The 1 kg block experiences a frictional force acting to the left (opposite to its motion).
- The 2 kg block will start moving to the right due to the frictional force exerted by the 1 kg block.
- The frictional force can be expressed as Ff=μN, where N is the normal force.
- For the 1 kg block, N=mg=1×g (where g is the acceleration due to gravity).
- Thus, the frictional force acting on the 1 kg block is Ff=μ×1×g.
- Initially, the momentum of the 1 kg block (p1) is p1=m1⋅v1=1⋅15=15kg m/s.
- The momentum of the 2 kg block (p2) is p2=0 since it is at rest.
- When both blocks start moving together, we can apply the conservation of momentum:
m1u1+m2u2=m1v1+m2v2
where u2=0 (initial velocity of the 2 kg block).
- Plugging in the values:
1⋅15+2⋅0=1⋅v+2⋅v
15=3v⟹v=5m/s
- After some time, when both blocks are moving together:
- The momentum of the 1 kg block becomes p′1=1⋅5=5kg m/s.
- The momentum of the 2 kg block becomes p′2=2⋅5=10kg m/s.
- Initially, p1=15 and p2=0.
- After some time, p′1=5 and p′2=10.
- The graph should show p1 decreasing from 15 to 5 and p2 increasing from 0 to 10.
- Based on the analysis, we need a graph where:
- p1 starts at 15 and decreases to 5.
- p2 starts at 0 and increases to 10.
- The correct graph will reflect these changes over time.
The correct graph showing the linear momentum of the 1 kg block and the 2 kg block versus time is option D.
Similar Questions
Comprehension # 6
A 1kg block is given a velocity of 15m/s towards right over a very long rough plank of mass 2kg as shown in figure.
If coefficient of friction between the two blocks is equal to 0.4, then magnitude of initial slope of p1 versus t and p2 versus t (in SI unit) will be :-
View SolutionComprehension # 6
A 1kg block is given a velocity of 15m/s towards right over a very long rough plank of mass 2kg as shown in figure.
figure. If coefficient of friction between the two blocks is equal to 0.4Momentum of both the blocks are equal at time t=…….s :
View SolutionForce-time graph of a particle of mass 6 kg is shown in figure, then change in linear momentum during t = 0 to t = 10 s is
View SolutionA body of mass 5 kg is moving with velocity 2 ms−1. Calculate its linear momentum.
View SolutionA body of mass 5 kg is moving with velocity 2ms−1. Calculate its linear momentum.
View SolutionA block of mass 1 kg is pushed towards another block of mass 2 kg from 6 m distance as shown in figure. Just after colision velocity of 2 kg block becomes 4 m//s
.
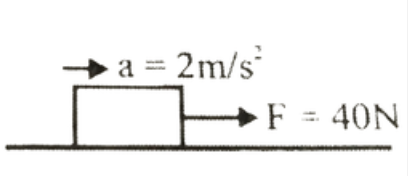
View SolutionA block of mass 10 kg, moving with acceleration 2m/s2 on horizontal rough surface is shown in figure
View SolutionComprehension # 5
One particle of mass 1kg is moving along positive x-axis with velocity 3m/s. Another particle of mass 2kg is moving along y-axis with 6m/s. At time t=0,1kg mass is at (3m,0) and 2kg at (0,9m),x−y plane is the horizontal plane. (Surface is smooth for question 1 and rough for question 2 and 3)
The centre of mass of the two particles is moving in a straight line for which equation is :
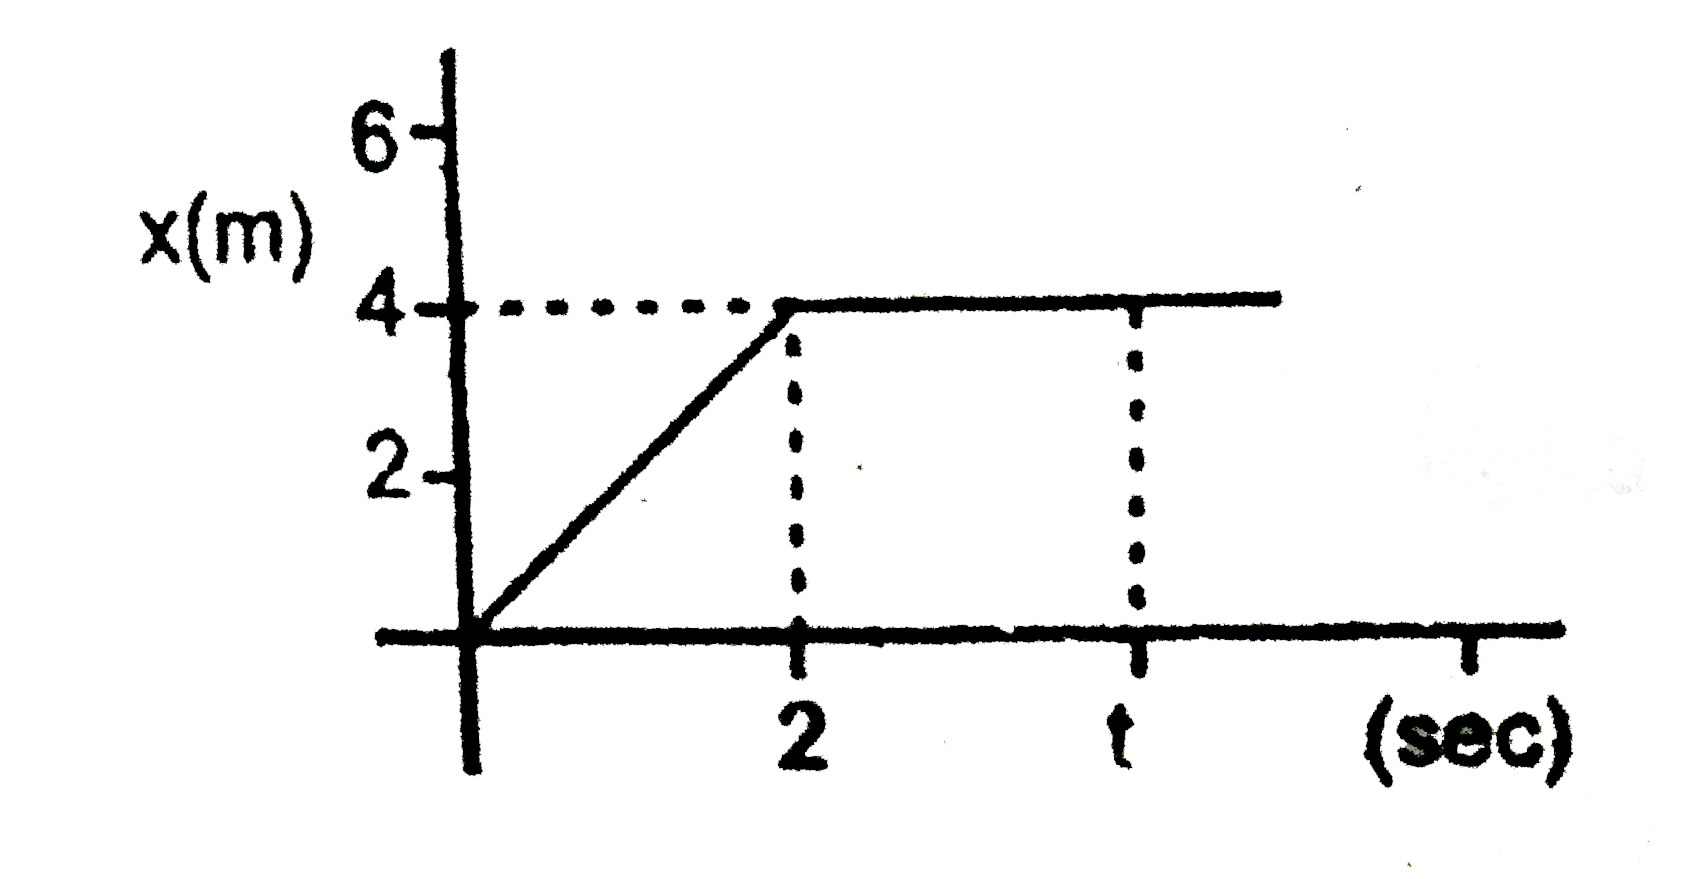
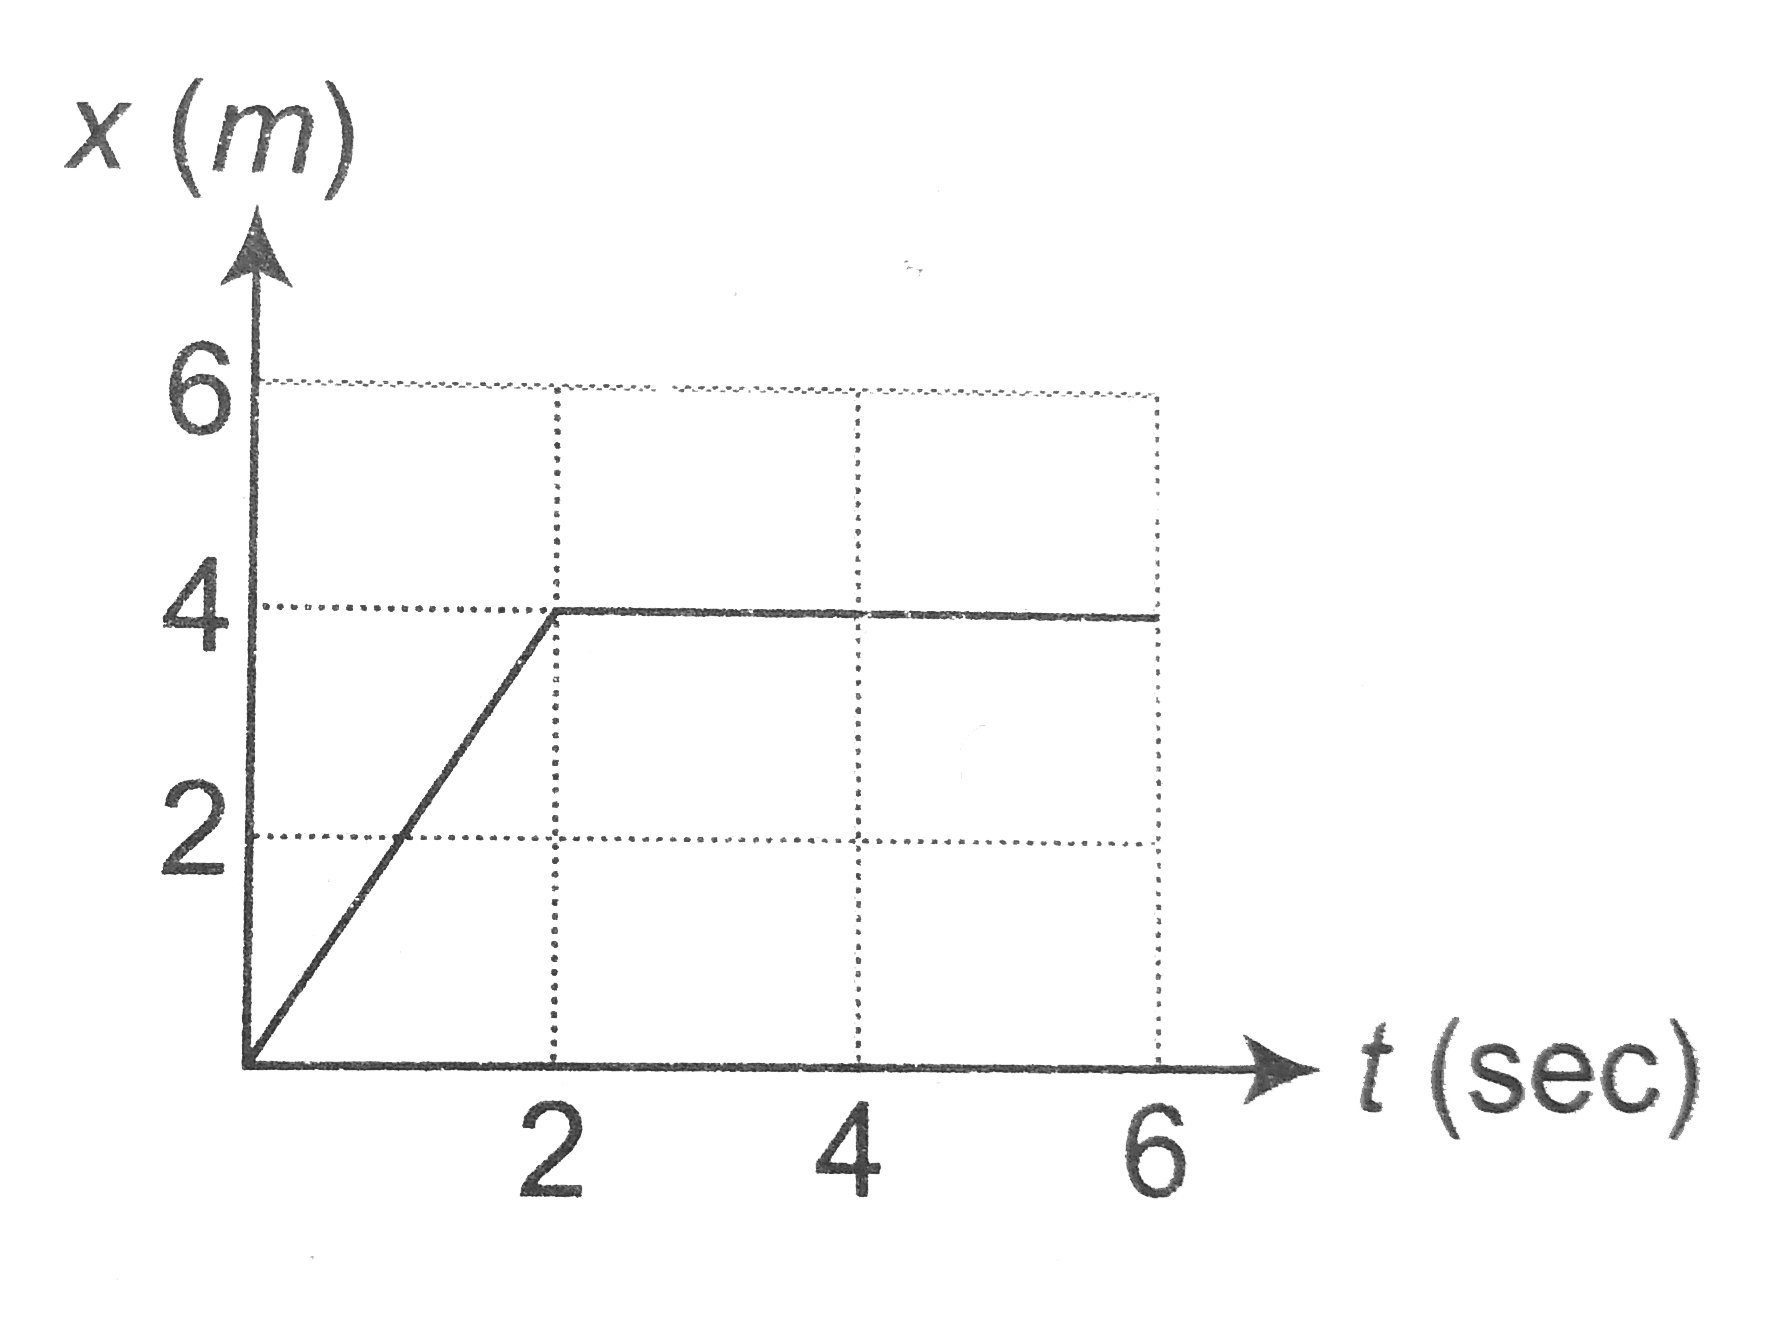
View SolutionIn the figure given below, the position time graph of a particle of mass 0.1kg is shown. The impulse at t=2 sec is
View SolutionIn the figure given below, the position-time graph of a particle of mass 0.1kg is shown. The impuslse at t=2 sec is
View Solution
