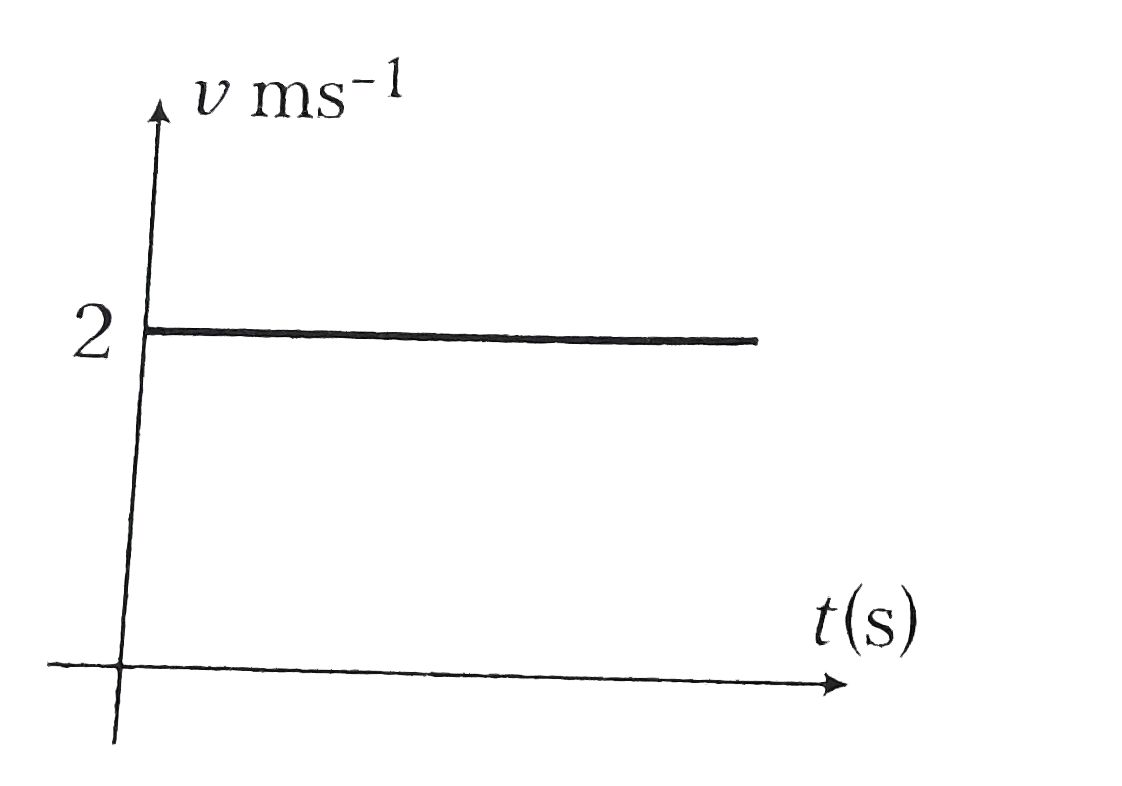
The x-t equation is given as x=2t+1. The corresponding v-t graph is
a straight line passing through origin
a straight line not passing through origin
a parabola
None of the above
The correct Answer is:B
υ=dxdt=2ms−1 = constant
Topper's Solved these Questions
- BOOK - DC PANDEY ENGLISHCHAPTER - MOTION IN A PLANEEXERCISE - Check point 3.715videos
MOTION IN A PLANE
- BOOK - DC PANDEY ENGLISHCHAPTER - MOTION IN A PLANEEXERCISE - (A) Taking it together75videos
MOTION IN A PLANE
- BOOK - DC PANDEY ENGLISHCHAPTER - MOTION IN A PLANEEXERCISE - Check point 3.525videos
MOTION IN A PLANE
- BOOK - DC PANDEY ENGLISHCHAPTER - MOTIONEXERCISE - Medical entrances gallery19videos
MOTION
- BOOK - DC PANDEY ENGLISHCHAPTER - PROJECTILE MOTIONEXERCISE - Level - 2 Subjective10videos
PROJECTILE MOTION
Similar Questions
The displacement -time (x– t) graph of a body is given as
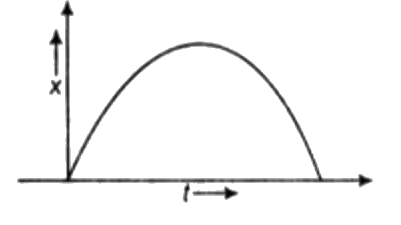
The corresponding velocity -time (v – t ) graph will beView SolutionThe displacement-time (x - t) graph of a body is given as
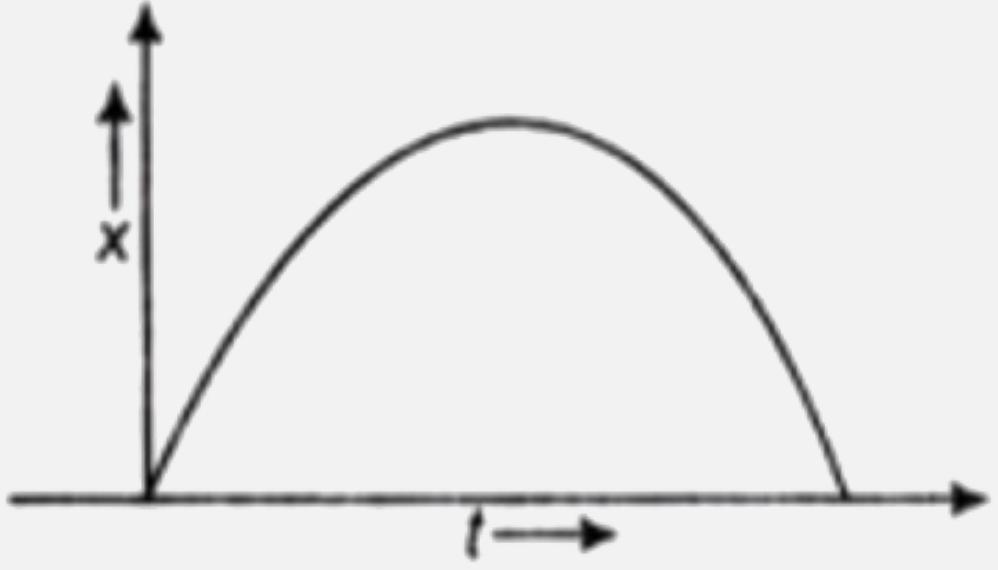
The corresponding velocity -time (v - t) graph will beView SolutionThe velocity-time (v-t) graph for a particle in a straight line motion is given below The corresponding accelaration-time (a-t) graph will
View SolutionThe displacement of the particle at x = 0 of a stretched string carrying a wave in the positive x-direction is given by f(t)=Asin(tT). The wave speed is v. Write the wave equation.
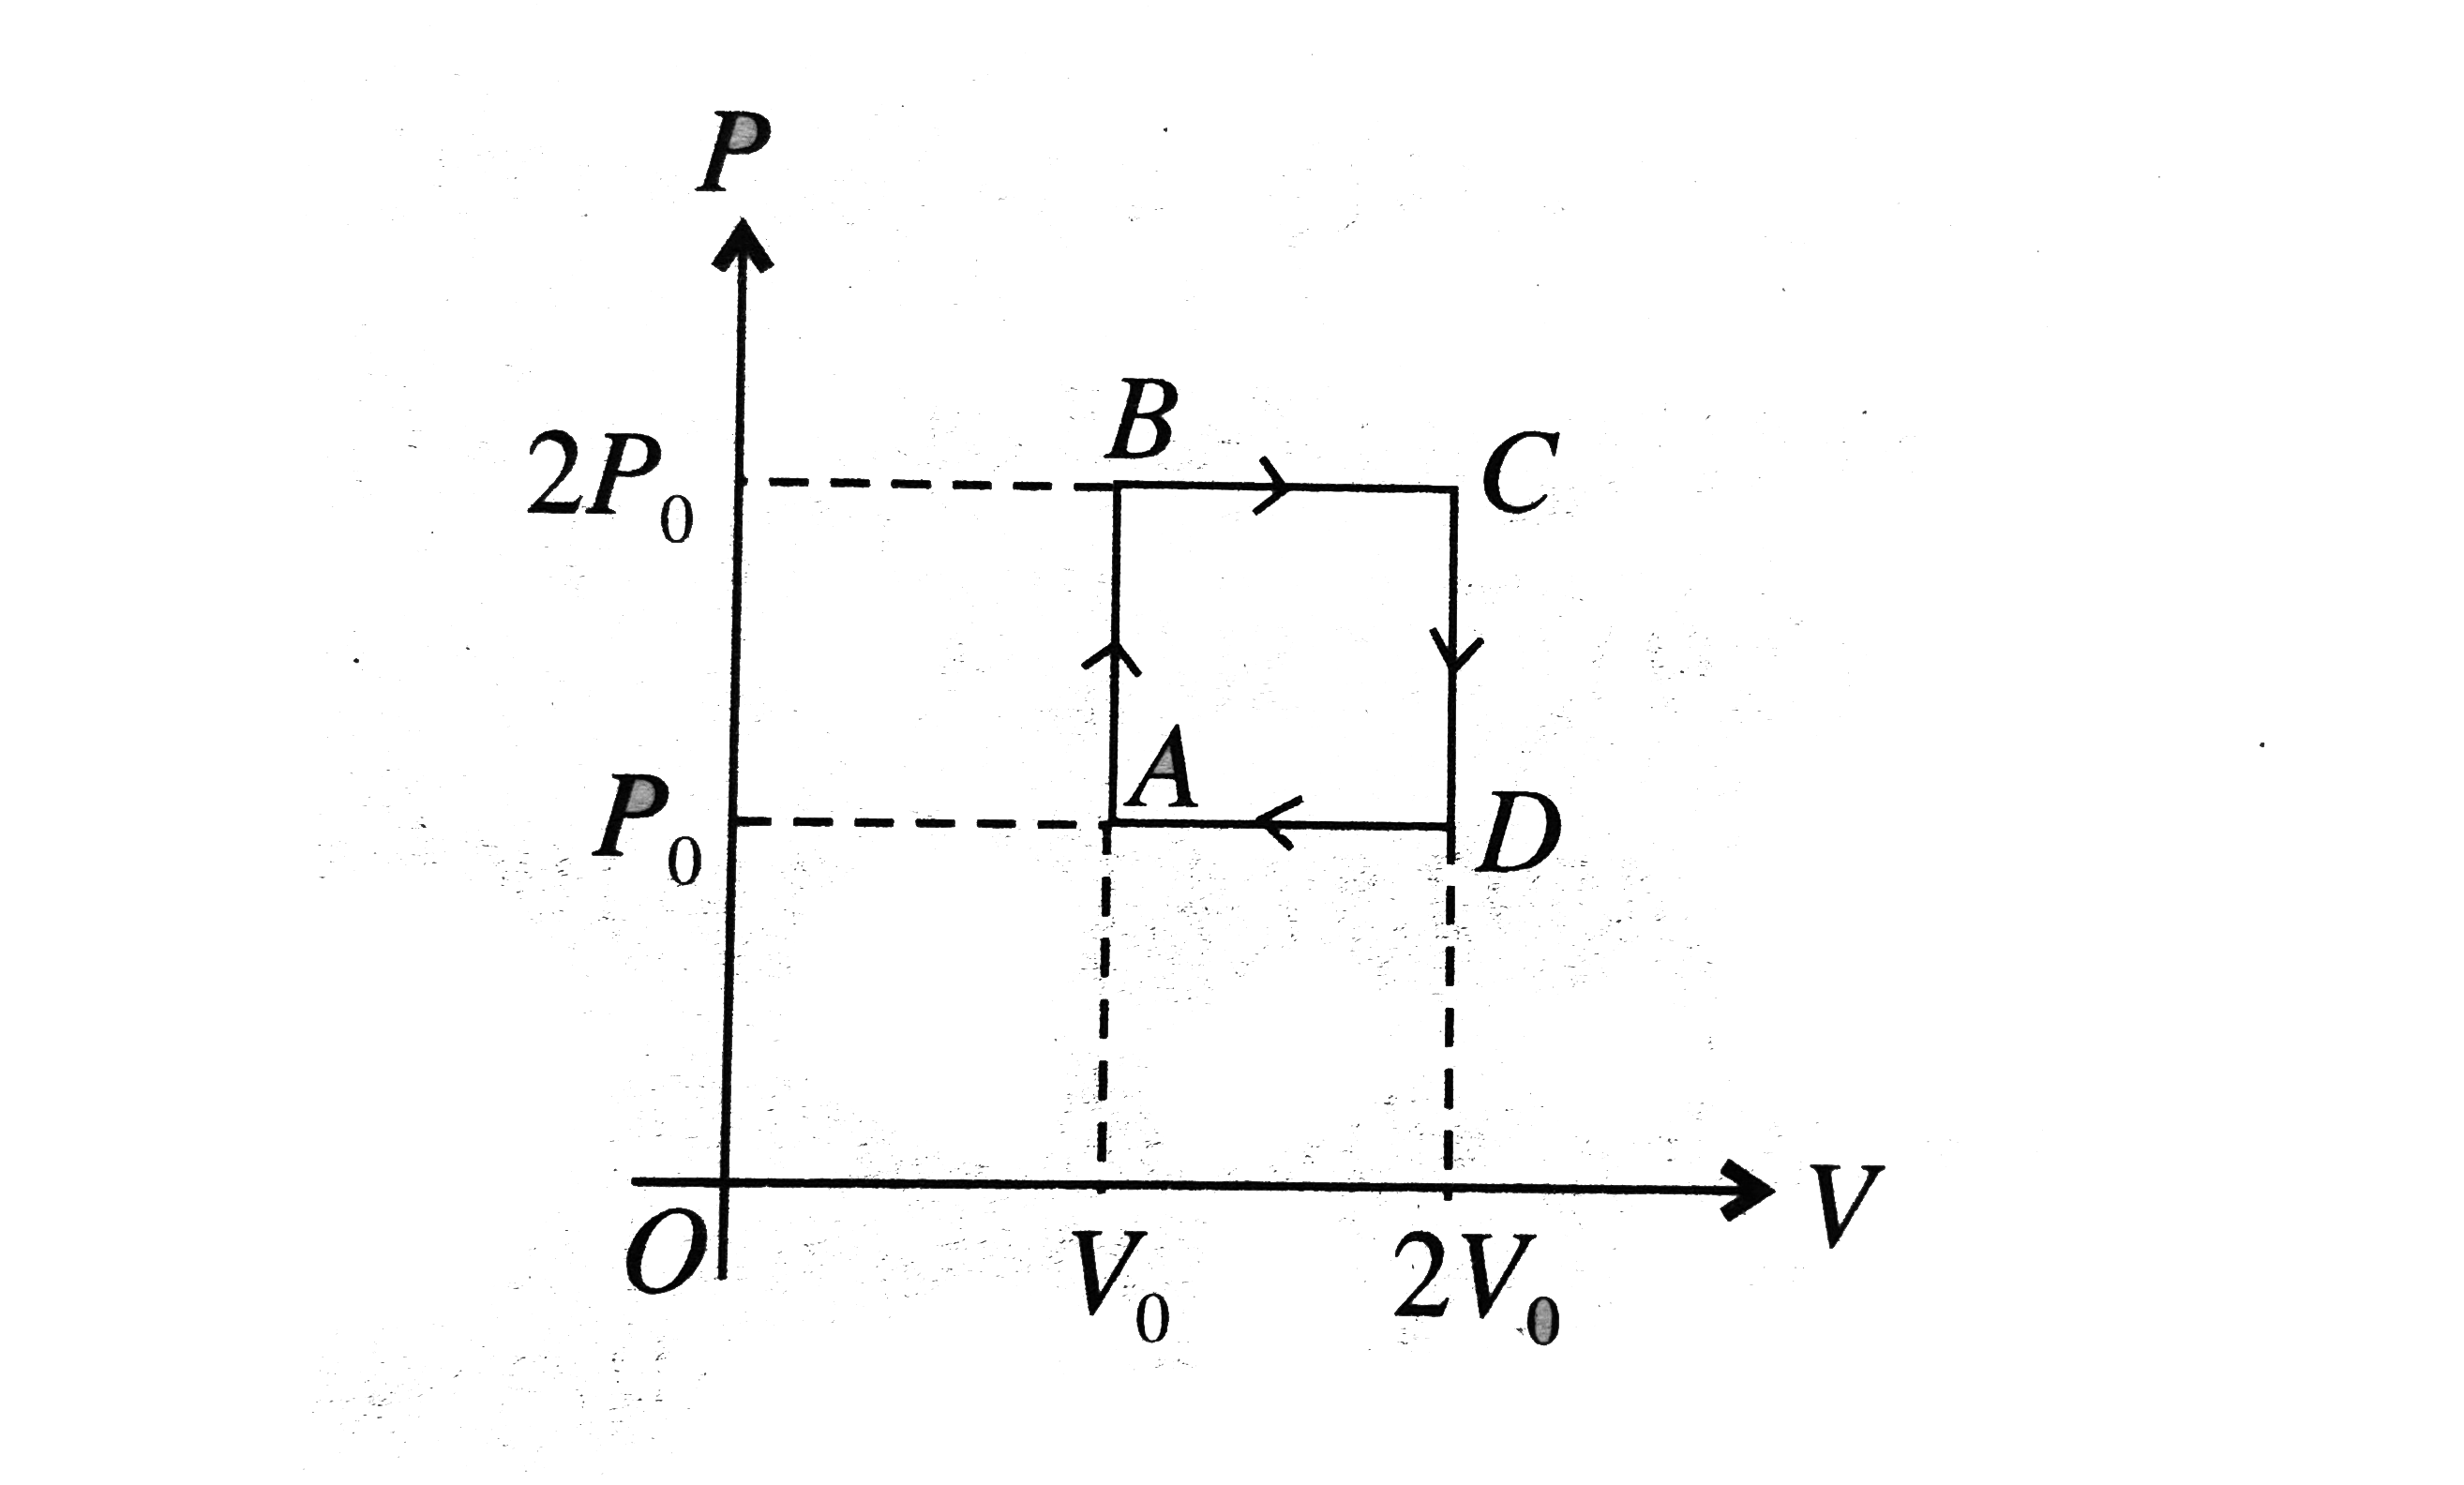
View SolutionFind out the work done in the given graph. Also draw the corresponding T -V curve and P-T curve.
 View Solution
Find out the work done in the given graph. Also draw the corresponding T -V curve and P-T curve.
 View Solution
The velocity (v) - time (t) graph for a particle moving along x - axis is shown in the figure. The corresponding position (x) - time (t) is best represented by
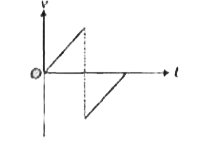 View Solution
P−T diagram is shown in Fig. Choose the corresponding V−T diagram.
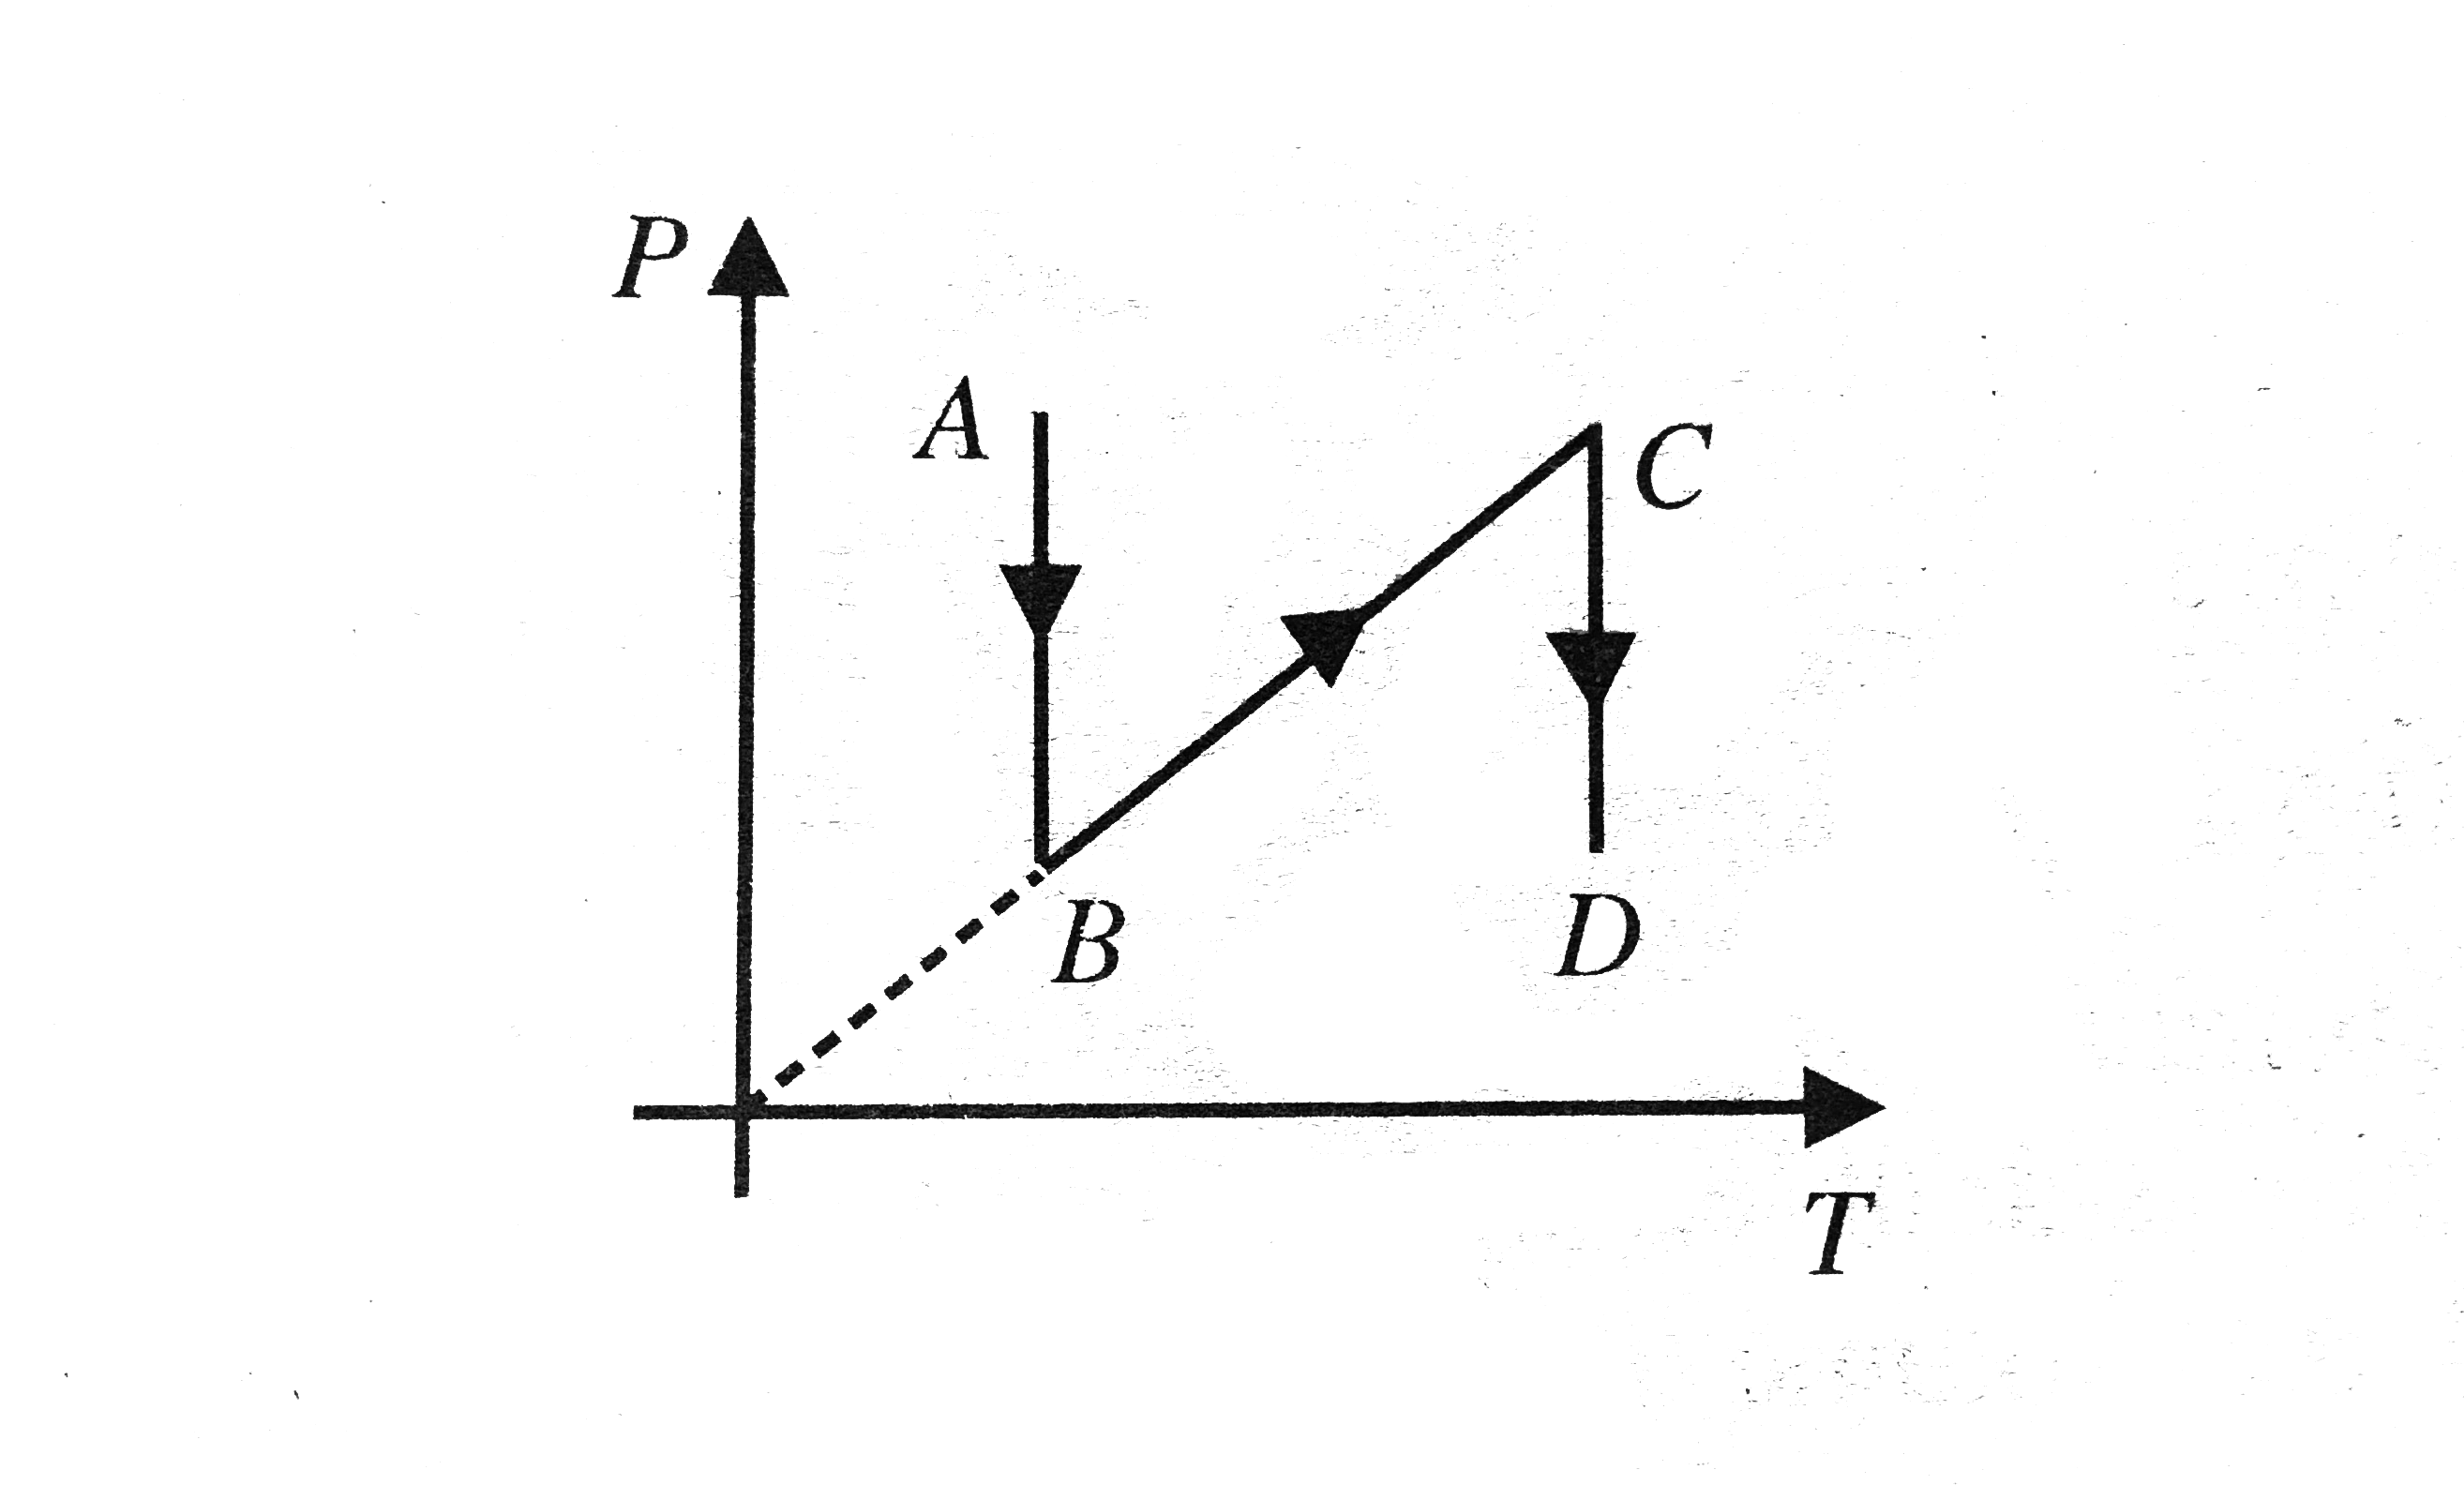 View Solution
P−T diagram is shown in Fig. Choose the corresponding V−T diagram.
 View Solution
The curve is given by x=cos2t,y=sint represents
View Solution

