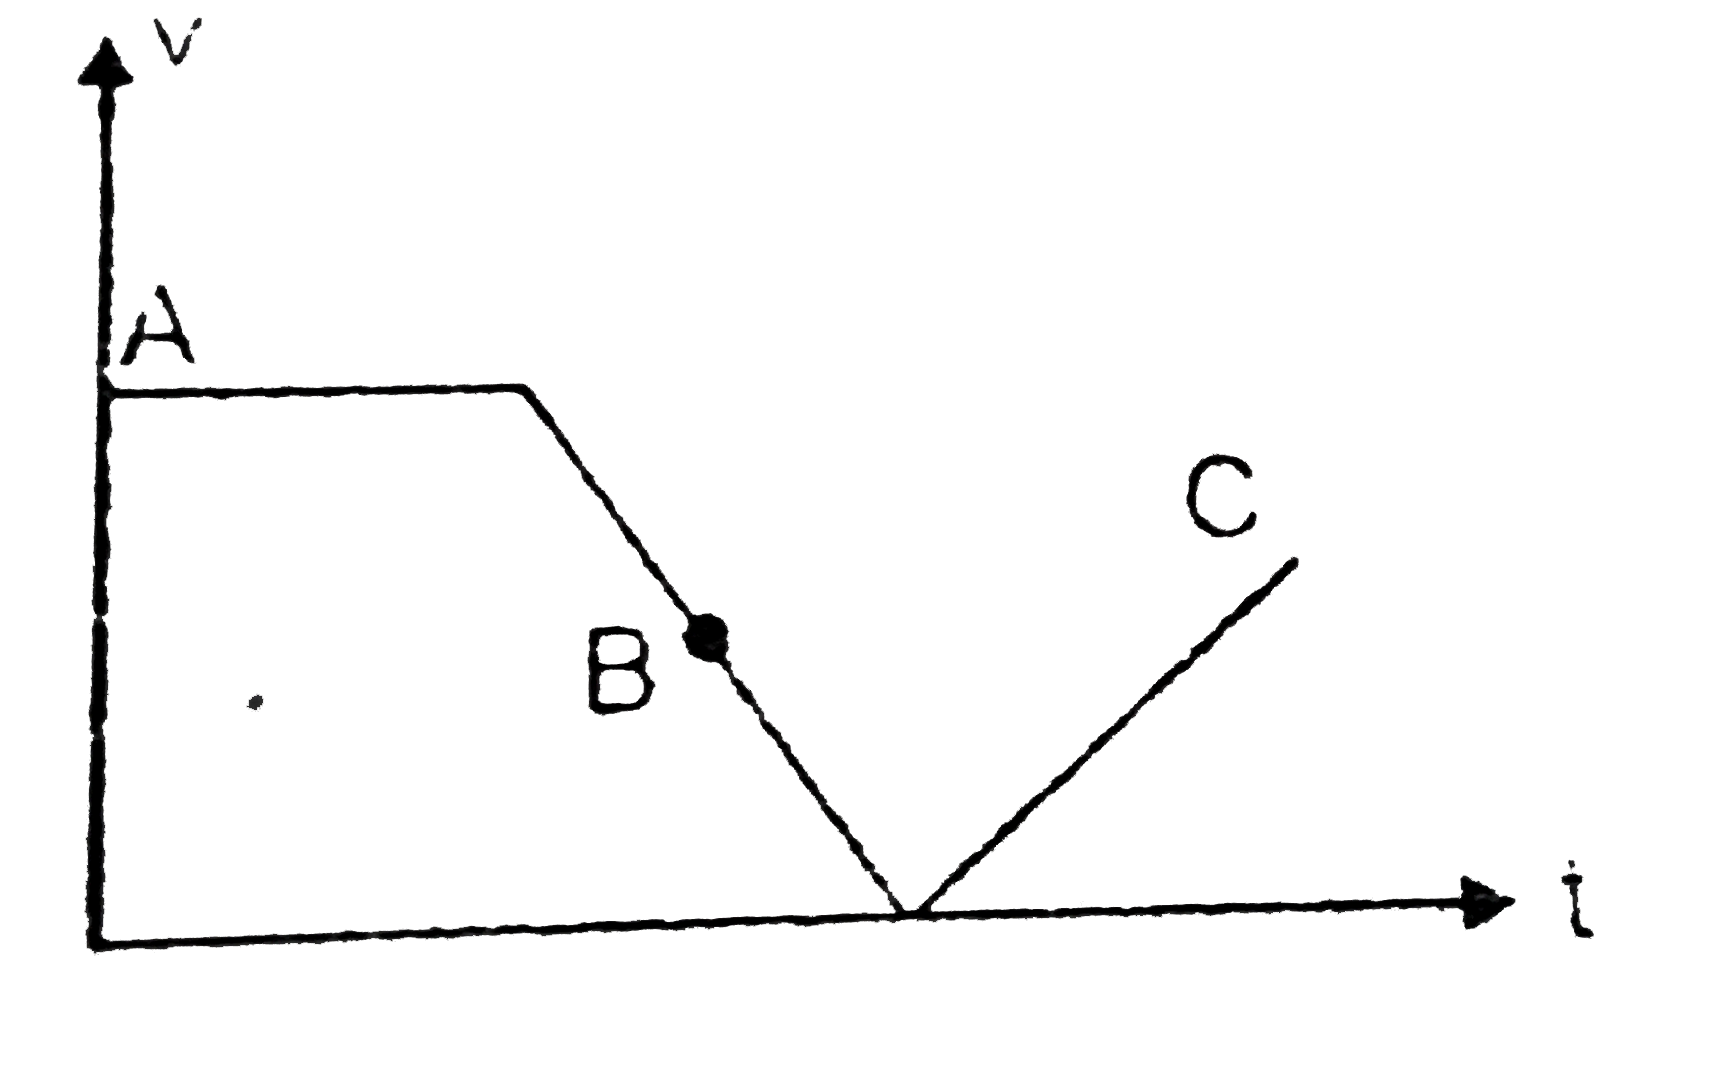
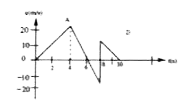
The velocity time graph of a body is shown in fig. it indicates that :
the is zero
there is at force towards motion
there is a force which opposes motion
there is only gravitational force
The correct Answer is:C
In region B, velocity is decreasing. So, a force will act which opposes the motion of a body.
Topper's Solved these Questions
- MOTION IN A PLANEBook:DC PANDEY ENGLISHChapter:MOTION IN A PLANEExercise:Check point 3.7
Explore 15 Videos
- MOTION IN A PLANEBook:DC PANDEY ENGLISHChapter:MOTION IN A PLANEExercise:(A) Taking it together
Explore 75 Videos
- MOTION IN A PLANEBook:DC PANDEY ENGLISHChapter:MOTION IN A PLANEExercise:Check point 3.5
Explore 25 Videos
- MOTIONBook:DC PANDEY ENGLISHChapter:MOTIONExercise:Medical entrances gallery
Explore 19 Videos
- PROJECTILE MOTIONBook:DC PANDEY ENGLISHChapter:PROJECTILE MOTIONExercise:Level - 2 Subjective
Explore 10 Videos
Similar Questions
Knowledge Check
The velocity time graph of a body is shown in fig. 3.3. it implies that at point B
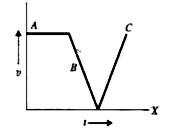 Athe force is zeroBthere is a force towards motionCthere is force which oppose motionDnone of the above
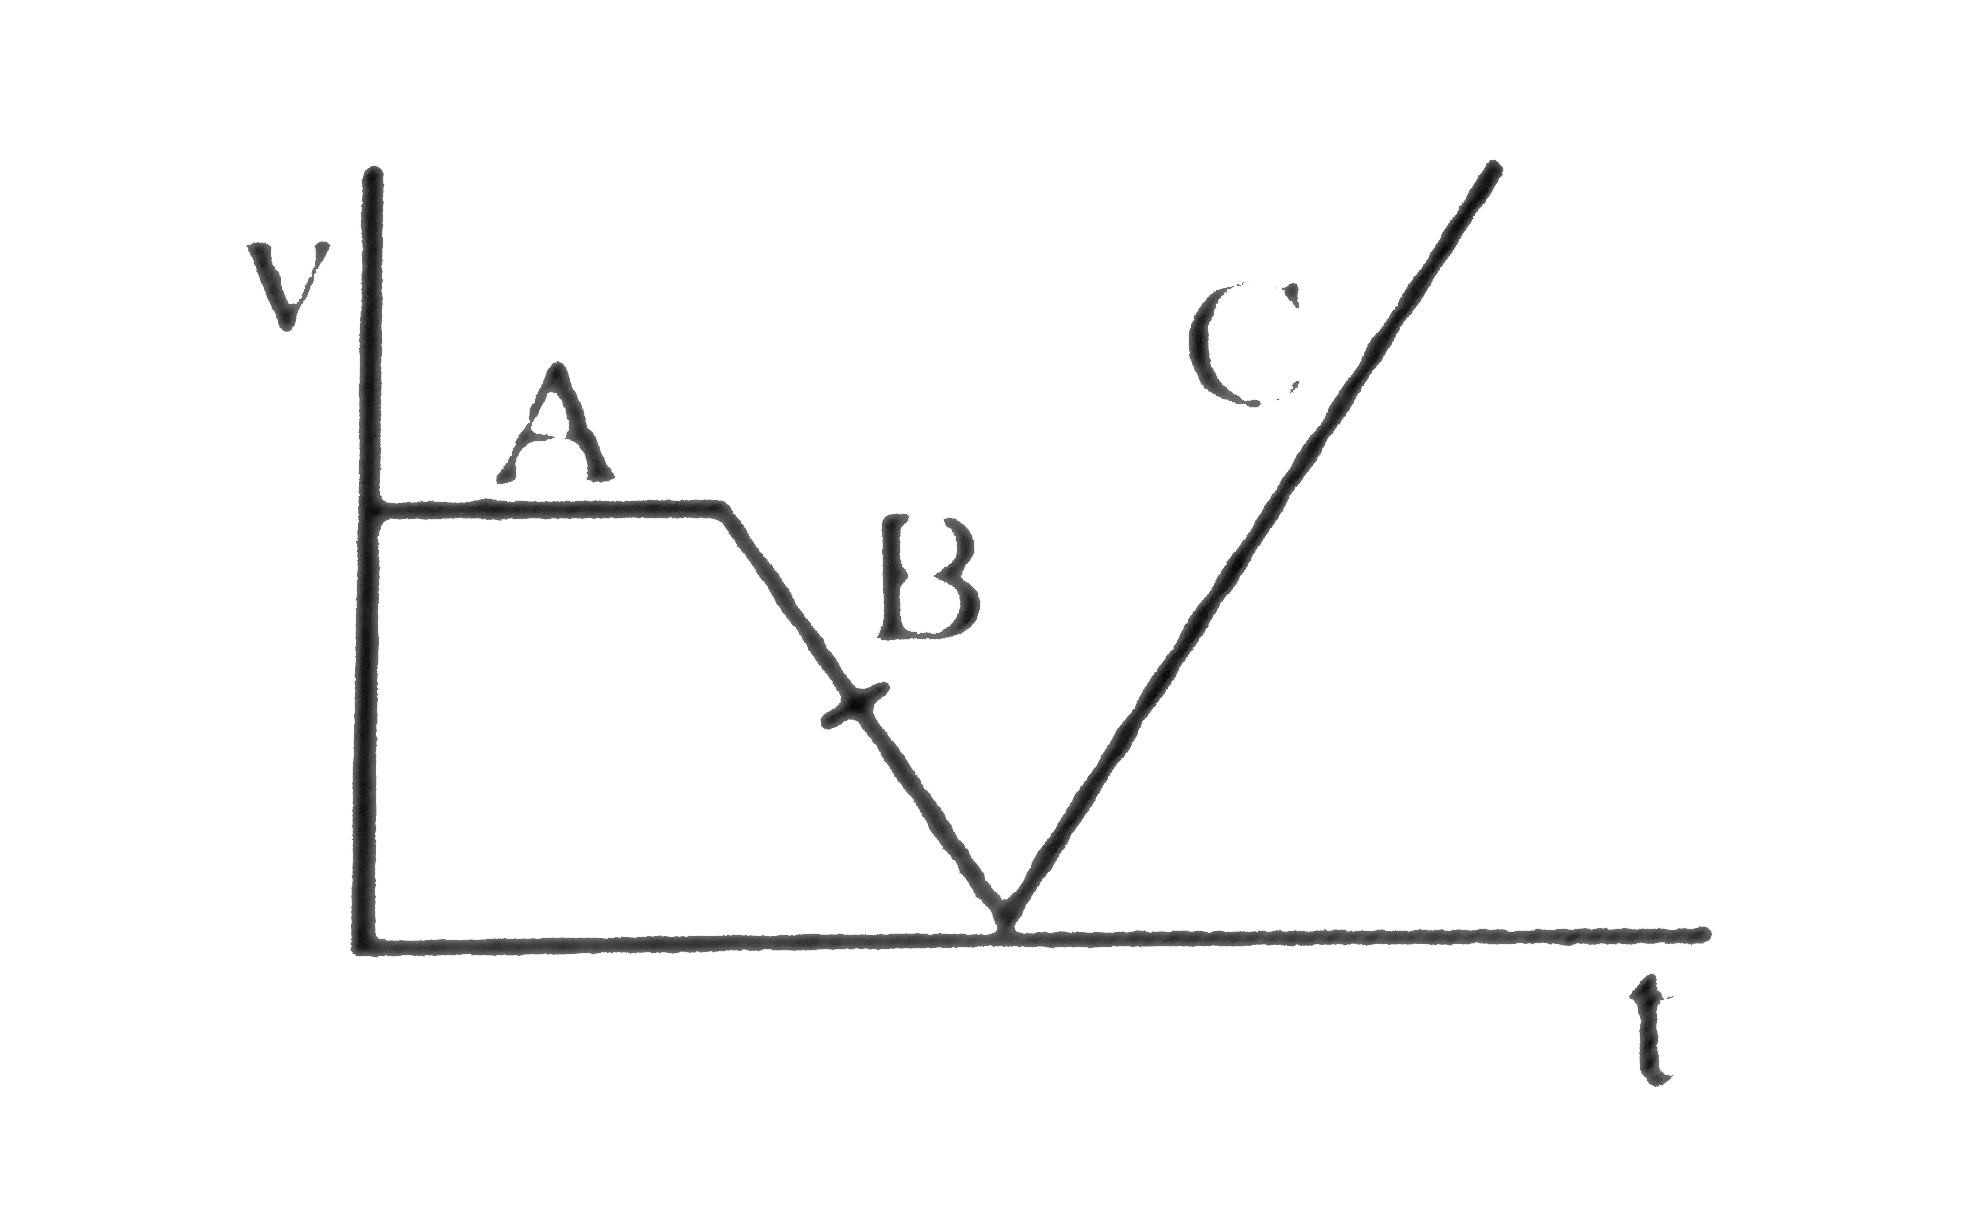
Velocity versus time graph of a body is shown in figure. It explains that
View SolutionThe velocity − time graph of a particle is as shown in figure

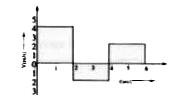
View SolutionThe velocity time graph of a body moving in a straight line is shown in the figure. The displacement and distance travelled by the body in 6 sec are respectively.
View SolutionGraph of a body is shown. It explains that

View SolutionThe velocity-time graph of a body moving in a straight line is shown in Fig. Find the displacement and distance travelled by the body in 10 sec.
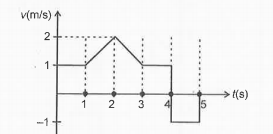
View SolutionThe velocity-time graph of a body is shown below. The displacement covered by body in 5 s is
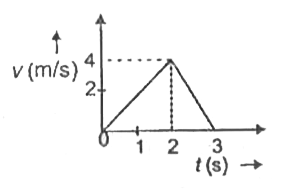
View SolutionThe velocity versus time graph of a body moving in a straight line is as shown in the figure below
View Solution

 .
.