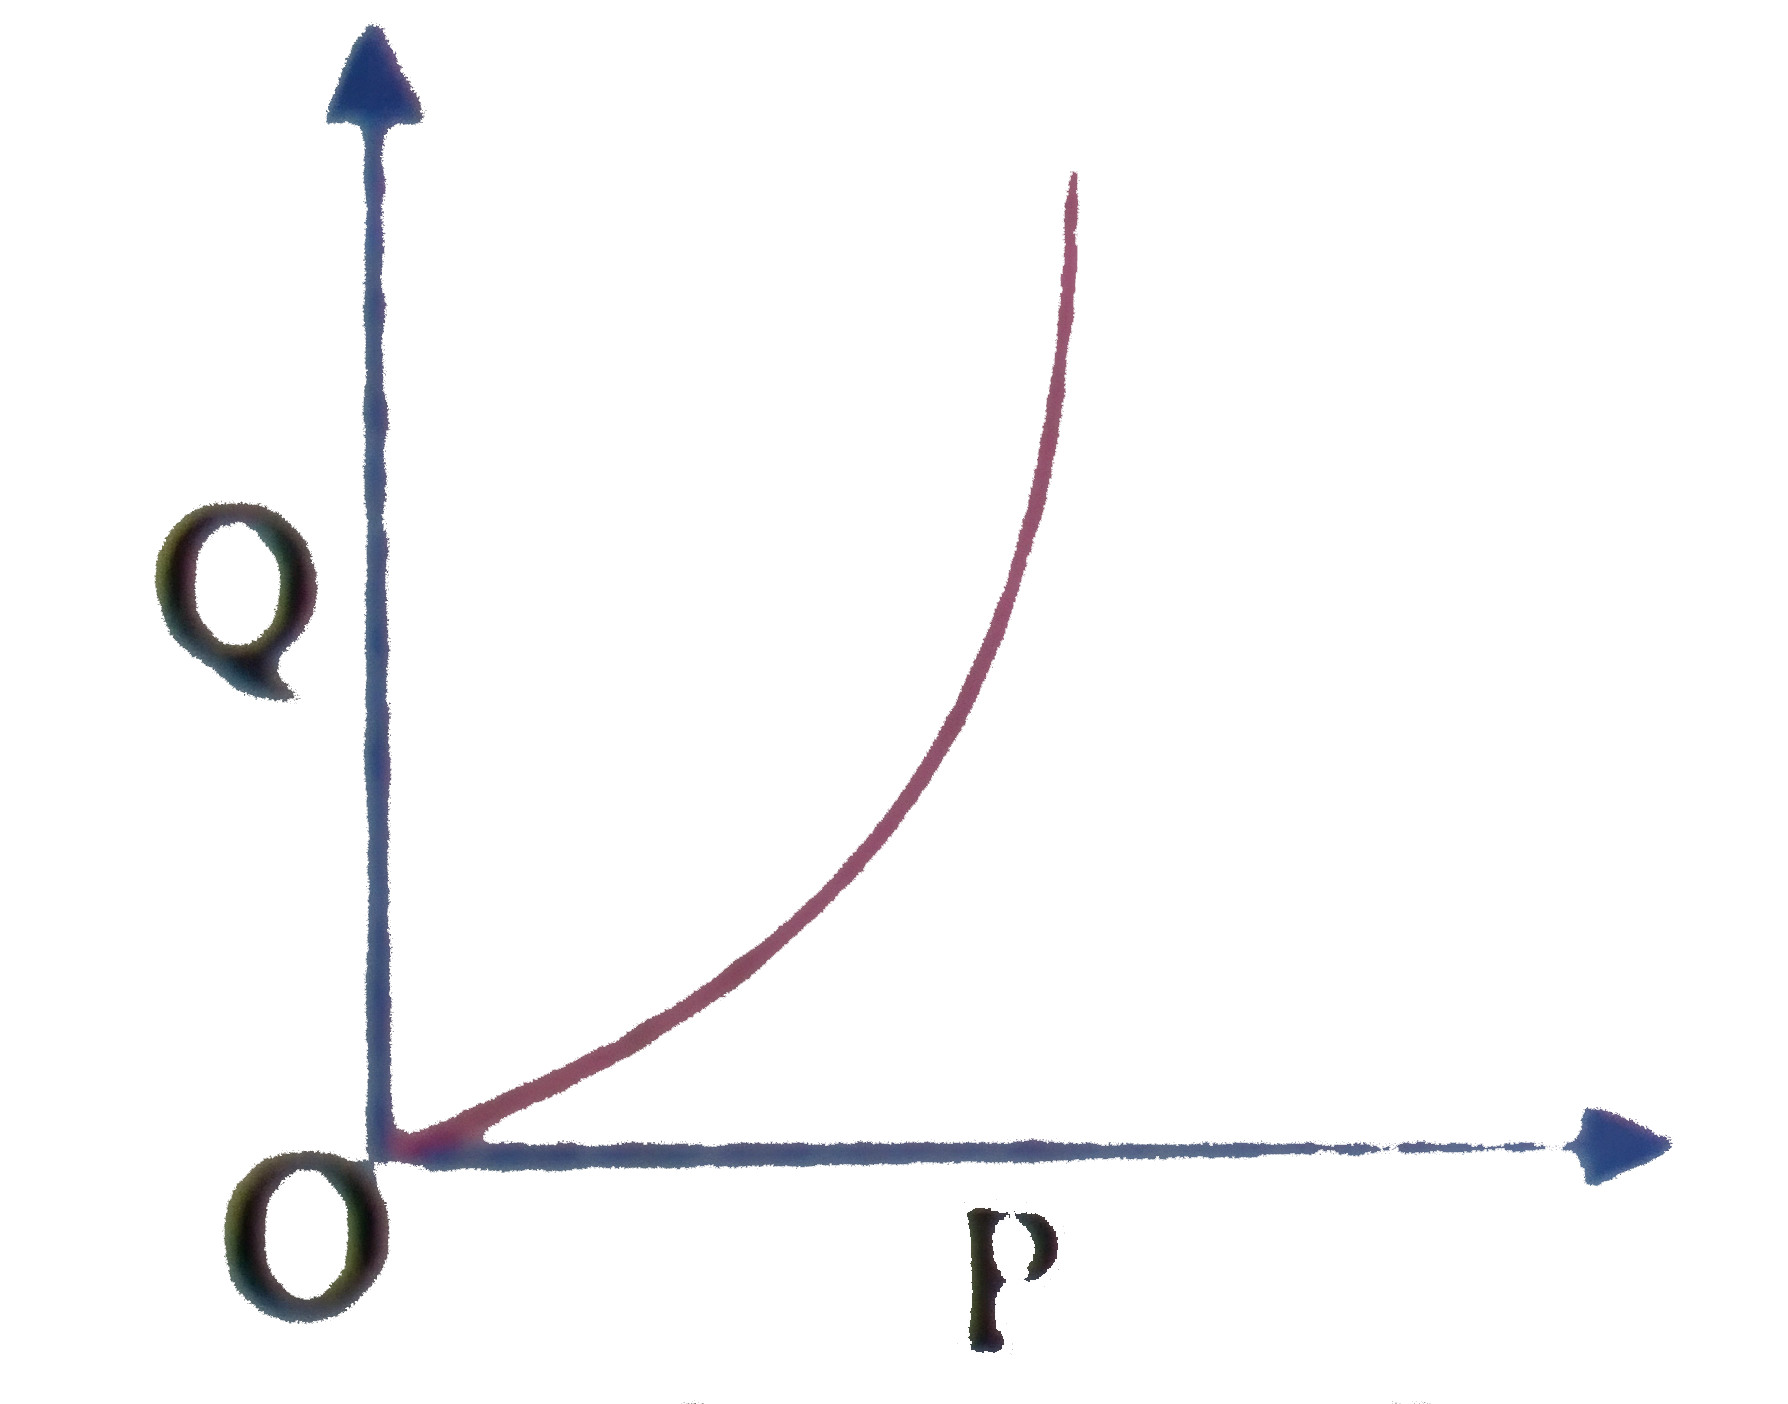
The graph show the behaviour of a length of wire in the region for which the substances obeys Hooke's law. P and Q represent
P=applied force, Q=extension
P=extension, Q=applied force
P=extension, Q=stored elastic energy
P=stored elastic energy, Q=extension
The correct Answer is:C
(c) Graph between applied force and extension will be straight line because in elastic range,
Applied force ∝ extension
but the graph given in parabolic in nature
So, it will be between extension and stored elastic energy As U=1/2kx2or U∝x2
Topper's Solved these Questions
- BOOK - DC PANDEY ENGLISHCHAPTER - ELASTICITYEXERCISE - Match the columns4videos
ELASTICITY
- BOOK - DC PANDEY ENGLISHCHAPTER - ELASTICITYEXERCISE - Medical entrances s gallery21videos
ELASTICITY
- BOOK - DC PANDEY ENGLISHCHAPTER - ELASTICITYEXERCISE - Check point 12.315videos
ELASTICITY
- BOOK - DC PANDEY ENGLISHCHAPTER - CURRENT ELECTRICITYEXERCISE - All Questions469videos
CURRENT ELECTRICITY
- BOOK - DC PANDEY ENGLISHCHAPTER - ELECTROSTATICSEXERCISE - Integer17videos
ELECTROSTATICS
Similar Questions
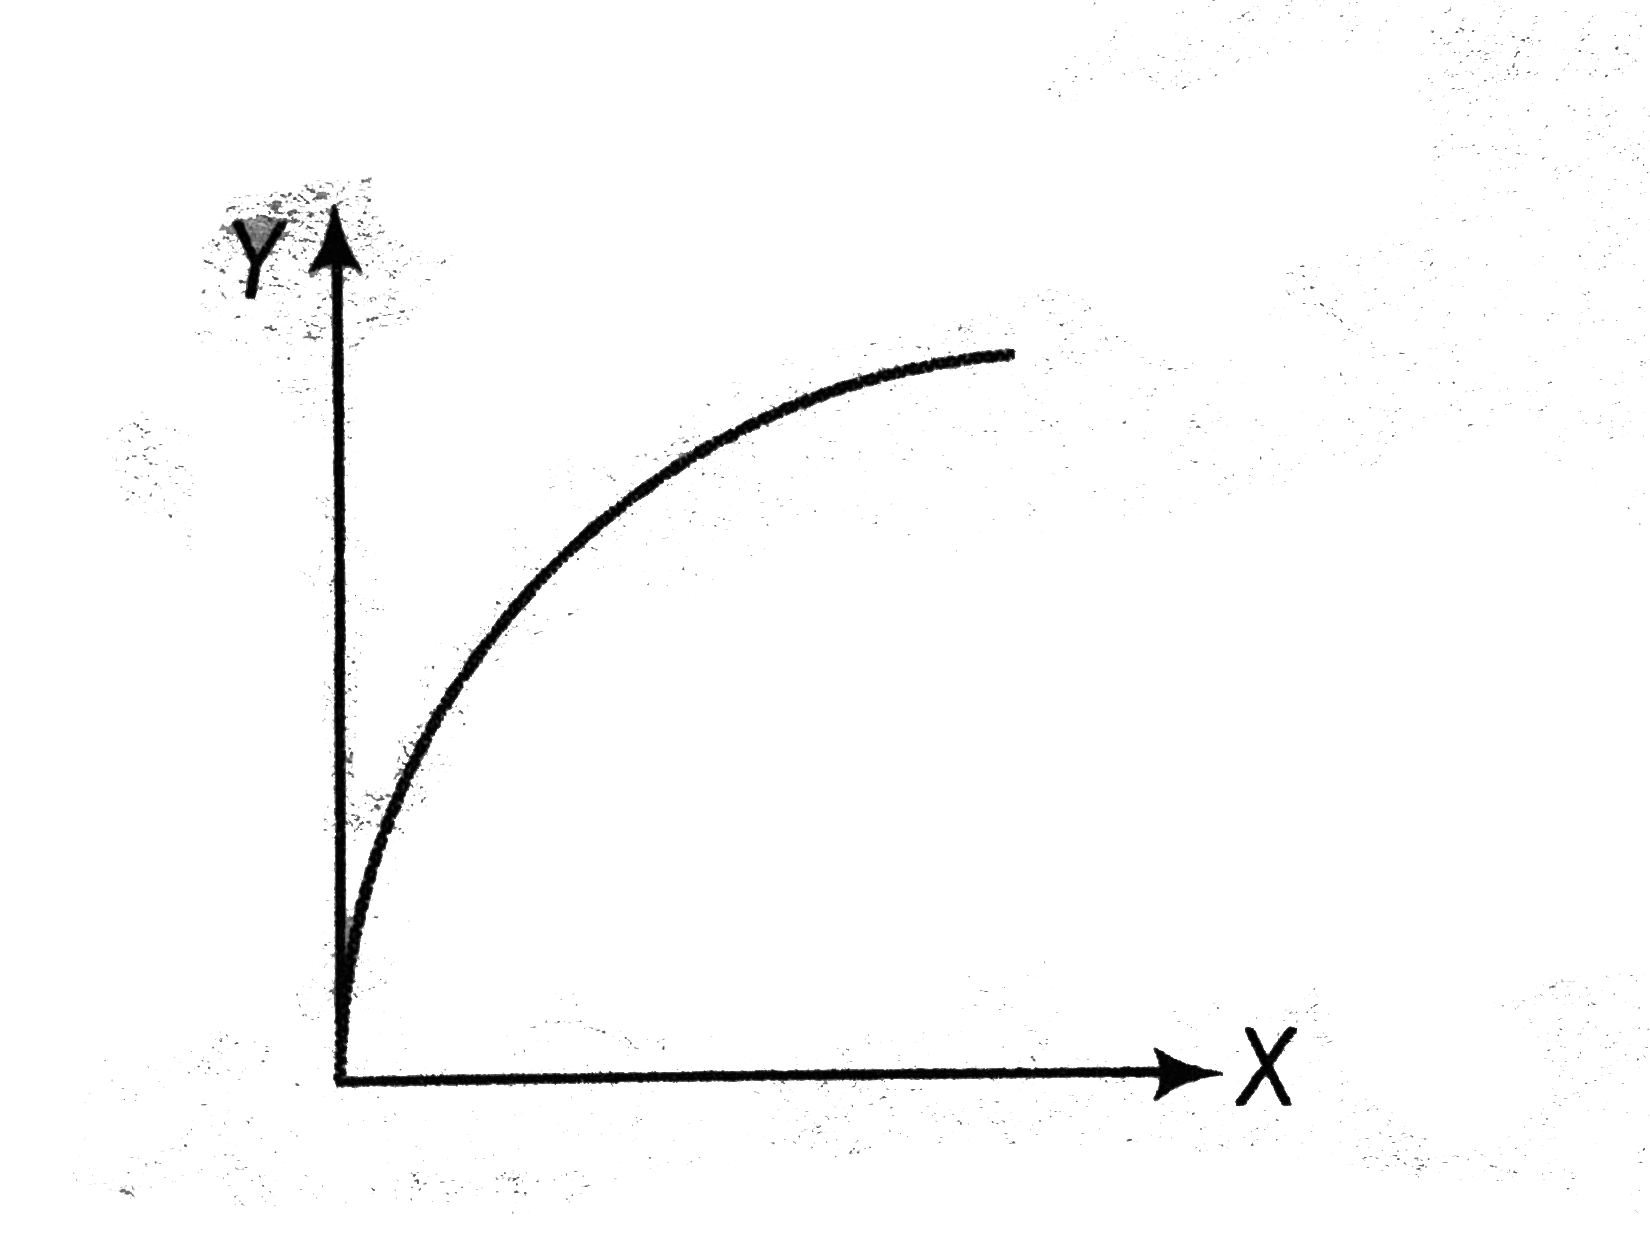
The graph shows the behaviour of a steel wire in the region for whoch the wire obeys Hooke's law. The graph is a parabola. The variables X and Y -axes, respectively can be [ stress (σ),strain (ε) and elastic potential energy(U) ]
 View Solution
Which one of the following graphs shows the variation of magnetic induction B which distance r from a long wire carrying a current ?
View Solution
Knowledge Check
- Question 1 - Select One
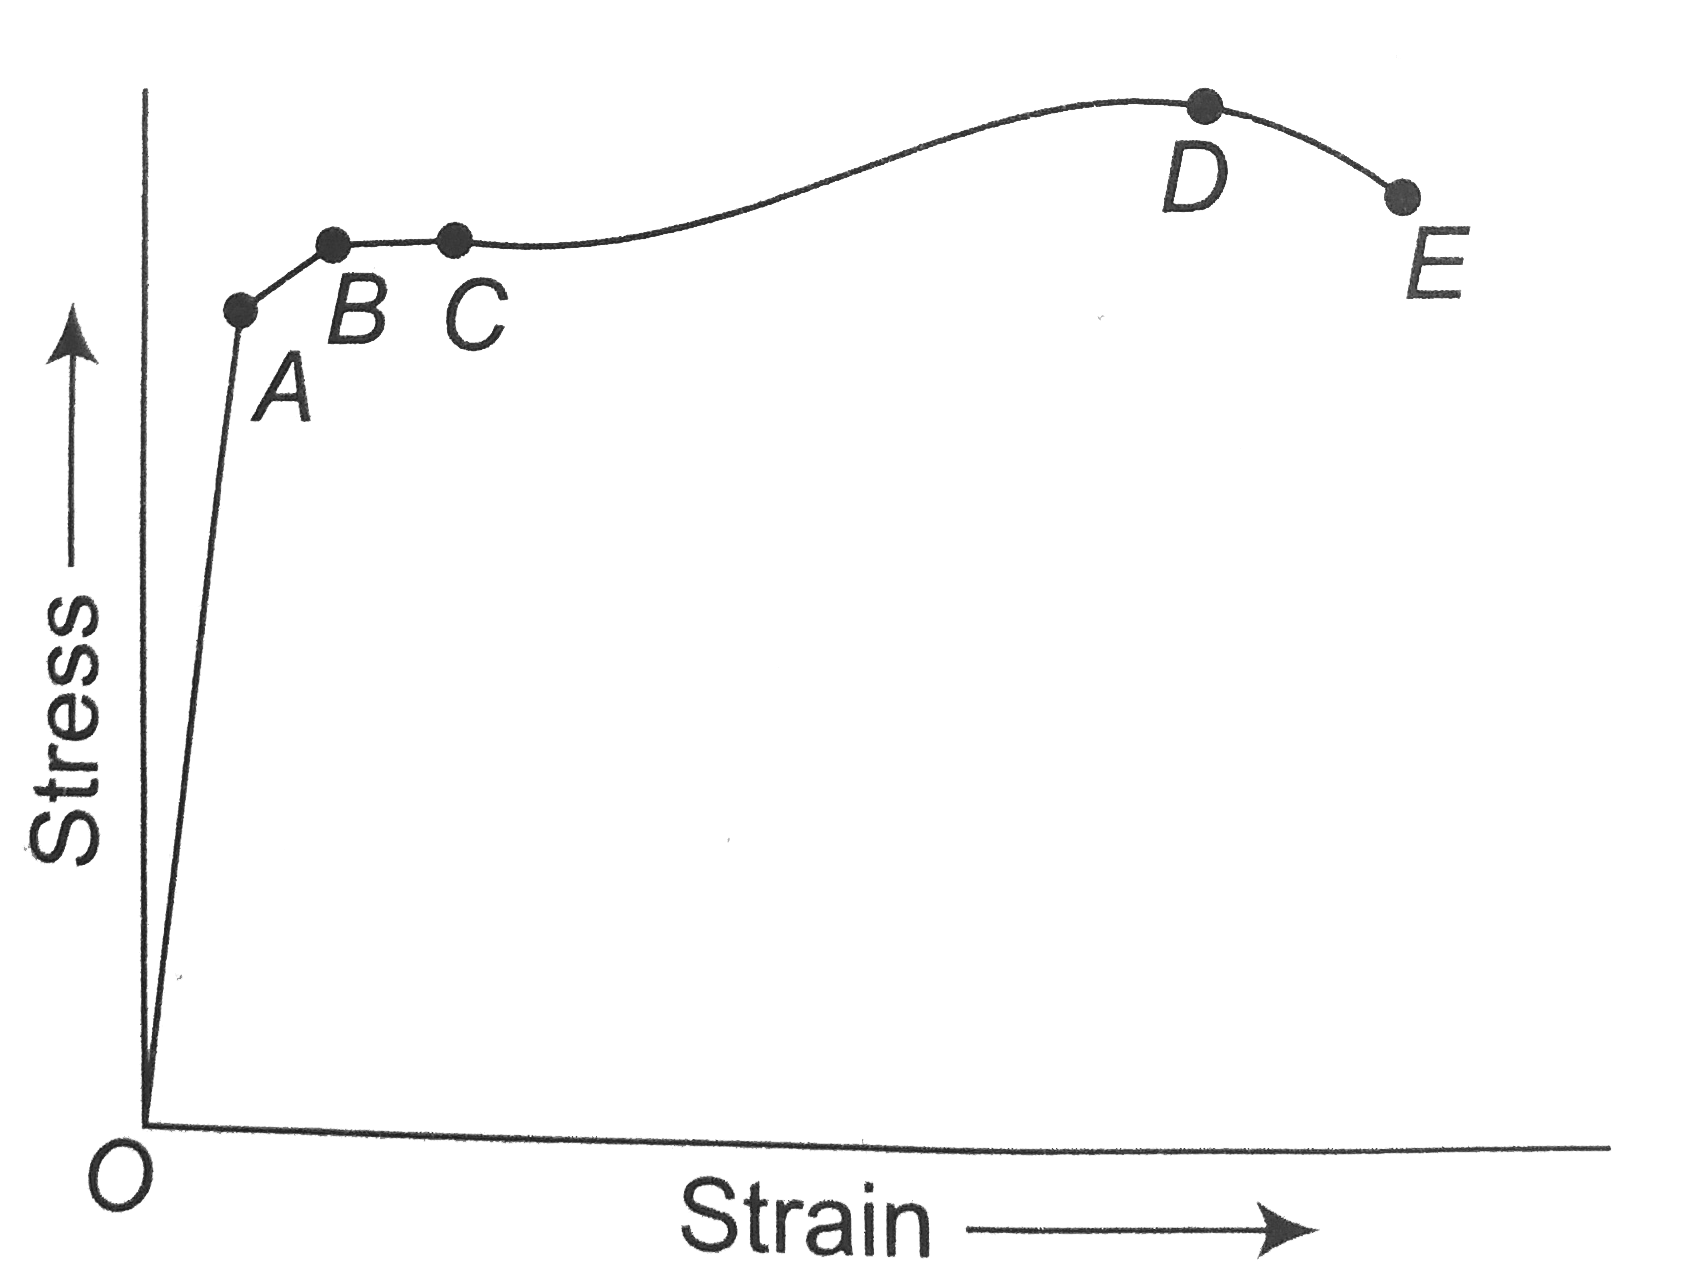
The stress strain graph for a metal wire is as shown in the figure. In the graph, the region in which Hooke's law is obeyed, the ultimate strength and fracture are represented byAOA, C, DBOB, D, ECÂ OA, D, EDOB, C, D - Question 2 - Select One
Which of the following graphs represent the behaviour of an ideal gas ?
A1.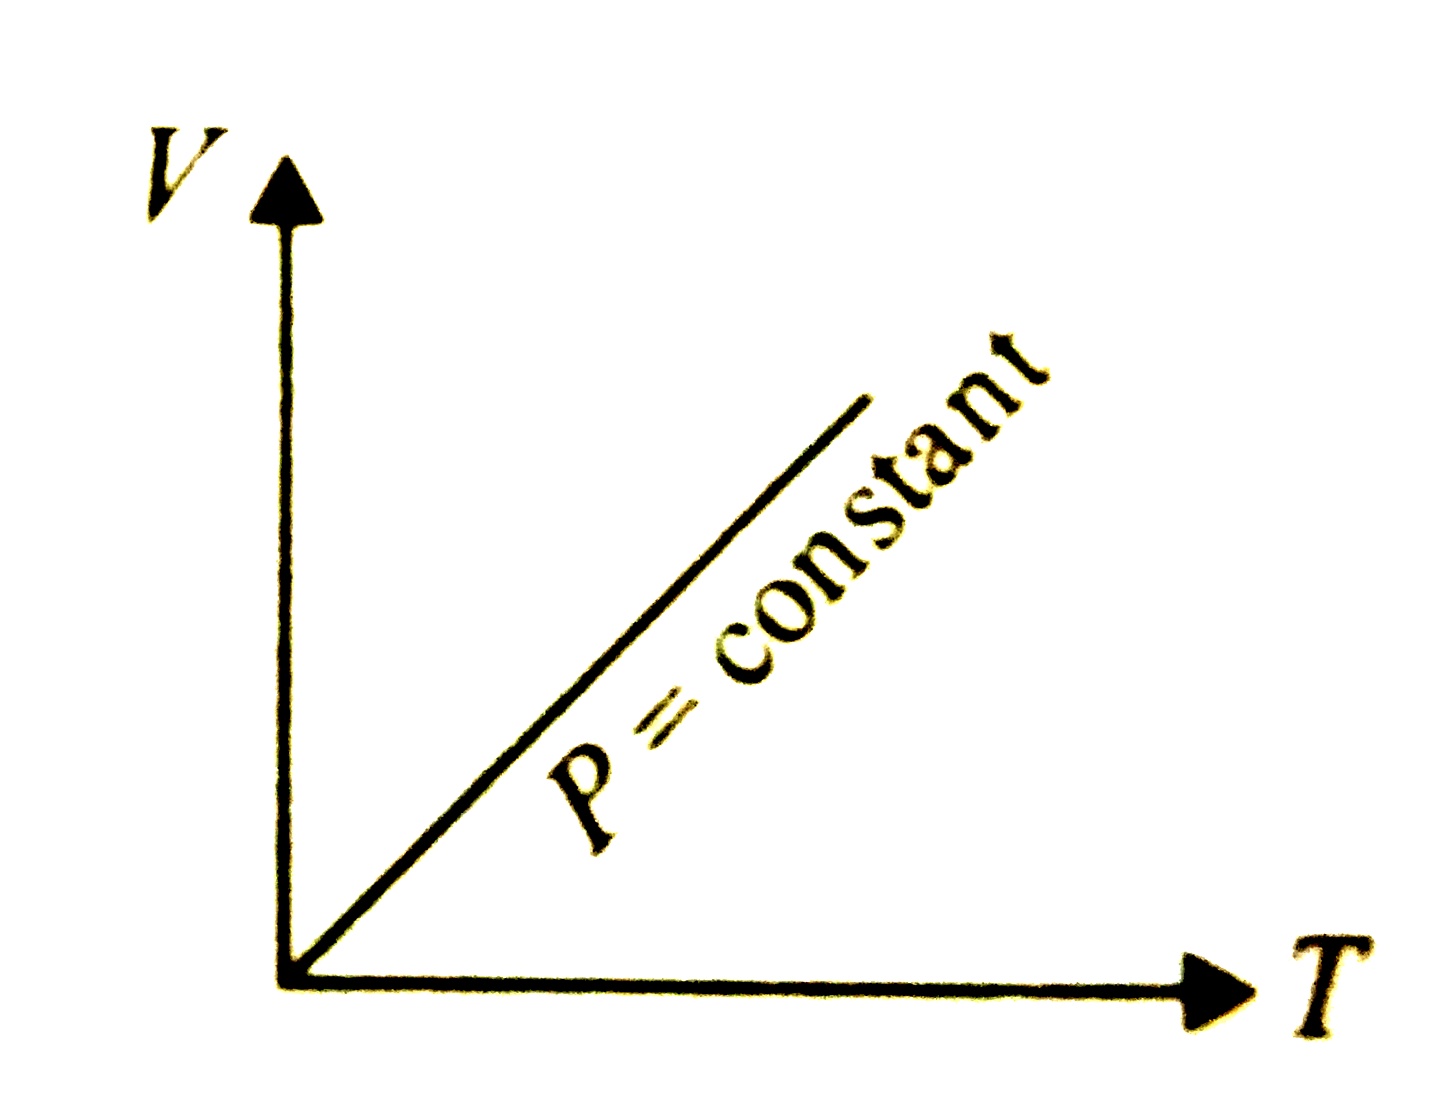 B2.
B2.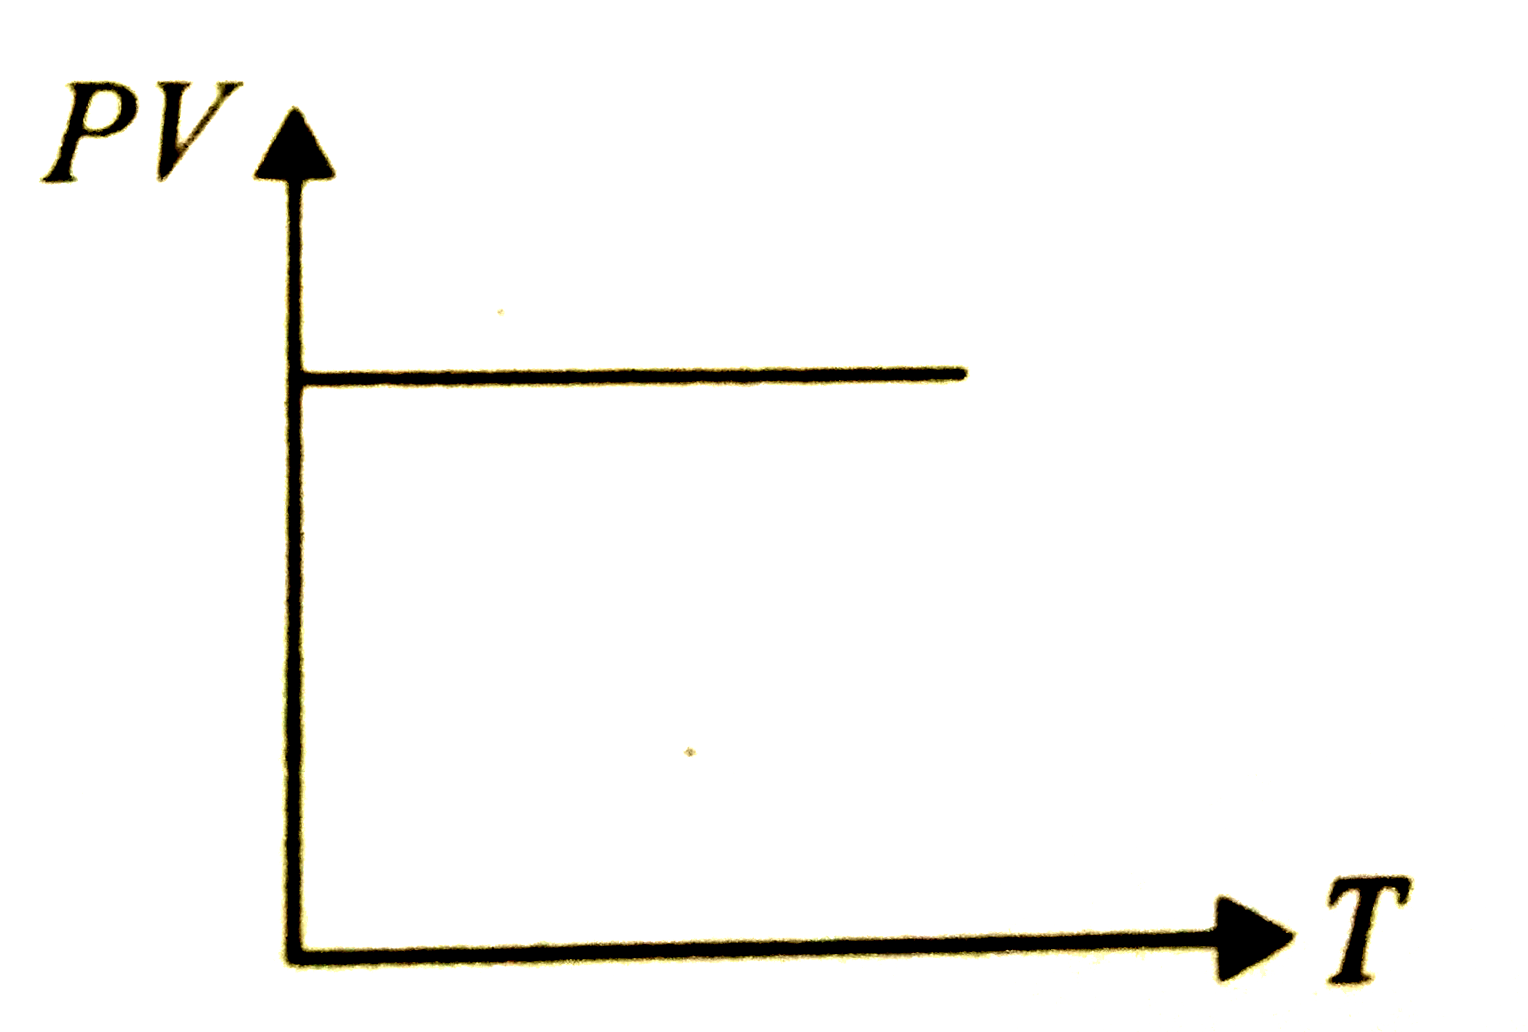 C3.
C3.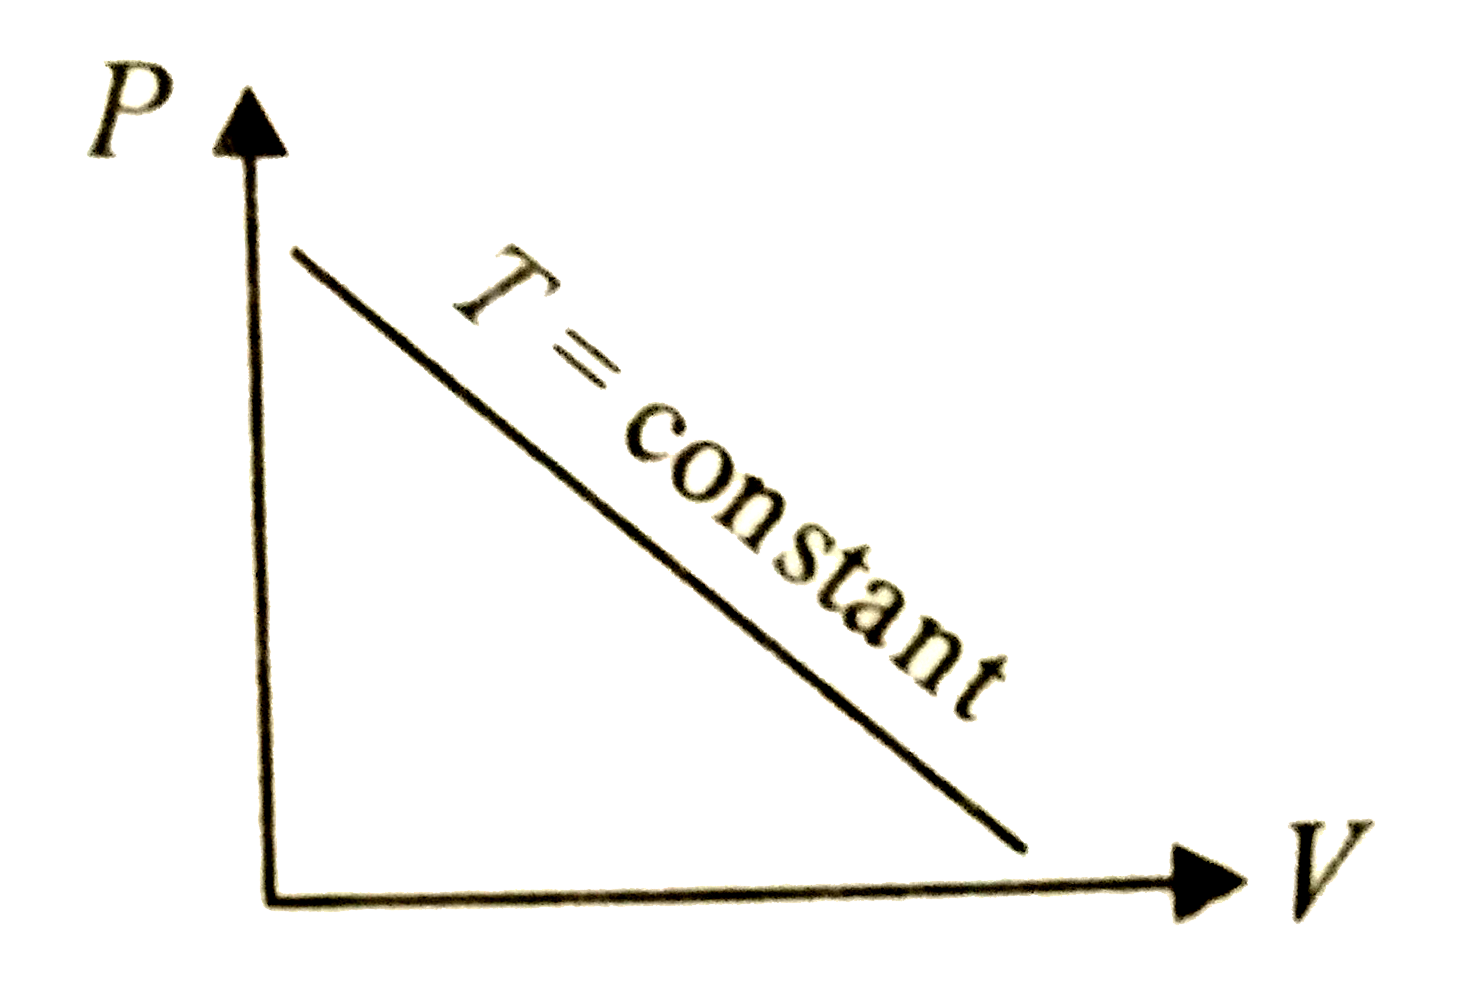 D4.
D4.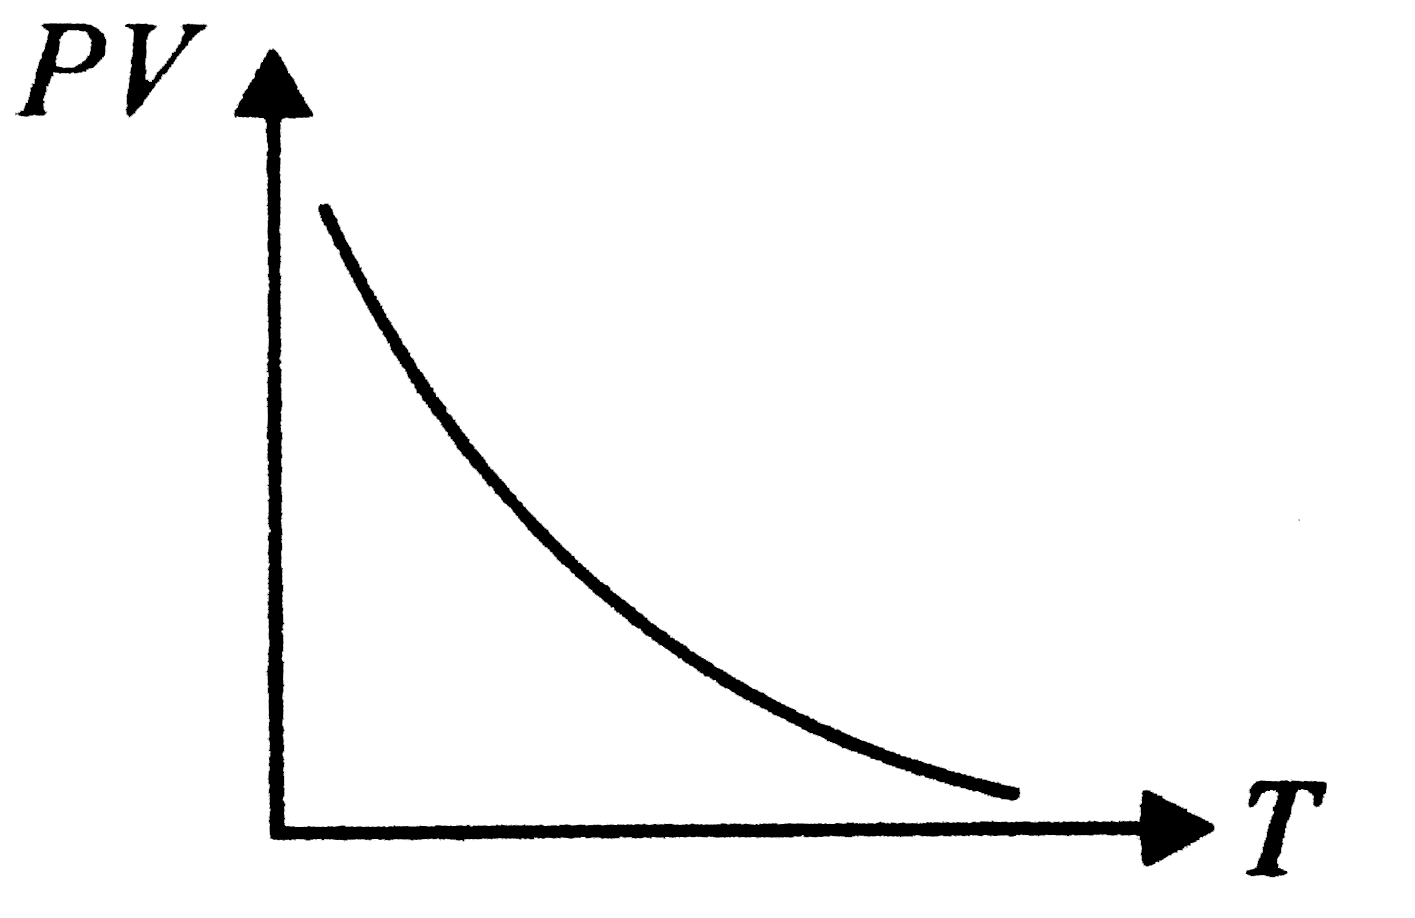
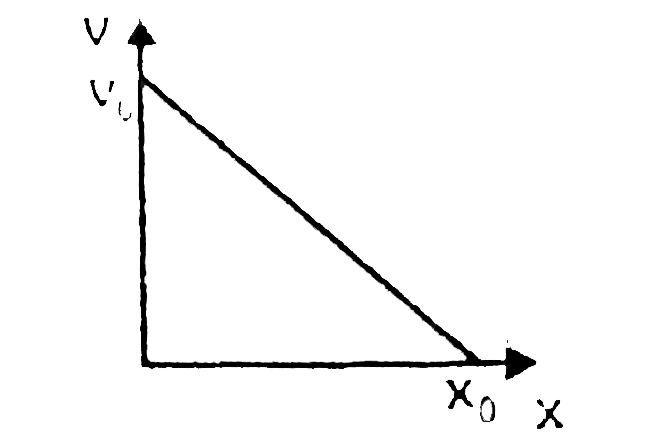
The given graph shows the variation of velocity with displacement. Which one of the graphs given below correctly represents the variation of acceleration with displacement ?
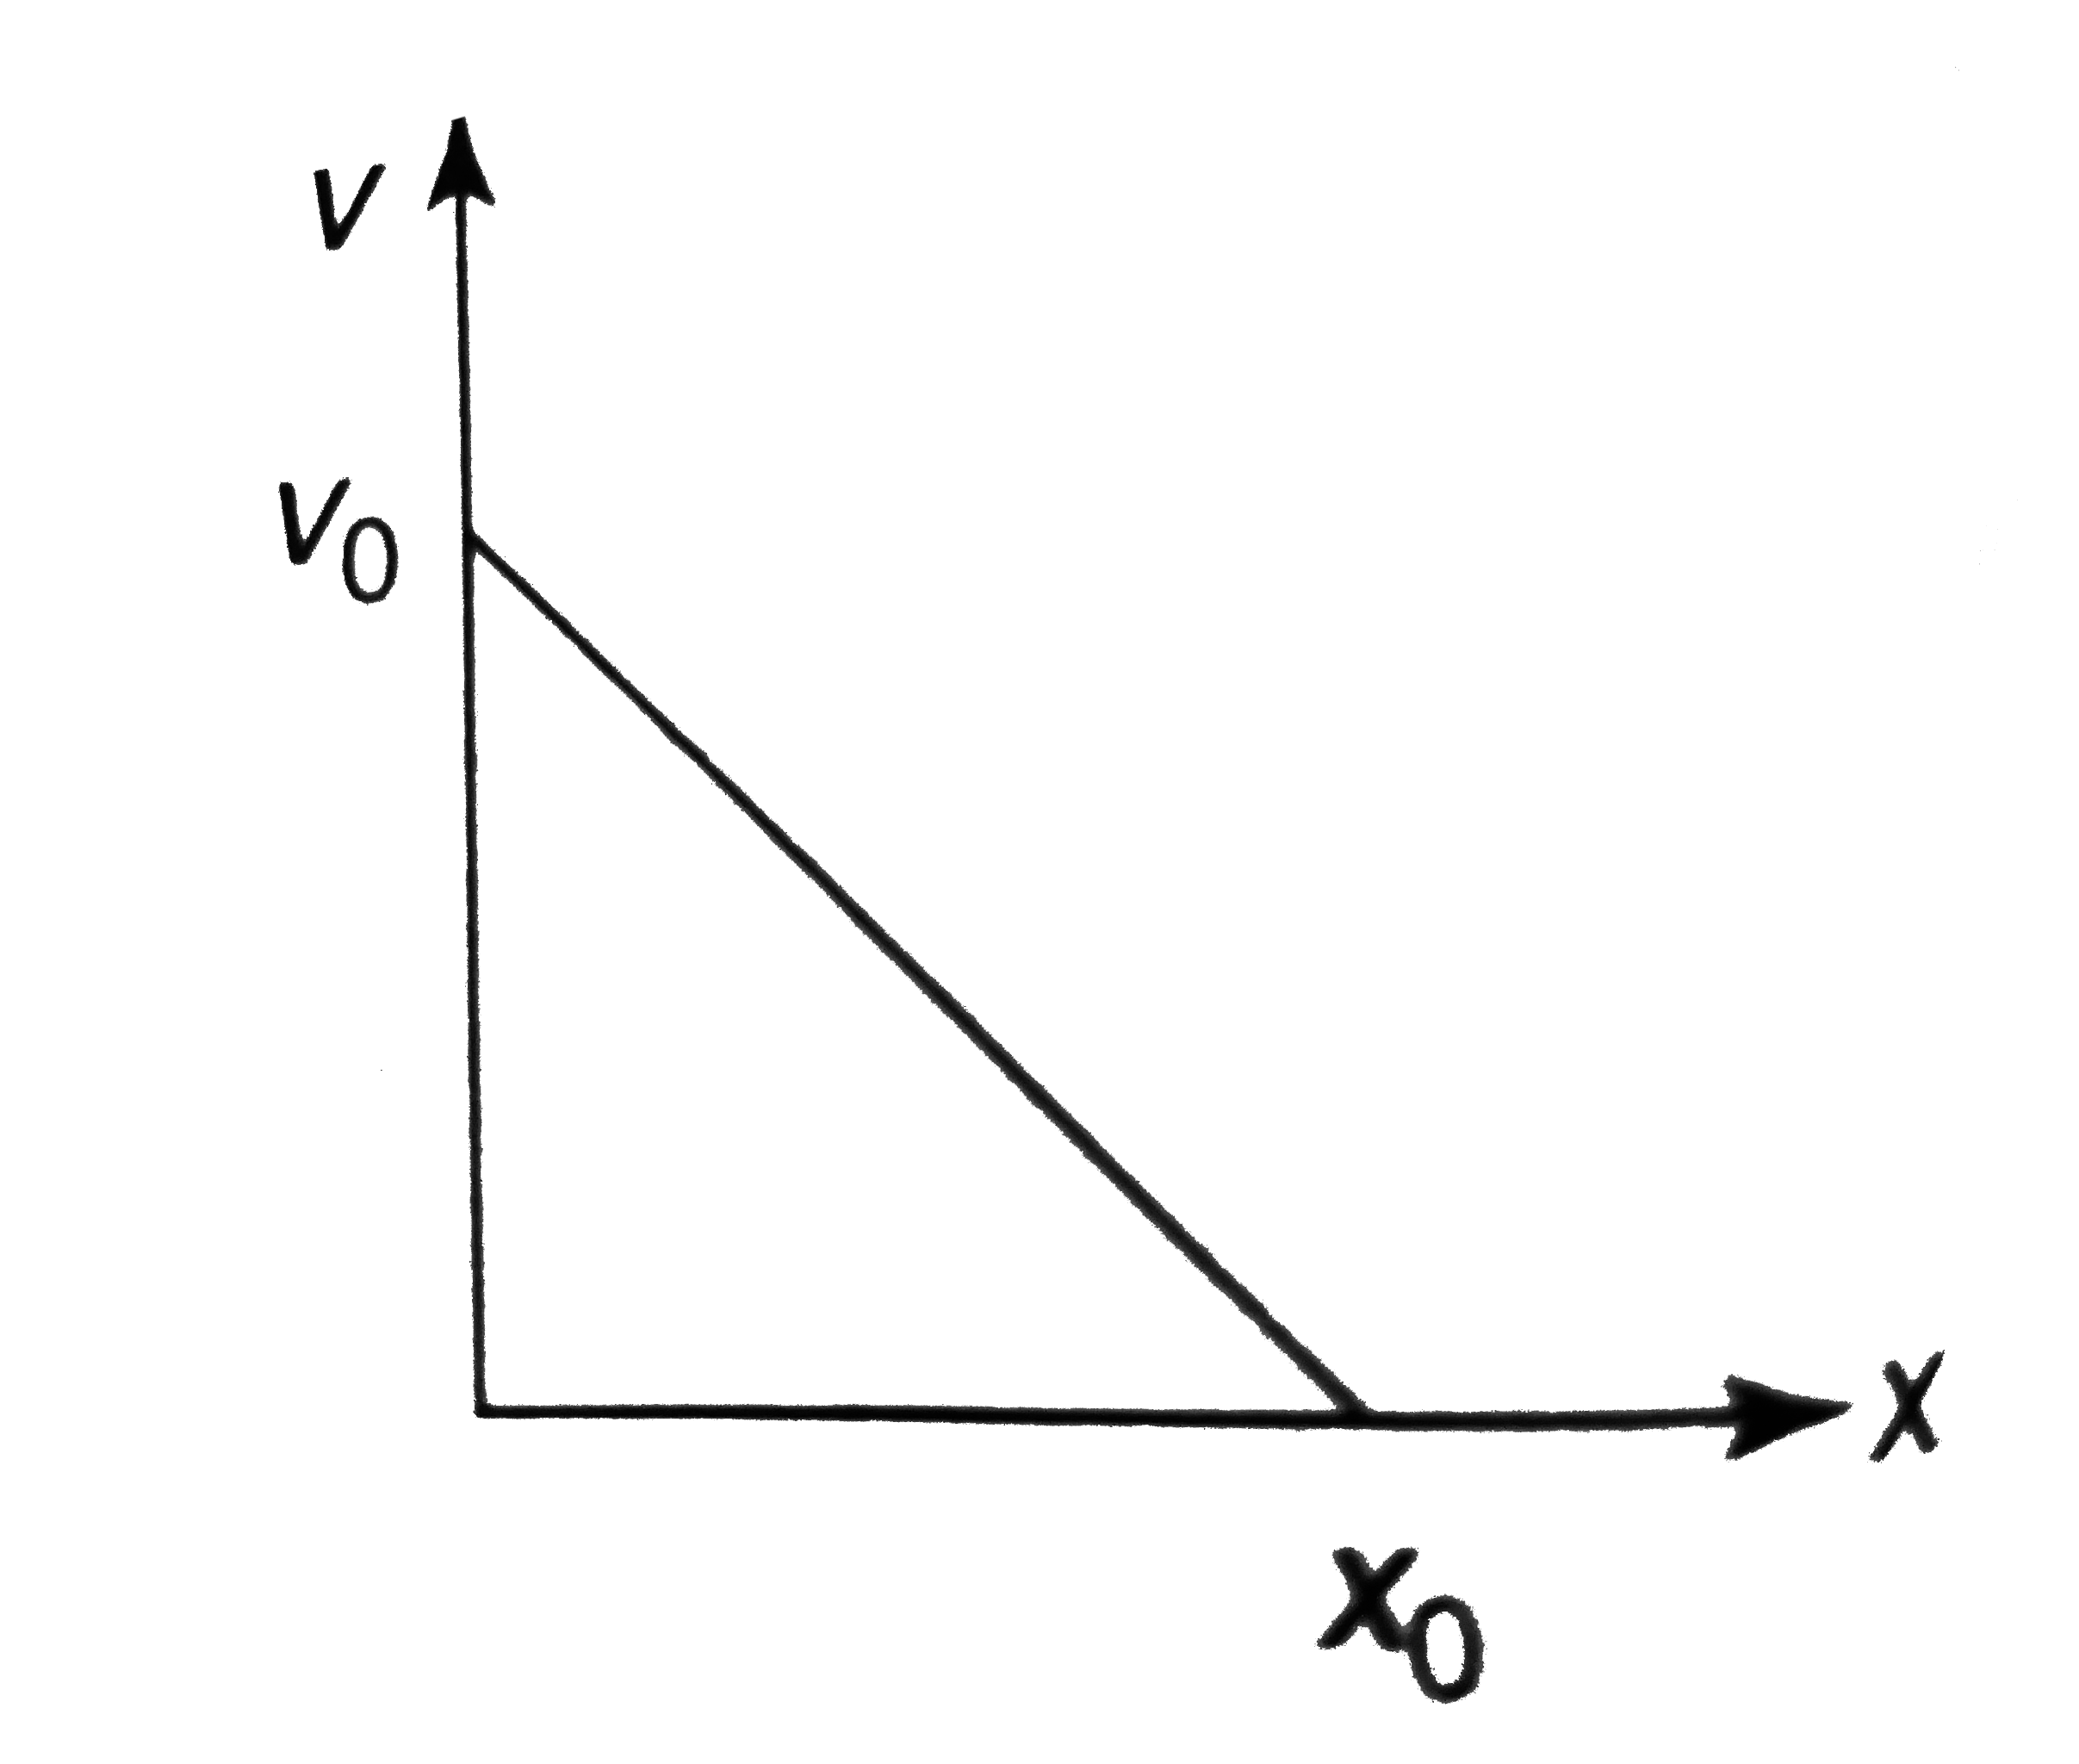 View Solution
The given graph shows the variation of velocity with displacement. Which one of the graph given below correctly represents the variation of acceleration with displacement :-
 View Solution
The given (p - U) graph shows the variation of internal energy of an ideal gas with increase in pressure. Which of the following pressure - volume graph is equivalent to this graph ?
 .View Solution
1 meter long metallic wire is broken into two unequal parts PandQ.P part of the wire in uniformly extended into another wire R. Length of R is twice the length of P and the resistance of R is equal to that of Q. Find the ratio of the resistance P and R and also the ratio of the length PandQ
View Solution(a) Draw graph showing the variation of current versus voltage in an electroyte when an external resistance is also connceted.
(b) (i) The graph between resistance (R ) and temperature (T) for Hg is shown in the figure (a). Explain the behaviour of Hg near 4k.
(ii) In which region of the graph shown in the figure (b) is the resistance negative and why?
 View Solution
Each of the pictures shows four objects tied together with rubber bands being pulled to the right across a horizontal frictionless surface by a horizontal force F. All the objects have the same mass, all the rubber bands obey Hooke's law and have the same equilibrium length and the same force constant. Which of these pictures is drawn most correctly?
View Solution

